PPM WIDGETS FOR MASHZONE NEXTGEN - ARIS PROCESS PERFORMANCE MANAGER VERSION 10.5.2 - Software AG ...
←
→
Page content transcription
If your browser does not render page correctly, please read the page content below

ARIS PROCESS PERFORMANCE MANAGER
PPM WIDGETS FOR MASHZONE
NEXTGEN

VERSION 10.5.2
April 2021

SOFTWARE AG
This document applies to ARIS Process Performance Manager Version 10.5.2 and to all
subsequent releases.
Specifications contained herein are subject to change and these changes will be reported in
subsequent release notes or new editions.
Copyright © 2000 - 2021 Software AG, Darmstadt, Germany and/or Software AG USA Inc.,
Reston, VA, USA, and/or its subsidiaries and/or its affiliates and/or their licensors.
The name Software AG and all Software AG product names are either trademarks or registered
trademarks of Software AG and/or Software AG USA Inc. and/or its subsidiaries and/or its
affiliates and/or their licensors. Other company and product names mentioned herein may be
trademarks of their respective owners.
Detailed information on trademarks and patents owned by Software AG and/or its subsidiaries
is located at https://softwareag.com/licenses.
Use of this software is subject to adherence to Software AG's licensing conditions and terms.
These terms are part of the product documentation, located at
https://softwareag.com/licenses and/or in the root installation directory of the licensed
product(s).
This software may include portions of third-party products. For third-party copyright notices,
license terms, additional rights or restrictions, please refer to "License Texts, Copyright Notices
and Disclaimers of Third Party Products". For certain specific third-party license restrictions,
please refer to section E of the Legal Notices available under "License Terms and Conditions for
Use of Software AG Products / Copyright and Trademark Notices of Software AG Products".
These documents are part of the product documentation, located at
https://softwareag.com/licenses and/or in the root installation directory of the licensed
product(s).
PPM WIDGETS FOR MASHZONE NEXTGEN
Contents
Contents ....................................................................................................................... I
1 General .................................................................................................................. 1
2 Install custom widgets ............................................................................................. 2
3 Update custom widgets ............................................................................................ 3
4 Insert custom widget in a dashboard.......................................................................... 4
5 Function Flow widget................................................................................................ 5
5.1 What is the Function Flow diagram? ................................................................. 5
5.2 Single functions in the function flow ................................................................. 7
5.3 Assign data sources ....................................................................................... 7
5.3.1 Assign data columns of a Process Mining context ....................................... 8
5.3.1.1 Configure thresholds .................................................................... 8
5.3.1.2 Column matching ......................................................................... 9
5.3.2 Settings .............................................................................................. 10
5.4 Specify the widget settings ........................................................................... 14
5.5 Set selections and filters ............................................................................... 18
5.6 Use the Function Flow diagram ...................................................................... 20
5.7 How to display function data ......................................................................... 22
6 Jump to PPM client widget ...................................................................................... 24
6.1 Insert text .................................................................................................. 24
6.2 Specify the widget settings ........................................................................... 24
6.3 SAML Authentication .................................................................................... 25
7 Process Variants widget .......................................................................................... 26
7.1 What is the Process Variants widget? ............................................................. 26
7.2 Specify the widget settings ........................................................................... 27
7.3 Assign data sources to the Variant widget ....................................................... 29
7.3.1 Assign data columns of a PPM context .................................................... 29
7.3.1.1 Column matching ....................................................................... 30
7.3.2 Settings .............................................................................................. 30
7.4 Set selections and filters ............................................................................... 32
8 Root Cause Miner widget ........................................................................................ 33
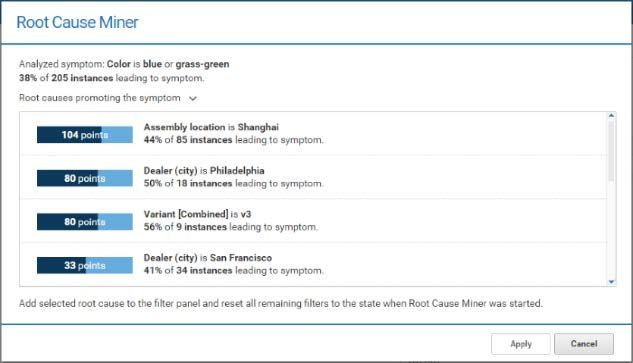
8.1 Start a root cause analysis ............................................................................ 33
8.2 Analyze the Root Cause Miner results ............................................................. 35
8.3 Specify the widget settings ........................................................................... 36
9 Appendix .............................................................................................................. 38
9.1 What is the Process Mining context? ............................................................... 38
9.1.1 Automatic filtering ............................................................................... 38
9.2 Multi-lingual dashboards ............................................................................... 38
10 Legal information................................................................................................... 40
10.1 Documentation scope ................................................................................... 40
10.2 Data protection ........................................................................................... 41
10.3 Restrictions ................................................................................................. 41
IPPM WIDGETS FOR MASHZONE NEXTGEN
1 General
This documentation provides an overview of the custom PPM widgets provided for MashZone
NextGen. The manual describes how to configure and use the widgets in MashZone NextGen.
In MashZone NextGen you can configure and use the custom widgets in the same way as the
available dashboard widgets. For example, you can set selections or use the custom widgets as
filter widgets.
Warning
Use MashZone NextGen version 10.5 only with PPM widgets of version 10.5.1. Do not use any
MashZone NextGen version prior to 10.5 with PPM widgets of version 10.5.1.
For general use of MashZone NextGen dashboards, see the MashZone NextGen Online Help.
1PPM WIDGETS FOR MASHZONE NEXTGEN
2 Install custom widgets
You must install custom widgets manually in MashZone NextGen.
The installation requires a widget zip file, which is located in the PPM installation directory.
\ppm\server\bin\work\data_ppm\MashZone_NextGen_BA\customWidgets\
Procedure
1. Copy the relevant widget file in the customWidgets folder of your MashZone NextGen
installation and unpack the zip file.
\apache-
tomcat\webapps\mashzone\hub\dashboard\ widgets\customWidgets
This creates a custom widget subfolder, for example, functionFlowWidget.
2. Restart the MashZone NextGen server.
a. Open the Software AG/Stop servers program folder.
b. Click Stop MashZone NextGen Server.
c. Open the Software AG/Start servers program folder.
d. Click Start MashZone NextGen Server.
The PPM custom widget is now available in MashZone NextGen.
2PPM WIDGETS FOR MASHZONE NEXTGEN
3 Update custom widgets
Custom widgets are not updated by the normal update process. You must update the widgets
manually.
Procedure
1. Delete the folder of the custom widget from the MashZone NextGen installation directory.
\apache-tomcat\webapps\mashzone\hub\dashboard\
widgets\customWidgets\
2. Install the updated widget version.
3. Update the style template.
a. Open a dashboard in MashZone NextGen.
b. Click Manage > Change style template in the dashboard main menu.
c. Click Update.
d. Click OK.
Detailed information on how to update style templates can be found in the MashZone
NextGen online help.
Your custom widget for MashZone NextGen is updated.
3PPM WIDGETS FOR MASHZONE NEXTGEN
4 Insert custom widget in a dashboard
You can insert a custom widget in your MashZone NextGen dashboards.
For detailed information on how to use the MashZone NextGen dashboard editor, see the
MashZone NextGen Online Help.
If more than one PPM custom widget is installed, the widgets are grouped in the widget bar. By
default, only one custom widget is visible, all other widgets are displayed when you hover your
mouse over the custom widget.
Prerequisite
You have installed the custom widget in MashZone NextGen (page 2).
Procedure
1. Start MashZone NextGen.
2. Open or create a dashboard in the dashboard editor.
3. Click the widget button, for example, Function Flow. The button is located at the left
hand side of the dashboard editor.
The widget is inserted as blank box in your dashboard.
4PPM WIDGETS FOR MASHZONE NEXTGEN
5 Function Flow widget
The Function Flow widget provides the PPM Function Flow diagram (page 5) as a further
dashboard widget to MashZone NextGen.
For general use of MashZone NextGen dashboards and widgets, see the MashZone NextGen
Online Help.
5.1 What is the Function Flow diagram?
The Function Flow diagram enables you to analyze the sequence of activities within your
business processes. You can use the Function Flow diagram to clearly display and evaluate
the process structure and the relationship between the activities.
DIAGRAM LAYOUT
NODES AND CONNECTIONS
A Function Flow diagram begins with a start node and has only outgoing connections (except
self-loops). The end node of the diagram has only incoming connections (except self-loops). All
other functions have at least one incoming and one outgoing connection.
If the number of start and end functions (page 10) is configured, special start and end nodes
are displayed in the graph. The outgoing and incoming connections of the special start and end
nodes are drawn with a dashed line. The value on the connections shows the number of times
the function was a start or end function in an EPC.
The line weight of a connection is defined by its relevance value (page 10). In addition to the
stroke-size, the line transparency of the connections also depends on their relevance.
Connections of start and end nodes always have the same line weight and are not displayed
transparently.
SYMBOLS
The Function Flow diagram can be displayed with symbols of EPC or BPMN style (page 10).
The symbol size is fixed, and the function name within a symbol is automatically adjusted. If
the visualization of the function measure value is configured, the measure value is displayed in
the bottom right corner of a symbol. In addition, a tooltip containing the complete function
name and the measure is displayed on each node.
5PPM WIDGETS FOR MASHZONE NEXTGEN
Example
Function Flow diagram with EPC symbols and special start and end nodes.
6PPM WIDGETS FOR MASHZONE NEXTGEN
5.2 Single functions in the function flow
A Function Flow diagram can contain individual functions separate from the process flow. In
rare cases, the Function Flow diagram can only consist of one function.
To display single nodes in the function flow, at least one of the measures Number of start
functions, Number of end functions, or any other additional function measure must be
configured. (For details, see chapter Settings (page 10).)
If the function flow diagram only contains separate functions, the diagram does not contain a
slider component and no tooltips are available.
When you select one of the isolated nodes and the Self-filtering option is enabled on the
widget Context tab (see Specify the widget settings (page 14)), the Function Flow widget
displays only the graph that contains the single node. If this node is the only node in the
Function Flow diagram, the widget displays only this node.
5.3 Assign data sources
Before you can display content in a dashboard widget, you must first assign a data source to
this widget. You can select PPM as data source or any desired data source available in
MashZone NextGen.
Procedure
1. Click the Function Flow widget on the dashboard. The relevant properties dialog is
displayed.
2. Click Assign data to edit the data source assignment. The Assign data (1/2) dialog
is displayed.
Here you can select a data source and specify your data source settings.
3. Click Next.
4. The Assign data (2/2) dialog is displayed.
Here you can assign the data source columns to the individual widget elements. See
Settings (page 10) for details.
5. Assign the data columns to the widget elements using drag and drop.
6. Click the assigned columns to specify the column settings. See Settings (page 10) for
details.
7. Click OK to save your settings.
The widget shows a Function Flow diagram based on the data of the assigned data source.
7PPM WIDGETS FOR MASHZONE NEXTGEN
5.3.1 Assign data columns of a Process Mining context
If you have configured a Process Mining context (page 38) for your dashboard, you need only
assign the data columns provided by the Process Mining context to the elements of the
dashboard widgets (Assign data (2/2) dialog). You do not have to assign a data source to
each widget first (Assign data (1/2) dialog). The Process Mining context is automatically
assigned to all widgets in the dashboard that have no data source assigned.
By default, the Process Mining context provides all available data columns of the PPM system.
For the Function Flow widget, the columns are automatically filtered, and the Process Mining
context provides all relevant data columns.
Procedure
1. Click the Function Flow widget on the dashboard. The relevant properties dialog is
displayed.
2. Click Assign data to edit the data source assignment. The Assign data (2/2) dialog
is displayed.
Here you can assign the data source columns to the individual widget elements. For
details, see chapter Settings (page 10).
3. Assign the data columns of the Process Mining context to the widget elements using drag
and drop.
4. Click the assigned columns to specify the columns settings. For details, see chapter
Settings (page 10).
5. You can configure thresholds for the function measure values (page 8).
6. Click OK to save your settings.
The widget shows a Function Flow diagram based on the data of the assigned data source.
If you do not want to use context-based data columns, you can assign any other data source
provided. You can change the data source by clicking Use other data. The Assign data
(1/2) dialog opens. Here you can assign any data source provided. If you assign another data
source, you cannot reassign the PPM context to the dashboard widget. For details, see chapter
Assign data sources (page 7).
If required, you can adjust the list of data columns provided for the data columns assignment.
Click Edit context to edit the data columns specified in the Process Mining context.
For details on using and configuring a Process Mining context, see the MashZone NextGen
online help.
5.3.1.1 Configure thresholds
You can define thresholds for the function measures to display their status. In view mode, a
colored marker shows the threshold range in which a function measure value is located.
Procedure
1. Click a Function measure value box that contains an assigned data column.
2. Under Thresholds, click a Color box to select a color for each threshold.
8PPM WIDGETS FOR MASHZONE NEXTGEN
3. Select an operator for each threshold to define the measure value range, for example, <
(less than).
4. Enter a value for each threshold.
Only numeric values are allowed.
5. Click the Plus button to add a threshold or click the Minus button to remove a
threshold.
By default, there are initially three lines to configure thresholds.
The thresholds are configured.
In dashboard view mode, you can view the colored markers for each function measure for
which you have specified thresholds. (page 20)
5.3.1.2 Column matching
To facilitate the assignment of the source columns to the widget elements, the names of the
source columns are automatically matched to the default names of the columns in the
standard customizing (in English and German only). The matching is only done if there are no
columns already assigned to some widget elements.
The following elements of the Function Flow widget are matched (the comparison is case
insensitive):
Start function
Contains "Function (Start)"
Contains "(Start)"
End function
Contains "Function (Target)"
Contains "(Target)"
Function names
Contains "Function" then
Is exactly "Function"
Number of start functions
Contains "Number of start functions" then
Contains "Number of start functions"
Number of end functions
Contains "Number of end functions" then
Contains "Number of end functions"
Relevance column
Is estimated if there is only a single column with type numeric, then
Is exactly "Number of processes" then
Contains "Number of processes"
9PPM WIDGETS FOR MASHZONE NEXTGEN
If there is no matching source column for a widget element, the widget element stays
unassigned, and you must manually assign the column to be used.
5.3.2 Settings
The Function Flow diagram enables you to analyze the sequence of activities within your
business processes. Using the function flow diagram, you can clearly display and evaluate the
process structure and the relationships between the activities.
The Function Flow diagram requires a column for the Start function, End function, and the
Relevance value respectively. Additionally, you can define further connection values in the
optional list field Additional connection values. These values are available in the settings
menu in the Function Flow diagram, and the value order corresponds to the order in the list
field. The fields Function names and Function measure value are used to display function
measures in the Function Flow diagram (page 22).
By default, you can change the Display name and the Format of the relevance and
connection values. By changing the Sorting of the relevance column, you can specify how
connections are assessed. If you select Ascending, high values are considered positive (for
example, revenue). If you select Descending, low values are considered positive (for
example, costs).
The widget allows you to use the same column for the Relevance, Additional connection,
and Function measure widget elements without changing the name. If the widget elements
use the same columns but different aggregation types, you must assign different names to the
individual widget elements.
OPTION LIST
Field Description
Start function Contains the column of the start nodes. These nodes are
used as a starting point for the connections and a
connection line is drawn to the end node.
This field is required and only allows unique text columns.
If the field is empty, no graph is displayed.
End function Contains the column of the end nodes. These nodes are
used as a target point for the connections and a connection
line is drawn from the start node to the end node.
This field is required and only allows unique text columns.
If the field is empty, no graph is displayed.
10PPM WIDGETS FOR MASHZONE NEXTGEN
Field Description
Relevance value Contains the column of the relevance values. The
relevance value calculates the line weight of the
connections, if enabled. The sorting of the relevance can
be changed via a property.
This field is required and only allows numeric columns
which are not already used as additional connection value.
The default format is 1,234 without decimals.
If the field is not filled, no graph is shown.
Additional connection values Can be used to define additional values that can be
displayed on connections. The order determines the order
in the later selection box. The box can be used to switch
between these values.
This field is optional and only allows numeric process
columns and columns that contain relation measures.
Note that you must reassign the columns if invalid columns
have already been assigned from an earlier version. Invalid
columns are marked red.
Function names Contains the column with the function names. It must be a
column other than the start or end function because the
start function ignores nodes without outgoing connections
& end function ignores nodes without incoming connections
and therefore not all required function names are
contained in these columns.
This field is optional and only allows columns of Text type.
It is used to map function measures to the functions.
11PPM WIDGETS FOR MASHZONE NEXTGEN
Field Description
Function measure value Contains the columns of the function measure values. The
data of the columns is displayed as a function measure
within the function nodes. You can specify several function
measures that can be selected in the Function Flow
diagram using a selection box. However, it is only possible
to display the values of one measure at the same time. If
only one measure is specified, the corresponding values
are automatically displayed. The column order determines
the order in the selection box.
Note that you must reassign the columns if invalid columns
have already been assigned from an earlier version. Invalid
columns are marked red.
Optional.
Numeric columns only.
Only columns containing function measures and numeric
process columns are allowed.
You can configure thresholds for each specified function
measure. (page 8)
If the field is used, the Function names field is required.
SINGLE FUNCTIONS
If you want to display functions that have no predecessor
or successor functions or that are the only functions in the
process, you must configure at least one of the measures
Number of start functions or Number of end functions.
Number of start functions Contains the column that indicates how often a particular
function is considered as the start function of an EPC (no
incoming edges). The column data is displayed in the
diagram together with the numerical value and associated
with a function box.
The default format is 1,234 without decimals.
The field is optional.
The field allows only numeric columns.
The name must be changed if the column is already used
elsewhere.
If the field is used, the Function names field is required.
However, the Number of end functions field is not
required.
12PPM WIDGETS FOR MASHZONE NEXTGEN
Field Description
Number of end functions Contains the column that indicates how often a particular
function is considered as the end function of an EPC (no
outgoing edges). The column data is displayed in the
diagram together with the numerical value and associated
with a function box.
The default format is 1,234 without decimals.
The field is optional.
The field allows only numeric columns.
The name must be changed if the column is already used
elsewhere.
If the field is used, the Function names field is required.
However, the Number of start functions field is not
required.
Advanced options
Field Description
Display name New column name displayed in the widget, for example,
used for KPI, data points or tool tips. By default, the data
source column name is used.
Aggregation Specifies how the KPI value is calculated. Available for
numeric columns. Default is Average value.
The number of aggregation types provided by context-
based widgets may differ from that of non-context-based
widgets.
Format Output format of the column values, for example, used for
data points or tool tips. Available for columns of date and
numeric type.
Round Numerically Displays rounded measure values in the chart. Available
for numeric columns. Enabled by default.
Sorting Sorts the values of the selected element in ascending or
descending order.
13PPM WIDGETS FOR MASHZONE NEXTGEN
5.4 Specify the widget settings
You can specify the widget settings in the widget properties dialog.
Procedure
1. Click the Function Flow widget on the dashboard. The relevant properties dialog is
displayed.
2. Specify your settings. See the display options list below.
3. Click the Interactive mode icon to activate the interactive mode. In the interactive
mode, you can edit the diagram layout. See the display options list below.
The Function Flow diagram is laid out automatically. But you can change the diagram
layout in interactive mode manually.
4. You can preselect the measure that is to be displayed initially in the functions in view
mode.
Select a measure from the Values shown at functions node drop-down menu and save
the dashboard. If only one measure is specified in the data assignment (page 8), no
selection box is available,and the corresponding values are displayed automatically.
5. To set the Process Mining context options, click Context.
Your settings are applied.
Display Options
General Options Description
Name Optional widget name.
Container Hide header: Hides the header as well as the
title of the component, and resizes the
content of the container. Click the icon again
to display the header. The header is hidden
by default.
Hide border: Hides the outline of the
component container. Click the icon again to
display the outline. The border is visible by
default.
Container style Selects the style type of the container. The
container styles available in the drop-down
menu are part of the style template selected
for the current dashboard. The Default
widget style is preselected.
14PPM WIDGETS FOR MASHZONE NEXTGEN
General Options Description
Style Selects the style type of the component. The
component styles available in the drop-down
menu are part of the style template selected
for the current dashboard. The Default
widget style is preselected.
Auto refresh Specifies the automatic data retrieval for the
component.
Show menu Enables the widget menu in view mode. In
view mode, you can display the widget menu
by clicking the Menu icon in the widget
header. In the widget menu, you can, for
example, clear a selection, refresh the data
displayed, or save the component widget in a
CSV file.
Specific Function Flow widget options Description
Edit widget Activates the interactive mode. The
interactive mode ( ) enables you to perform
the following actions.
- You can resize the diagram using the mouse
wheel.
- You can move the entire diagram or the
individual function symbols using drag and
drop. To move the complete graph, click an
empty space within the widget and hold down
the mouse button. You can move the graph
until you release the mouse button.
You can select a connection value. You can
select a value in the widget Settings menu if
you have set at least one value using the
Additional connection values option in the
Assign data (2/2) dialog. See Assign data
sources (page 7).
- You can enable the magnifier. Click
Settings and select Enable magnifier.
- You can modify the relevance slider view
and the relevance slider value. The slider
value is not saved in the dashboard.
15PPM WIDGETS FOR MASHZONE NEXTGEN
Specific Function Flow widget options Description
Symbol style Selects the style of the symbols used in the
function flow diagram. The diagram can be
displayed with EPC and BPMN symbols. The
default symbols are of EPC style. Depending
on the selected symbol style, the diagram
layout changes, including the start and end
nodes.
When the symbol style is changed, the layout
of the graph is automatically adjusted.
Layout Reset initial: Restores the initial diagram
layout.
Zoom Reset: Restores the initial diagram size.
Relevance slider Enables the relevance slider in the dashboard
view and edit mode.
If the Function flow diagram contains only
single functions, the Relevance slider
component is disabled.
Connection labels Displays the connection values in the
diagram. The connection values defined in the
data assignment (page 7) can be displayed or
hidden beside the connections. By default, the
relevance values are displayed beside the
connections. If an additional connection value
is defined, it is displayed as the connection
value instead. If more than one additional
connection value is defined, a drop-down
menu is provided in the settings menu for you
to select the values that are to be displayed
beside the connections. By default, the first
additional connection value is displayed.
Connection weight Displays the connection weight in the
diagram. The connection weight is indicated
by the connection thickness.
16PPM WIDGETS FOR MASHZONE NEXTGEN
Specific Function Flow widget options Description
Multiple selection Enables multiple selections for the Function
Flow widget. In view mode, you can select
multiple functions simultaneously. You can
select one function after the other and the
corresponding filters are added and applied to
the widgets.
The option is enabled by default.
When multiple selection is enabled, the
filtering of connections is disabled.
Connections in the Function Flow diagram
cannot be selected and no connection filters
can be set from outside the Function Flow
widget.
Context options
The following options are available on the Context tab. The Context tab is available if the
Process Mining context is enabled for the dashboard.
Context options Description
Exclude widget from being filtered. Excludes a dashboard widget from being
filtered by the Process Mining context. It
displays only unfiltered context data and does
not respond to context filtering.
The excluded widget can still be used to filter
other context widgets.
17PPM WIDGETS FOR MASHZONE NEXTGEN
Context options Description
Self-filtering Using the Self-filtering option, you can
directly view the results of a filter that is
applied. If a filter is set within the Function
Flow diagram, this filter is also applied to the
Function Flow diagram itself. (By default,
the widget producing the filter is excluded
from being filtered by this filter).
The option is enabled by default.
When the Self-filtering option is enabled,
connections in the function flow cannot be
selected. The filtering of connections is
disabled.
If there is no value in the context filter or the
widget is excluded from being filtered
("Exclude widget from being filtered" is
checked), the Self-filtering option will be
disabled.
5.5 Set selections and filters
The Function Flow widget supports the filter and selection functionalities of MashZone
NextGen dashboards. You set filters and selections to define relations and interactions between
several dashboard widgets.
The Function Flow widget can be used to set a selection or a filter in other dashboard
widgets. Furthermore, single functions or connections of the widget can be selected by other
widgets. Additionally, the entire widget can be filtered by other widgets.
Details on how to use filters and selections can be found in the MashZone NextGen Online
Help.
For setting selections and using coordinates in other widgets, keep the following in mind:
The NodeName coordinate contains the function name of the selected function. If multiple
selection is enabled, the coordinate contains a list of the function names. This coordinate
only contains one or more values if at least one function is selected.
There is a coordinate for the function name value configured. This coordinate is only
available if the widget runs in Process Mining context (page 38) mode. The name of the
coordinate corresponds to the relevant column name. The coordinate contains a list of
node names if one or more functions are selected (multiple selection). The coordinate
contains a single value or an array of values depending on the active selection mode
(single or multiple selection).
18PPM WIDGETS FOR MASHZONE NEXTGEN
There is a coordinate for every function measure value configured. The name of the
coordinate corresponds to the relevant column name. This coordinate only contains values
when at least one function is selected. The coordinate contains a single value or an array
of values depending on the active selection mode (single or multiple selection).
The StartNode and EndNode contain the names of the respective connections. The
StartNode coordinate contains the name of the function where the connection starts and
the EndNode coordinate contains the name of the function where the connection ends.
These coordinates only contain values when a connection is selected.
There is one coordinate for every connection value configured.The name of a coordinate
corresponds to the relevant column name. These coordinates only contain values when a
connection is selected.
The SliderValue coordinate contains the current filter value of the relevance slider
control. This value is updated after changes to the slider itself or by pressing any of the
two slider buttons. If the SliderValue coordinate is set, the functions and connections are
filtered accordingly. The values of the other connections are only changed if the currently
selected function or connection is no longer visible (in which case the selection is
removed).
Functions can be selected by setting the NodeName coordinate or by setting the function
measure coordinate. In single selection mode, the selection may be assigned ambiguously.
That is, there is more than one function with the same value. In this case, a function is
selected randomly. If the multiple selection mode is enabled and there is more than one
function with the same value, all functions are selected.
If the widget is used in Process Mining context mode, a function can also be selected using the
coordinate for the function name, similar to the NodeName coordinate.
Connections can be selected by setting the StartNode, EndNode or connection value
coordinate or an arbitrary combination of these coordinates. Thereby, not all coordinates need
to contain values. In single selection mode, the selection may be assigned ambiguously, that
is, there is more than one connection with the same value or more than one connection with
the same start node. In this case a connection is randomly selected. If multi selection is
enabled and there is more than one function with the same value, all functions are selected.
The SliderValue coordinate can be set by other widgets. Then the corresponding value is set
on the slider and the connections and functions are displayed or hidden accordingly.
19PPM WIDGETS FOR MASHZONE NEXTGEN
5.6 Use the Function Flow diagram
In dashboard view mode, you can use the Function Flow diagram interactively.
In view mode, you can
select individual functions and connections, for example, for filtering other widgets.
Selected elements are highlighted. To select a connection, you can click it or its value.
Unlike the functions, the special start and end nodes and the corresponding connections
are not selectable. Functions and connections are only selectable if you have selected the
Change selection interaction mode in the Settings menu. To deselect a function or a
connection, select the function or connection again or select another one.
select multiple functions in the diagram if multiple selection mode is enabled. The option is
enabled by default. You can select one function after the other in the diagram and the
corresponding filters are added and applied to the widgets. When multiple selection is
enabled, the filtering of connections is disabled. Edges in the Function Flow diagram
cannot be selected and no edge filters can be set from outside the Function Flow widget.
To disable your selection, click the Settings icon > Clear Selection, or click the
Menu icon > Clear Selection, if enabled. The menu is disabled by default for the
Function Flow widget.
display connection values. If connection values are displayed, hovering over connections
shows a tooltip which contains the column name of the shown connection value together
with the corresponding value for this connection. Click the Settings icon and select a
measure from the Values shown at connections drop-down menu. The drop-down
menu is provided if you have set at least one additional connection value in the Assign
data (2/2) dialog. See Assign data sources (page 7).
display function labels and function measures. Function name and measure value are
displayed within the function. Move the mouse pointer over the function to display a tooltip
containing the function name and value. If function measures are defined but there are no
values available for a specific function, no value is shown.
select the function measure whose values are to be displayed in the function. Click the
Settings icon and select a measure from the Values shown at functions drop-down
menu. If only one measure is specified in the data assignment (page 8), no selection box
is available, and the corresponding values are displayed automatically.
If thresholds are configured (page 8), the function symbols are marked with colors that
represent the state in which the corresponding measure value is currently located.
move the entire diagram or the individual function using drag and drop. To move the
complete diagram, click on an empty space within the widget and hold down the mouse
button. Now the graph can be moved until you release the mouse button. The functions
can be moved by dragging them to a new location. If a function has been moved, the
alignment of the connection and the position of the label on the connection are
automatically adjusted. The lines are drawn straight instead of the previous curved lines. If
you want to move individual functions, you must select the Adjust layout interaction
mode in the Settings menu.
20PPM WIDGETS FOR MASHZONE NEXTGEN
resize the diagram using the mouse wheel. The diagram can be zoomed in or out related
to the mouse pointer position.
enable the magnifier. Click the Settings icon and select Enable magnifier. The
magnifier is enabled by default. The magnifier enlarges the diagram elements on mouse
over.
display the relevance slider. Click the Settings icon and select Show slider. The
relevance slider is enabled by default. If you deactivate the Show slider option, the slider
is hidden and only the plus and minus buttons are displayed. The slider is also hidden if
there is not enough space in the widget. The relevance slider is disabled in a Function flow
diagram that contains only a single function.
The relevance slider filters the connections in the graph based on the relevance value
assigned to the connections. See Assign data sources (page 7). The top and the
bottom values are based on the configured sorting of the relevance column. The top
value is set to 100% and the bottom value only shows the connections with the
smallest value, depending on the sorting.
Move the mouse pointer over the plus and minus button or over the slider to display a
tooltip with information about the filtered connection values.
The relevance slider is not supported if the widget is used as global, that is, used on
more than one tab.
If selected objects disappear when you use the slider, the selection is retained and an
info icon is displayed indicating that selected objects are hidden. This does not apply
to single functions in the diagram. Single functions are always displayed.
reset the layout. Click the Settings icon and select Reset layout. A layout reset does
not affect the selection of objects (single or multi selection), independent of whether they
are visible or hidden.
reset the zoom factor. Click the Settings icon and select Reset zoom.
select the type of interaction of the function symbols when they are selected. Click the
Settings icon and select the interaction type in the Node interaction drop-down menu.
The default is Change selection.
Note that the diagram layout has changed with version 10.4. If a widget from an older version
is opened, the layout is retained if possible. A new layout is generated if new nodes are added
to the data, or if you reset the layout manually.
By default, the diagram layout is recreated when new nodes or connections are added to the
data (for example, by changing filters), or when the layout is reset manually. If no nodes are
moved in Edit mode, the layout is always reset when the dashboard is opened. After that, the
nodes remain in place as long as the dashboard is open. If nodes were moved in Edit mode,
the diagram layout is saved and the changed layout is restored, if possible, when the
dashboard is opened again.
21PPM WIDGETS FOR MASHZONE NEXTGEN
5.7 How to display function data
The Function Flow widget allows you to display function data on nodes in the PPM Function
Flow diagram (page 5).
The procedure is not required for PPM context-based dashboards.
Several conditions must be fulfilled.
The function data and the connection data are available in separate data tables provided
by the relevant data sources.
A column contains the function names. The data feed can supply several function measure
values including start and end node information. However, only one value other than the
start or end node information can be displayed in the graph.
The data sources are connected by the Concatenate operator.
The data source columns must be assigned correctly to the Function Flow widget
elements (page 7). An incorrect assignment (for example, the function measure value is
used for the relevance or vice versa), can result in no graph or no function measure
values. It is not validated whether the columns have been assigned consistently.
To replace a displayed function measure value, select a different column in the assign data
dialog for the function measure value.
Detailed information on how to configure data feeds and how to assign data can be found in
the MashZone NextGen online help.
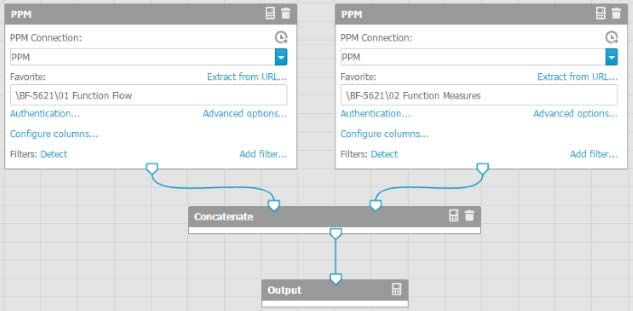
Example data feed for displaying function data
The example shows a working data feed configuration. The connection data is retrieved by the
left PPM data source operator and the function data is retrieved by the right one. Both data
sources are connected by the Concatenate operator.
22PPM WIDGETS FOR MASHZONE NEXTGEN
Example feed table with concatenated tables
The result of the data feed definition is shown in the next figure.
23PPM WIDGETS FOR MASHZONE NEXTGEN
6 Jump to PPM client widget
The Jump to PPM client widget is a custom widget provided for MashZone NextGen. The
widget displays a customizable text which can be used to jump to PPM. An optional favorite
can be configured to jump directly to this favorite when switching to PPM.
6.1 Insert text
You can insert any text into the Jump to PPM client widget.
Procedure
1. Double-click the widget.
2. Enter your text.
3. Click outside the widget to close the input field.
The text is displayed in the widget.
6.2 Specify the widget settings
You can specify the widget display settings in the widget properties dialog.
Procedure
1. Click the inserted Jump to PPM client widget. The relevant properties dialog is displayed.
2. Specify your settings. See the display options list below.
Your settings are applied.
Display Options
General Options Description
Name Optional component name.
More options Displays additional options.
Container Hide header: Hides the header as well as the title of the component,
and resizes the content of the container. Click the icon again to display
the header. The header is hidden by default.
Hide border: Hides the outline of the component container. Click the
icon again to display the outline. The border is visible by default.
Container style Selects the style type of the container. The container styles available
in the drop-down menu are part of the style template selected for the
current dashboard. The Default widget style is preselected.
Style Selects the style type of the component. The component styles
available in the drop-down menu are part of the style template
selected for the current dashboard. The Default widget style is
preselected.
24PPM WIDGETS FOR MASHZONE NEXTGEN
Specific Jump to Description
PPM widget
options
PPM Connections Alias of the PPM Connection, which contains the PPM client connection
data defined in MashZone NextGen.
Favorite Path of a PPM favorite. The favorite path represents the favorites tree
including favorites folder and name, for example, \Favorites\Process
cycle time.
Extract from URL Automatically determines the connection data of the PPM data source,
for example, alias, favorite path, and favorite type, click Extract from
URL and insert the favorite URL created in PPM.
Favorite type Favorite type specifies the favorite as Private or Shared.
6.3 SAML Authentication
If a user starts PPM using the Jump to PPM client widget, he is automatically authenticated
against the PPM system via single sign-on (SSO), provided SSO is configured correctly for PPM
and MashZone NextGen. The current logon language of the user is used for PPM if it is
available in PPM. Otherwise, the default language of PPM is used.
Detailed information on how to configure a SSO integration for MashZone NextGen and PPM
can be found in the MashZone NextGen online help and the technical documentation PPM
Installation.
If the PPM client has not yet started, the PPM download client is downloaded and you can then
start the PPM client. For more details, see the technical documentation PPM Installation.
25PPM WIDGETS FOR MASHZONE NEXTGEN
7 Process Variants widget
The Process Variants widget enables the PPM process variants feature in MashZone NextGen.
The widget adapts the process variants feature to MashZone NextGen and makes the Process
Variants widget available in the widget bar.
The Process Variants widget is available from PPM version 10.1.0.2.
For general use of MashZone NextGen dashboards and widgets, see the MashZone NextGen
online help.
7.1 What is the Process Variants widget?
From version 10.1, PPM provides the process variants feature. The process variants feature
helps you to obtain an overview of the most typical process variants, to identify irregular
processes, and to analyze them (for example, to detect critical outliers).
For details on how to use the variants feature in PPM, see the PPM Process Analysis Quick
Start Guide.
The Process Variants widget adapts the PPM process variants feature to the requirements
and use cases of MashZone NextGen.
The Process Variants widget provides a bar chart that shows the configured measure of
the variants. In addition to the graphical representation, the measure values are displayed
in the bars.
On the left side of the bar chart, the values of the column assigned to the Variant
dimension field are displayed. In most cases, these are the names of the variants.
On the right side, optional measure values are displayed. A column with the values to be
displayed can be specified as required. See Assign data sources (page 29) for details.
When you move your mouse pointer over a bar, a tooltip displays all information for this
variant.
AXIS SCALING
You can select the axis scaling in the widget properties dialog.
Linear axis scaling - The X-axis values are scaled linearly from 0 to the highest value
(bar completely filled).
Logarithmic axis scaling - The X-axis values are scaled logarithmically.
VARIANT NAMES
The names of the variants depend on the variant dimension level selected. Variant has two
dimension levels, Combined variant (rough step width) and Precise variant (refined step
width).
The variant v0(n/a) contains all process instances that are not assigned to a variant.
Examples
Combined variant with rough step width: v1, v2, v3,...
26PPM WIDGETS FOR MASHZONE NEXTGEN
Precise variant with refined step width: v1-1, v1-2, v1-3,.... ,v2-1, v2-2, v2-3... ,v3-1, v3-2,
v3-3,....
PAGINATION AND NAVIGATION
Depending on the number of variants and space available for the chart widget, the variants are
displayed on multiple pages. The current page and the total number of pages are shown at the
center of the page, for example, 1 / 5 pages. You can use the links to
browse the pages. With the links > you can navigate to the first or the last page,
respectively. With the links < and > you can navigate one page backward or forward,
respectively. If you click a link, the variants of the new page are loaded immediately without
resetting the selections of the previous page.
When MashZone NextGen refreshes the data of the widget, the pages are updated
automatically.
Example of the Process Variants widget in MashZone NextGen
7.2 Specify the widget settings
You can specify the widget display settings in the widget properties dialog.
Procedure
1. Click the Process Variants widget on the dashboard. The relevant properties dialog is
displayed.
2. Specify your settings. See the display options list below.
27PPM WIDGETS FOR MASHZONE NEXTGEN
Your settings are applied.
Display options
General options Description
Name Optional widget name.
Container Show/Hide header: Shows/Hides the
header as well as the title of the widget, and
resizes the content of the container. Click the
icon again to hide/show the header.
Show/Hide border: Shows/Hides the outline
of the widget container. Click the icon again
to hide/show the outline.
Container style Selects the style type of the container. The
container styles available in the drop-down
menu are part of the style template selected
for the current dashboard. By default, the
Default widget style is preselected.
Style Selects the style type of the widget. The
widget styles available in the drop-down
menu are part of the style template selected
for the current dashboard. By default, the
Default widget style is preselected.
Show menu Enables the widget menu in view mode. In
view mode, you can display the widget menu
by clicking the Menu icon in the widget
header. In the widget menu, you can, for
example, clear a selection, refresh the data
displayed, or save the component widget in a
CSV file.
Specific Process Variants widget options Description
Scaling Scaling type of the primary measure values.
Select the type of scaling, Linear or
Logarithmic. The bars are scaled depending
on the selected scaling type.
Widget version Displays the currently installed widget
version.
28PPM WIDGETS FOR MASHZONE NEXTGEN
7.3 Assign data sources to the Variant widget
Before you can display content in the variants widget, you must first assign a data source to
this widget. You can select PPM as data source or any desired data source available in
MashZone NextGen.
Procedure
1. Click the Process Variants widget on the dashboard. The relevant properties dialog is
displayed.
2. Click Assign data to edit the data source assignment. The Assign data (1/2) dialog
is displayed.
Here you can select a data source and specify your data source settings.
3. Click Next.
4. The Assign data (2/2) dialog will be displayed.
Here you can assign the data source columns to the individual widget elements. See
Settings (page 30) for details.
5. Assign the data columns of the PPM context to the widget elements using drag and drop.
6. Click an assigned column to specify the column settings. See Settings (page 30) for
details.
7. Click OK to save your settings.
The widget shows a bar chart based on the data of the assigned data source.
7.3.1 Assign data columns of a PPM context
If you have configured a Process Mining context (page 38) for your dashboard, you need only
assign the data columns provided by the Process Mining context to the elements of the
dashboard widgets (Assign data (2/2) dialog). You do not have to assign a data source to
each widget first (Assign data (1/2) dialog). The Process Mining context is automatically
assigned to all widgets in the dashboard that have no data source assigned.
By default, the PPM context provides all data columns of the PPM system. For the Process
Variants widget, the columns are automatically filtered, and the PPM context provides only
the variant dimension and numeric columns available.
Procedure
1. Click the Process Variants widget on the dashboard. The relevant properties dialog is
displayed.
2. Click Assign data to edit the data source assignment. The Assign data (2/2) dialog
is displayed.
Here you can assign the data source columns to the individual widget elements. See
Settings (page 30) for details.
3. Assign the data columns of the PPM context to the widget elements using drag and drop.
29PPM WIDGETS FOR MASHZONE NEXTGEN
4. Click the assigned columns to specify the columns settings. See Settings (page 30) for
details.
5. Click OK to save your settings.
The widget shows the variants as a bar chart based on the data of the assigned data source.
If you do not want to use context-based data columns, you can assign any other data source
provided. You can change the data source by clicking Use other data. The Assign data
(1/2) dialog opens. Here you can assign any data source provided. If you assign another data
source, you cannot reassign the PPM context to the dashboard widget. For details, see chapter
Assign data sources (page 29).
If required, you can adjust the list of data columns provided for the data columns assignment.
Click Edit PPM context to edit the data columns specified in the PPM context.
For details on using and configuring a Process Mining context, see the MashZone NextGen
online help.
7.3.1.1 Column matching
To facilitate the assignment of the source columns to the widget elements, the names of the
source columns are automatically matched to the default names of the columns in the
standard customizing (in English and German only). The matching is only done if there are no
columns already assigned to some widget elements.
The following elements of the Process Variants widget are matched (the comparison is case
insensitive):
Variant dimension
Is exactly "Variant"
Contains "Variant"
Primary measure
Is only matched if there is only a single column with numeric type.
If there is no matching source column for a widget element, the widget element stays
unassigned, and you must manually assign the column to be used.
7.3.2 Settings
The Process Variants widget requires one column for the Variant dimension and one for
the Primary measure element. Additionally, you can assign a data source column to the
optional Additional measure element.
You can specify the Display name for the Variant dimension element. For the Primary
measure and Additional measure elements, you can specify the Display name and the
Format. If you enable the Round numerically option, the values are rounded according to
the specified format, otherwise the digits are truncated. A column used as Primary measure
cannot be used as Additional measure and vice versa.
If you use the PPM context for a Process Variants widget, you can rename the Display
name of the Primary measure and Additional measure widget elements.
30PPM WIDGETS FOR MASHZONE NEXTGEN
Option list
Field Description
Variant dimension Contains the column with the names of the variants, for example,
v1, v2, or v1-3. The names are displayed as labels of the bars.
Mandatory.
Allows only text columns.
If the field is empty, no chart is displayed.
Primary measure The values are used to compute the length of the bars and the
sorting order of the variants. The data is always sorted in
descending order. The order cannot be changed.
Mandatory.
Allows only numeric columns.
If the field is empty, no chart is displayed.
Additional measure Contains additional measure values assigned to the various
variants. The values are displayed on the right side of the chart
besides the bars.
Optional.
Allows only numeric columns.
Advanced options
Field Description
Display name New column name displayed in the widget, that is used for
measure, data point, or tool tip, for example.
By default, the data source column name is used.
Aggregation Specifies how the measure value is calculated. Available for
numeric columns. The preset aggregation type depends on the
configuration in PPM.
The number of aggregation types provided by context-based
widgets may differ from non-context-based widgets.
Format Output format of the column values, that is used for data points or
tool tip, for example. Available for columns of date and numeric
type.
Round Numerically Displays rounded measure values in the chart. Available for
numeric columns. Enabled by default.
31PPM WIDGETS FOR MASHZONE NEXTGEN
7.4 Set selections and filters
The Process Variants widget supports the filter and selection functionalities of MashZone
NextGen dashboards. You can set filters and selections to define relations and interactions
between several dashboard widgets.
The Process Variants widget can be used to set a selection or a filter in other dashboard
widgets. Additionally, the entire widget can be filtered by other widgets.
You can select a single variant or multiple variants at once. Click the variants you want to
select. Or click a bar in the chart and drag the mouse pointer to the last variant bar that you
want to select. A rectangle displayed marks your multiple selection. You can also use the
rectangle to deselect variant bars.
The interactions between widgets are handled using coordinates that contain the current
selection. These coordinates are then updated by the widget on every selection change and
can be used to filter other widgets. The Process Variants widget currently only exposes one
coordinate with the name VariantList. This VariantList coordinate delivers all variants which
are currently selected in the Process Variants widget (in a special PPM syntax because
MashZone NextGen currently does not support multiple selection.).
Please note the following advice:
The filtering of other widgets is currently limited to data sources that can interpret the
special PPM syntax. Therefore, only an input parameter in the feed or dashboard can be
used which directly forwards the filter to PPM.
Currently, you can only use Process Variants widgets to set the selection of other
Process Variants widgets, because only Process Variants widgets can interpret the
required PPM syntax.
The Process Variants widget can be filtered by other widgets without restriction. These
filters are only result filters and are not forwarded to PPM unless they are configured as
input parameters for the PPM operator.
The selection of the Process Variants widgets can be set by other widgets using the
VariantList coordinate. Multiple selection is currently supported only by Process
Variants widgets.
General information on how to use filters and selections can be found in the MashZone
NextGen online help.
32You can also read