Effect of the Dynamic Cone Angle on the Atomization Performance of a Piezoceramic Vibrating Mesh Atomizer
←
→
Page content transcription
If your browser does not render page correctly, please read the page content below
applied
           sciences
Article
Effect of the Dynamic Cone Angle on the Atomization
Performance of a Piezoceramic Vibrating
Mesh Atomizer
Qiufeng Yan 1 , Chuanyu Wu 2 and Jianhui Zhang 1,3, *
 1    State Key Laboratory of Mechanics and Control of Mechanical Structures, Nanjing University of Aeronautics
      and Astronautics, Nanjing 210016, China; yanqf@nuaa.edu.cn
 2    Faculty of Mechanical Engineering& Automation, Zhejiang Sci-Tech University, Hangzhou 310018, China;
      cywu@zstu.edu.cn
 3    College of Mechanical and Electrical Engineering, Guangzhou University, Guangzhou 510006, China
 *    Correspondence: zhangjh@nuaa.edu.cn

 Received: 23 March 2019; Accepted: 30 April 2019; Published: 3 May 2019

 Abstract: In this paper, we find that the dynamic cone angle of a piezoceramic atomizer is linked
 to periodic changes in the volume of the micro-cone hole of the atomizer, and such changes affect
 atomization performance. Firstly, we explained the theory of the dynamic cone angle inside the
 vibrating mesh atomizer. Then, we analyzed the flow status of liquid in the micro-cone hole, and the
 one-way flow Rof the liquid is caused by the difference of diffuser and nozzle flow resistance.
 The volume change of the micro-cone hole and the liquid chamber can produce atomization.
 Furthermore, we developed the experiment to measure the atomization rate, atomization height,
 and the diameter of the atomized particles. The experiments reveal that the atomization rate and
 height are much larger when the vibrating mesh atomizer is working in the forward path than in the
 reverse one. The atomization rate and atomization height increase as the working voltage increases.
 Meanwhile, with increasing driving voltage to the piezoceramic actuator, the atomization particle
 size decrease and the atomized particle size distribution is more concentrated. Finally, the size of
 the micro-cone hole was measured using a microscope with different direct current (DC) voltages,
 further demonstrating the existence of the dynamic cone angle.

 Keywords: dynamic cone angle; phenomenon of dynamic cone angle; atomization rate; atomization
 height; atomization particle size

1. Introduction
     The past century has been characterized by rapid advances in materials development, especially in
functional materials, such as piezoceramic materials. Nowadays, on one hand, piezoceramic materials
have found a wide spectrum of commercial applications [1,2], such as ultrasonic measurement [3–5],
vibration sensing and control [6–8], force sensing [9,10], pumping and dosing [11–13], ultrasonic cleaner,
ultrasonic welding, energy harvesting [14,15] and imaging [16], among others. On the other hand,
piezoceramic materials and devices are still being actively researched to achieve better performance
with lower cost and less environmental impact [17–19].
     One of the actively researched piezoceramic devices is the atomizer, which utilizes a piezoceramic
actuator to convert liquid to atomized particles through high frequency ultrasonic vibration; it can cause
ultrafine droplet atomization. Ultrafine droplet atomization is widely applied in combustion with liquid
fuel [20], inhalation therapy [21–23], printed circuits [24], three-dimensional (3D) prototyping [25],
precise surface coating [26,27], spray drying [28], spray cooling [29,30], and inkjet printing [31],

Appl. Sci. 2019, 9, 1836; doi:10.3390/app9091836                                   www.mdpi.com/journal/applsci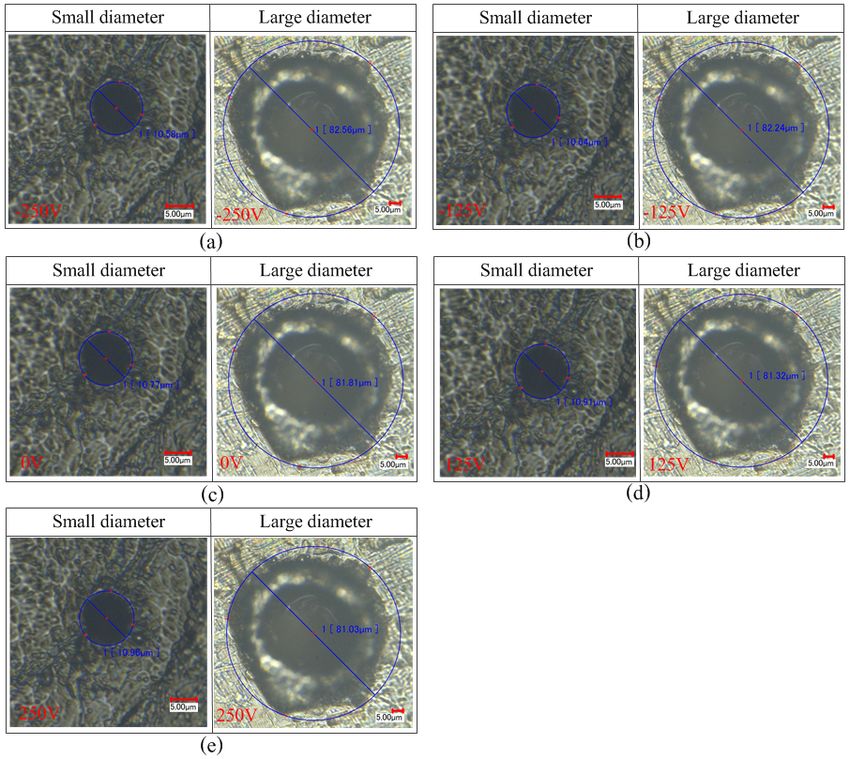
Appl. Sci. 2019, 9, 1836                                                                            2 of 17

among other fields. Ultrafine droplet atomization has high important application potential, and scholars
began to focus on atomization devices.
      Kuttruff first provided a detailed explanation of the actuating principle of a surface acoustic wave
atomizer [32]. Berggrend et al. designed an extrusion-type piezoceramic ultrasonic atomizer that
produced droplets with an average diameter of 27 µm [33]. The working mechanism of this type of
atomizer is to release energy to the entire liquid system to break the surface tension of the liquid and
allow the droplets to escape from the surface for atomization and ejection. The atomization is formed
at the surface of the liquid. However, the energy is applied to the entire liquid system.
      Heij et al. proposed a stationary vibrating mesh atomizer driven by piezoelectricity to improve
energy use, minimize the droplet size range and strengthen control over the atomization process [34].
To further minimize the droplet size range, Pan et al. designed a new type of stationary micro-cone
hole driven by piezoelectricity [35]. In this type of atomizer, the pressure inside the liquid chamber is
modulated by the vibration of a piezoelectric vibrator, and the liquid is ejected from the micro-jet hole
when the pressure inside the liquid chamber is sufficiently large, resulting in atomization. In designing
this type of atomizer, it is necessary to add an atomizer chamber with variable volume. The structure
of this type of atomizer is complex, which limits the miniaturization of the atomizer.
      In this research, the micro-cone hole is machined within the plate metals of the vibrating mesh
atomizer. There is no liquid chamber with variable volume in the process of atomization, the structure
of the atomizer is simplified, and the atomization process can be controlled. Maehara et al. proposed the
atomizer with this structure [36,37]. Lu et al. designed an efficient cooling device that used a vibrating
mesh atomizer [38,39]. This type of atomizer can effectively improve energy use and minimize the
droplet size range. It also has the advantages of portability and straightforward integration, resulting
in a revolutionary influence on combustion with liquid fuel [40,41].
      We previously determined that the micro-cone hole of the vibrating micro-porous atomizer has an
important influence on the atomization effect, particularly the dynamic change of the cone angle of the
atomizer under the working conditions. Therefore, this study was designed to verify the dynamic
change of the micro-cone angle and its effect on the atomization effect of the vibrating mesh atomizer.

2. Structure of the Atomizer and Dynamic Cone Angle

2.1. Structure of the Atomizer
     Figure 1a shows a schematic of a vibrating mesh atomizer structure. Because the micro-cone hole
is machined in the middle of the disperser, piezoelectric (PZT) need to be machined into a circular ring.
The PZT ring is bonded tightly to the disperser, and then the inverse piezoelectric effect of the PZT is
used to drive the disperser which results in atomization and ejection. Lu reviewed the operation of this
type of atomizer: the liquid is pinched off as droplets pass through the cone nozzle during forward
vibration and then adheres to the orifice by capillary force during backward vibration, as shown in
Figure 1b,c. At this point, the micro-cone hole is in the nozzle mode, and the liquid flows from the
flared (the larger diameter of the micro-cone hole) side to the tapered side (the smaller diameter of the
micro-cone hole). According to Lu’s explanation, it was noted that if the atomization test is repeated
when the atomizer shown in Figure 1a is reversed by 180◦ , with the flared side (originally immersed
in the liquid) exposed to the air, and the tapered side (originally exposed to the air) immersed in the
liquid, then the same atomization rate will be obtained. At this point, the micro-cone hole is in the
diffuser mode, and it should obtain the same atomization rate as it did in nozzle mode when the liquid
flows from the tapered side (the smaller diameter of the micro-cone hole) to the flared (the larger
diameter of the micro-cone hole) side.
Appl. Sci. 2019, 9, x FOR PEER REVIEW 3 of 18
Appl. Sci. 2019, 9, 1836 3 of 17
Appl. Sci. 2019, 9, x FOR PEER REVIEW 3 of 18
Figure 1. Illustration of the micro-cone hole atomizer structure and its principles, as provided by Lu.
(a) Schematic
Figure of theof atomizer
1. Illustration structure;
the micro-cone (b) liquid
hole atomizer flow generated
structure in the as
and its principles, upward-vibrating
provided by Lu.
Figure 1. Illustration
micro-tapered of(c)
aperture; theliquid
micro-cone
flow hole atomizer
generated in thestructure and its principles,
downward-vibrating as provided
micro-cone hole. by Lu.
(a) Schematic of the atomizer structure; (b) liquid flow generated in the upward-vibrating micro-tapered
(a) Schematic of the atomizer structure; (b) liquid flow generated in the upward-vibrating
aperture; (c) liquid flow generated in the downward-vibrating micro-cone hole.
micro-tapered aperture; (c) liquid flow generated in the downward-vibrating micro-cone hole.
2.2. Structure of the Ultrasonic Atomizer and Micro-Cone Hole
2.2. Figure
Structure 2a ofshows the structure
the Ultrasonic and and
Atomizer parameters
Micro-Cone of atomizer.
Hole The grey
The grey part
part in
in Figure
Figure 33 isis the
the PZT,
PZT,
and the yellow part is the disperser. The thickness of the PZT is 0.63 mm; the external and internal
diametersFigureof 2a
theshows the structure and parameters of respectively. atomizer. TheThe grey part in Figure 3 is the PZT,
PZT rings are 15.96 mm and 7.69 mm, respectively. thickness of the dispenser is
and
50 µm, the
μm, and yellow
andthe part
thediameter is the
diameterofofthe disperser.
thedispenser The
dispenserisis thickness
15.96
15.96mm.mm. of the
The
The PZT
large
large is 0.63
diameter
diameter mm;
andand the external
thethe
small and internal
diameter
small diameter of the
of
diameters
cone hole are
the cone of the
hole81.81 PZT
are µm rings
81.81andμm are
10.77 15.96
andµm, mm and
respectively.
10.77 7.69 mm, respectively.
There are about
μm, respectively. There 400 The thickness
aremicro-cone
about 400 holes of the dispenser
processed
micro-cone onis
holes
50 middle
the μm, andbulge the diameter of the dispenser is 15.96 mm. TheThere large arediameter and the small diameter of
processed on the of an atomizing
middle bulge offilm via laser
an atomizing technology.
film via laser some errors
technology. There inarelaser
some processing,
errors in
sothe
in cone
this hole
study, are
it has81.81
been μm and
simplified 10.77
to a μm, respectively.
micro-cone hole. There are about 400 micro-cone holes
laser processing, so in this study, it has been simplified to a micro-cone hole.
processed
Figure on the respectively
2b,c middle bulgeshow of an atomizing film viaand laser technology. There
the are some errors in
2b,c respectively show thethefrontfront
viewview and back back view of viewthe of atomizing atomizing
film. Duringfilm.
laser
During processing,
atomization, so in this
thein study,
surface it has been simplified to a micro-cone hole.
atomization, the surface Figurein2cFigure
comes2c comes
into contactintowith
contact with the
the liquid liquid while
chamber, chamber, while the
the surface in
surface Figure
in Figure2b,c respectively show the front view and back view of the atomizing film. During
Figure 2b comes 2b intocomes
contact intowith
contact with the environment.
the external external environment. Figure 2d shows the image of a
atomization,
Figure 2dthe
micro-tapered surface
aperture
shows the in
taken Figure
imagewithof 2c
an comes into contact
environmental
a micro-tapered withtaken
scanning
aperture the liquid
electron chamber,
withmicroscope, while the scanning
in which
an environmental surface
the redin
Figure
circle
electron 2b
marks comes
microscope, into contact
the liquidinoutlet whichand with
thethethe external
redgreen
circlecircleenvironment.
marks marks the liquid
the liquid outlet inlet.
andItthe cangreen
be observed that this
circle marks the
is Figure
a typical 2d shows the image of a micro-tapered aperture taken with an environmental scanning
liquid inlet.micron-sized
It can be observed taperedthat flow tube
this is athat consists
typical of three micro-tapered
micron-sized tapered flow apertures connected
tube that consists of
inelectron
series. microscope, in which the red circle marks the liquid outlet and the green circle marks the
three micro-tapered apertures connected in series.
liquid inlet. It can be observed that this is a typical micron-sized tapered flow tube that consists of
three micro-tapered apertures connected in series.
Figure 2.
Figure Atomizing film:
2. Atomizing film: (a)
(a) schematic
schematic diagram
diagram ofof the
the atomizing
atomizing film
film structure;
structure; (b)
(b) front
front view
view of
of the
the
atomizing film; (c) back view of the atomizing film; (d) image of the micro-cone hole aperture
atomizing film; (c) back view of the atomizing film; (d) image of the micro-cone hole aperture taken taken by
the environmental
Figure 2. Atomizing scanning
film: electron
(a) microscope.
schematic diagram of the atomizing film structure; (b) front view of the
by the environmental scanning electron microscope.
atomizing film; (c) back view of the atomizing film; (d) image of the micro-cone hole aperture taken
2.3. The Dynamic Changes of the Micro Apertures
by the environmental scanning electron microscope.
Figure
2.3. The 3 shows
Dynamic the illustrative
Changes of the Microdiagram of the dynamic cone angle. We have analyzed the theory
Apertures
of the dynamic cone angle [42,43].
2.3. Figure
This
3 shows
The Dynamic the illustrative
Changes
cycle continues of
asthe Micro
long
diagram of the dynamic cone angle. We have analyzed the
as Apertures
the PZT ring continues to deliver the required stimulation.
theory of the dynamic cone angle [42,43].
A dynamic cone
Figure tube with
3 shows the diffuser and nozzle
illustrative is formed
diagram of the by the micro-cone
dynamic hole We
cone angle. inside the piezoelectric
have analyzed the
theory of the dynamic cone angle [42,43].
Appl. Sci. 2019, 9, x; doi: FOR PEER REVIEW www.mdpi.com/journal/applsci
Appl. Sci. 2019, 9, x; doi: FOR PEER REVIEW www.mdpi.com/journal/applsci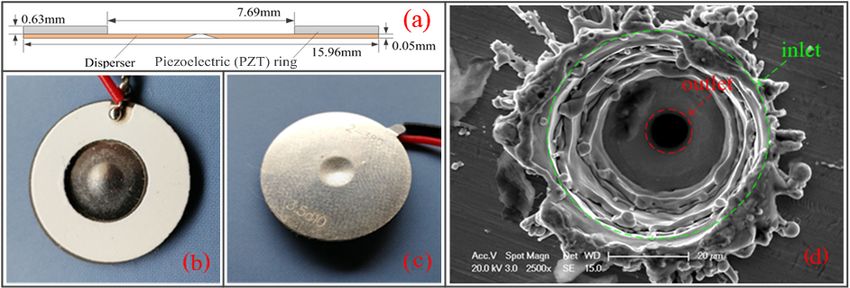
Appl. Sci. 2019, 9, x FOR PEER REVIEW 4 of 18
Appl. Sci. 2019, 9, 1836 4 of 17
This cycle continues as long as the PZT ring continues to deliver the required stimulation. A
dynamic cone tube with diffuser and nozzle is formed by the micro-cone hole inside the
vibrator during
piezoelectric vibration.
vibrator In this
during study, the
vibration. dynamic
In this study,change of the cone
the dynamic angle
change of the
of the conical
cone angletube is
of the
called the dynamic cone angle.
conical tube is called the dynamic cone angle.
Figure 3. Illustrative diagram of the dynamic cone angle.
Figure 3. Illustrative diagram of the dynamic cone angle.
3. Theoretical Analysis
3. Theoretical
3.1. Analysis of Analysis
the Flow of Liquids
Under the excitation of alternating current AC signal, PZT will produce vibration, which will
3.1. Analysis
drive of the Flow
the disperser of Liquids
vibration. The effects of gravity on the fluid are assumed to be negligible. In this
case, Under
the pressure in the aperture varies with
the excitation of alternating volume.
current AC When
signal,the PZTmetal
willsheet is compressed,
produce vibration, the volume
which will
of the micro-cone hole decreases and the liquid pressure increases in turn; however,
drive the disperser vibration. The effects of gravity on the fluid are assumed to be negligible. In this when the metal
sheet
case, is stretched,
the pressurethe involume of the micro-cone
the aperture varies withhole increases
volume. Whenand the
the liquid
metal pressure
sheet is decreases
compressed, in turn.
the
volumeThe of
fluid
theinmicro-cone
the micro-conehole hole has two
decreases external
and environments:
the liquid one is thein
pressure increases liquid
turn;chamber,
however, and the
when
other is thesheet
the metal atmosphere. During
is stretched, theatomization,
volume of the the micro-cone
small side ofhole the increases
micro-cone andhole
theis liquid
in contact with
pressure
the atmosphere,
decreases in turn. and the other side is in contact with the liquid. When the volume on the upper side
decreases, the cone
The fluid in theangle increases,
micro-cone holeand
hasthe
twopressure
external in the upper side
environments: oneofisthe
themicro-cone hole also
liquid chamber, and
increases. Liquid flows from regions of high pressure to the regions of low
the other is the atmosphere. During atomization, the small side of the micro-cone hole is in contact pressure. One branch of
fluid flows into the space below the neutral layer and fills the space where the
with the atmosphere, and the other side is in contact with the liquid. When the volume on the upper volume in the micro-cone
hole
side becomes
decreases, larger, and the
the cone other
angle part of and
increases, the fluid extrudes in
the pressure into
thethe outerside
upper spaceof with lower pressure.
the micro-cone hole
The low pressure at the lower side causes the liquid to flow into that
also increases. Liquid flows from regions of high pressure to the regions of low pressure. side, into a region where
Oneliquid
branch is
accumulated
of fluid flowsfrom intoflows from the
the space upper
below the side and layer
neutral from theandliquid chamber.
fills the When the
space where the volume
volume on in the
the
upper side increases, the cone angle decreases. The direction of the liquid
micro-cone hole becomes larger, and the other part of the fluid extrudes into the outer space with flow will be opposite.
lower pressure. The low pressure at the lower side causes the liquid to flow into that side, into a
3.2. Analysis of the Flow Resistance
region where liquid is accumulated from flows from the upper side and from the liquid chamber.
When The
thevague phrases
volume “one
on the branch”
upper side and “the other
increases, branch”
the cone aredecreases.
angle used above because
The the fundamental
direction of the liquid
flow
flow constraints include not only the pressure generated by the volume changes of the aperture but
will be opposite.
also the inertial force and the capillary force. A slight volume change in the liquid chamber beneath
3.2. dispenser
the Analysis ofalso
the Flow Resistance
causes both atomization and ejection directly. In the tapered aperture, the flow
resistance in the diffuser element is different from the flow resistance in the nozzle element.
The vague phrases “one branch” and “the other branch” are used above because the
In a single cycle, the micro-cone hole acts as a nozzle/diffuser element. The difference between
fundamental flow constraints include not only the pressure generated by the volume changes of the
the two flow resistances determines the flow rates of “one branch” and “the other branch” described
aperture but also the inertial force and the capillary force. A slight volume change in the liquid
above and allows one-way flows from the flared (the larger diameter of the micro-cone hole) side to
chamber beneath the dispenser also causes both atomization and ejection directly. In the tapered
the tapered side (the smaller diameter of the micro-cone hole).
aperture, the flow resistance in the diffuser element is different from the flow resistance in the nozzle
The atomizer uses AC voltage. Therefore, the angle of the micro-cone hole changes constantly.
element.
The flow resistance of the diffuser and nozzle also changes constantly. At a certain moment, ξ(t)Dd is
In a single cycle, the micro-cone hole acts as a nozzle/diffuser element. The difference between
the diffuser element loss coefficient, and ξ(t)Dn is the nozzle element loss coefficient.
the two flow resistances determines the flow rates of “one branch” and “the other branch” described
Therefore, in one cycle, the average of the diffuser element loss coefficient is:
above and allows one-way flows from the flared (the larger diameter of the micro-cone hole) side to
the tapered side (the smaller diameter of the micro-cone hole).
Appl. Sci. 2019, 9, x; doi: FOR PEER REVIEW www.mdpi.com/journal/applsci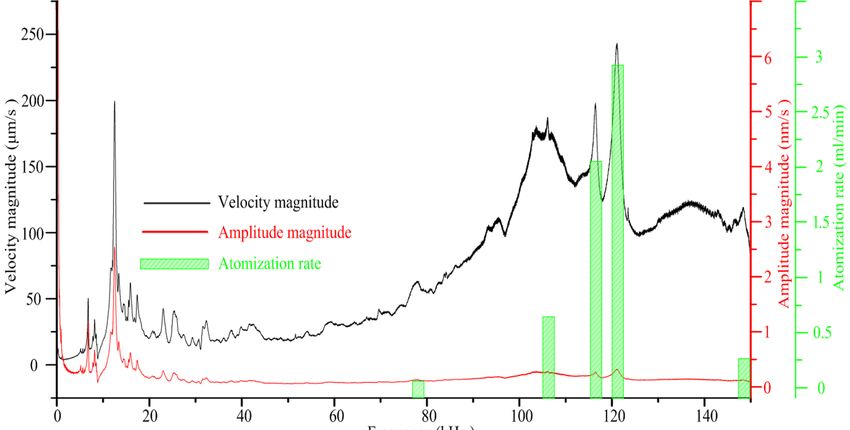
Appl. Sci. 2019, 9, x FOR PEER REVIEW 5 of 18
Appl. The atomizer
Sci. 2019, 9, 1836 uses AC voltage. Therefore, the angle of the micro-cone hole changes constantly.5 of 17
The flow resistance of the diffuser and nozzle also changes constantly. At a certain moment, ξ(t)Dd is
the diffuser element loss coefficient, and ξ(t)Dn is the nozzle element loss coefficient.
Therefore, in one cycle, the averageZofTthe diffuser element k loss coefficient is:
1 1X
ξDd = 1 T ξ(t)Dd dt = 1 k ξ(t)Dd ∆ti (1)
ξ Dd =T 0 ξ (t ) Dd dt = T i=ξ0 (t ) Dd Δti (1)
T 0 T i =0
where T is the length of one cycle.
where T is the length
Similarly, of oneofcycle.
the average the nozzle element loss coefficient is:
Similarly, the average of the nozzle element loss coefficient is:
k
1 T
Z
1 kX
ξDnξ = = 1 T ξξ((tt )) Dndt
dt ==1 ξ (ξt )(t)Dn ∆ti
Dn T 00 T
(2)
Dn Dn Δti (2)
T T i =i0=0
where T is
is the
the length
length of
of one
one cycle.
cycle.
Figure 44 shows
Figure shows the empirical
empirical curves
curves of the cone angle, the diffuser loss coefficient ξξSd Sd,, and
and the
the
nozzle loss
nozzle losscoefficient
coefficient [44].
ξSnξSn TheThe
[44]. flowflow
resistance is alsoisa also
resistance function of the cone
a function of angle on a macroscopic
the cone angle on a
level (only cone ◦ are discussed here). The flow resistance is higher in the
macroscopic levelangles
(only of more
cone than of
angles 40more than 40° are discussed here). The flow resistance is
diffuserin
higher element than in element
the diffuser the nozzle element
than when
in the the cone
nozzle elementanglewhen
is morethethan
coneapproximately
angle is more 30◦than
[44].
The flow resistance
approximately increases
30° [44]. as the
The flow angle increases.
resistance increases as the angle increases.
Figure 4. Empirical curves of the cone angle, the diffuser loss coefficient ξSd , and the nozzle loss
Figure 4. Empirical curves of the cone angle, the diffuser loss coefficient ξSd, and the nozzle loss
coefficient ξSn . (d, L, L1 is defined in figure 4 in references [44].)
coefficient ξSn. (d, L, L1 is defined in figure 4 in references [44].)
Olsson [45] compared the results obtained from the numerical calculation for conical flows and
thoseOlsson [45] compared
mentioned in reference the results
[46] and foundobtained thatfrom
the flow the numerical
resistances calculation for conicalelements
in the nozzle/diffuser flows andat
those mentioned in reference [46] and found that the flow resistances
the micro-scale are similar to those at the macro-scale. Therefore, in this study, the flow resistances in in the nozzle/diffuser elements
at
thethe micro-scale are
nozzle/diffuser similarat
elements tothe
those at the macro-scale.
micro-cone hole can use Therefore,
the empirical in this study,inthe
curves flow4.resistances
Figure From this
in the nozzle/diffuser elements at the micro-cone hole
figure, the diffuser/nozzle loss factors are as follows: ξSn = 0.49, ξSd = 0.62. can use the empirical curves in Figure 4. From
this figure, the diffuser/nozzle loss factors are as follows: ξSn = 0.49, ξSd = 0.62.
3.3. Atomization Rate
3.3. Atomization Rate
In a previous study [42], it was found that when the piezoelectric vibrator moves from the
In a previous
equilibrium position study
to the[42], it was
extreme found the
position, thatvolume
when the of the piezoelectric
liquid chamber vibrator moves
changes from the
is follows:
equilibrium position to the extreme position, the volume of the liquid chamber changes is follows:
Z R
r2 πw0 R2
∆VVS = 2π R w0 (1 −r 2 2 )rdr π=w0 R 2 (3)
VVS = 2π 0 w0 (1 − 2R)rdr = 2 (3)
0 R 2
where ΔV
where ∆VVSisisthe
thevolume
volumeofofthetheliquid
liquidchamberchamberchanges. changes.
VS
The volume of the cone apertures changes is follows [42]:
The volume of the cone apertures changes is follows [42]:
y
∆VVD 2 2 2 2 −1 −1
ΔVVD 2zz(( ffyyyy ++ ffxxxx++f y fyf xxfxx− 2−f2x ffxy ffyxyfxy+ f+x ffyyx )fmyy )m]dV ]dV
= = [[2
ΩΩ
(4)
(4)
where ∆VVD is the volume of the cone apertures changes.
Appl. Sci. 2019, 9, x; doi: FOR PEER REVIEW www.mdpi.com/journal/applsci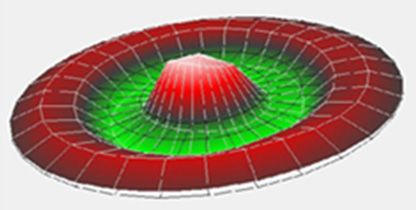
Appl. Sci. 2019, 9, 1836                                                                             6 of 17

     Zhang et al. provided an equation for the net volume flow rate when the cone hole is in a steady
state [44]:
                                                   ξNd − ξNn
                                     qV ≈ ∆V f                                                     (5)
                                                2 + ξNd + ξNn
where ∆V is the volume variation of the liquid chamber, f is the vibrational frequency, ξNd is the
diffuser element loss coefficient, and ξNn is the nozzle element loss coefficient.
     Therefore, the flow rate caused by the change of the volume of the liquid cavity is:

                                                          ξDd − ξDn
                                          qVS ≈ ∆VS f                                                   (6)
                                                        2 + ξDd + ξDn

where ∆VS is the volume variation caused by the piezoelectric vibrator.
    Similarly, the flow rate caused by the change of the volume of the micro-cone hole is:

                                                          ξDd − ξDn
                                         qVD ≈ ∆VD f                                                    (7)
                                                        2 + ξDd + ξDn

where ∆VD is the volume variation caused by the micro-cone hole.
    With the tapered side exposed to the air and the flared side immersed in the liquid, the overall
volume flow of the dispenser is:

                                q                   = qvs + qvd
                                                ξDd −ξDn             ξ −ξ
                                     =   ∆VS f            + ∆VD f Dd Dn                                 (8)
                                               2+ξDd +ξDn         2+ξDd +ξDn
                                                                ξ −ξ
                                          = (∆VS + ∆VD ) f Dd Dn
                                                              2+ξDd +ξDn

     When the atomizer shown in Figure 1a is reversed by 180◦ , the flared side is exposed to the air,
and the tapered side immersed in the liquid. The pumping effect of the micro-cone hole and liquid
chamber can also cause atomization. However, in such a case, the flow resistance is higher in the
diffuser element than in the nozzle element, and the atomization rate is much less than that it is in
normal conditions.
     Due to the difference of the diffuser flow resistance and the nozzle flow resistance, and the volume
changes in the micro-tapered aperture and the liquid chamber, a pumping effect is produced, and the
one-way flow of the liquid is caused by the pumping effect.

3.4. The Droplet Formation Process
      Figure 5 shows the modeling of the droplet formation process in one cycle. It can be seen from
the figure that when the pressure in the micro-cone hole is positive, the liquid in the cone hole flows
outward to form a liquid column; when the pressure in the cone hole is negative, the liquid droplets
will continue to flow outward for a period of time due to inertia; with the continuous negative pressure
in the micro-cone hole, the liquid column begins to flow back into the hole, then the liquid begins to
move along the inner wall of the cone hole to the hole, and the liquid part in the hole. Gradually fined
and then fractured to form atomized droplets. It can be found from the figure that the outflow liquid
flows outward at the center faster than the liquid near the outlet, so when the liquid at the outlet begins
to move into the hole, the outermost liquid still keeps flowing outward, which makes the droplet
appear as thinning neck near the outlet, thus creating conditions for liquid fracture.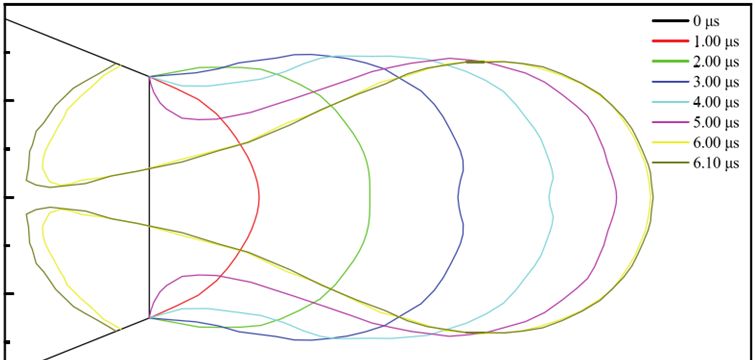
Appl. Sci. 2019, 9, x FOR PEER REVIEW 7 of 18
Appl. Sci. 2019, 9, 1836 7 of 17
Appl. Sci. 2019, 9, x FOR PEER REVIEW 7 of 18
Figure 5. The modeling of the droplet formation process in one cycle.
Figure 5. The modeling of the droplet formation process in one cycle.
Figure 5. The modeling of the droplet formation process in one cycle.
4. Design of
4. Design of Experiments
Experiments
In
In the
4. Design experiment,
theof Experiments
experiment, we
weplan
planto
tomeasure
measureatomization
atomizationrate,
rate,atomization
atomization height and
height thethe
and particle size
particle of
size
the atomized
of the particles.
atomized Atomization
particles. rate is rate
Atomization the liquid
is thequality
liquidofquality
the atomizer
of theperatomizer
minute. Atomization
per minute.
In the experiment, we plan to measure atomization rate, atomization height and the particle size
height is the maximum height of the atomized droplets by hole injection.
Atomization height is the maximum height of the atomized droplets by hole injection. The The particle sizeparticle
of the
of the atomized particles. Atomization rate is the liquid quality of the atomizer per minute.
atomized particles is the mean diameter of the atomized particles. The liquid used in
size of the atomized particles is the mean diameter of the atomized particles. The liquid used in the the experiment
Atomization height is the maximum height of the atomized droplets by hole injection. The particle
was water, which
experiment had a which
was water, temperature of 20 ◦ C and of
had a temperature a kinematic
20 °C and viscosity × 10−3 Pa·s.
of 1viscosity
a kinematic of 1 × 10⁻³ Pa·s.
size of the atomized particles is the mean diameter of the atomized particles. The liquid used in the
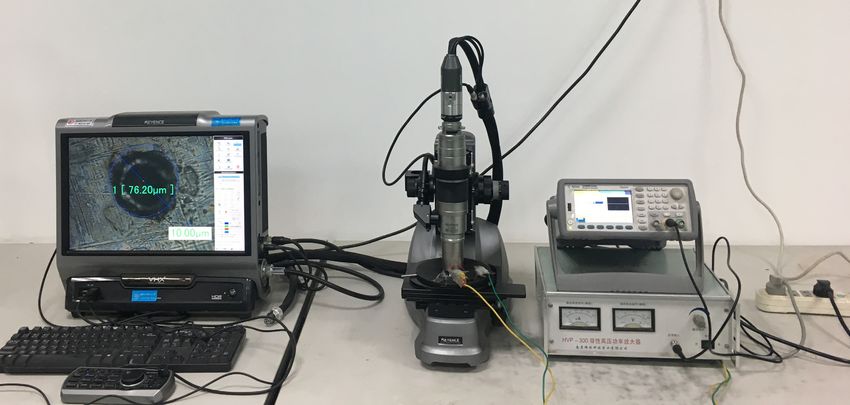
Figure
Figure 66 shows
shows thethe photograph
photograph of of measuring
measuring the the vibration
vibration modemode ofof the
the piezoelectric
piezoelectric vibrator.
vibrator.
experiment was water, which had a temperature of 20 °C and a kinematic viscosity of 1 × 10⁻³ Pa·s.
The velocity and amplitude curves of the atomized tablets were obtained
The velocity and amplitude curves of the atomized tablets were obtained using a Polytechusing a Polytech PSV-300F-B
Figure 6 shows the photograph of measuring the vibration mode of the piezoelectric vibrator.
laser vibrometer.
PSV-300F-B laserThe resonance The
vibrometer. frequency was obtained
resonance frequency from
was theobtained
curve, and the resonance
from the curve,point
and was
the
The velocity and amplitude curves of the atomized tablets were obtained using a Polytech
determined. In addition, the atomization rate was measured at each resonance
resonance point was determined. In addition, the atomization rate was measured at each resonancepoint at an operating
PSV-300F-B laser vibrometer. The resonance frequency was obtained from the curve, and the
voltage
point atof an40 V.
operating voltage of 40 V.
resonance point was determined. In addition, the atomization rate was measured at each resonance
point at an operating voltage of 40 V.
Figure 6. A photograph of measuring the vibration mode of the piezoelectric vibrator.
Figure 6. A photograph of measuring the vibration mode of the piezoelectric vibrator.
In the Figure
previous6. Aexperiment,
photograph ofwe obtained
measuring thethe optimum
vibration modeoperating frequency
of the piezoelectric of the atomizer.
vibrator.
In the previous experiment, we obtained the optimum operating frequency of the atomizer. To
To validate the effect of the micro-cone hole on atomization performance, the atomization rates and the
validate the effect of the micro-cone hole on atomization performance, the atomization rates and the
In the previous
atomization heights experiment,
are measuredweatobtained
both the the optimum
flared operating
(forward frequency
direction) of thesides
and tapered atomizer. To
(reverse
atomization heights are measured at both the flared (forward direction) and tapered sides (reverse
validate the
direction) effect
with of the micro-cone
different hole onatatomization
working voltages the optimum performance, the atomization
operating frequency. Figurerates and the
7 shows
direction) with different working voltages at the optimum operating frequency. Figure 7 shows the
atomization
measurementheights are measured
of the atomization rateatand
both
thethe flared (forward
atomization height.direction) and tapered
The atomization sides
rate can (reverse
be obtained
measurement of the atomization rate and the atomization height. The atomization rate can be
direction) with
by electronic differentand
weighing, working voltages atheight
the atomization the optimum operating
can be directly frequency.
investigated Figure
using 7 showsruler.
a straight the
obtained by electronic weighing, and the atomization height can be directly investigated using a
measurement of the atomization rate and the atomization height. The atomization rate can be
straight ruler.
obtained by electronic weighing, and the atomization height can be directly investigated using a
straight ruler.
Appl. Sci. 2019, 9, x; doi: FOR PEER REVIEW www.mdpi.com/journal/applsci
Appl. Sci. 2019, 9, x; doi: FOR PEER REVIEW www.mdpi.com/journal/applsci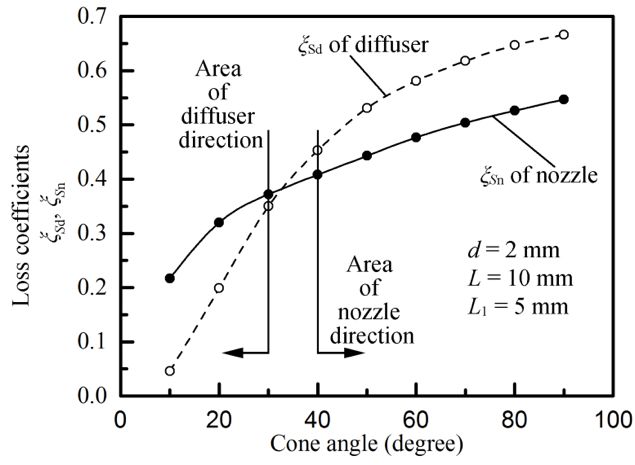
Appl. Sci. 2019, 9, 1836 8 of 17
Appl. Sci. 2019, 9, x FOR PEER REVIEW 8 of 18
Appl. Sci. 2019, 9, x FOR PEER REVIEW 8 of 18
Ruler
Ruler
Oscilloscope
Oscilloscope
Signal Generator
Signal Generator
Atomizer
Atomizer Power Amplifier
Power Amplifier
The measurement of the atomization rate and the atomization height.
Figure 7. The
Figure 7. The measurement of the atomization rate and the atomization height.
To further
To furthervalidate
validatethe effect
the of the
effect change
of the of cone
change angleangle
of cone of on atomization performance,
of on atomization the particle
performance, the
To further validate the effect of the change of cone angle of on atomization performance, the
size of the
particle atomized
size particles particles
of the atomized was measured at different
was measured at applied
differentvoltages
appliedatvoltages
the optimum
at the operating
optimum
particle size of the atomized particles was measured at different applied voltages at the optimum
frequency. Figure 8 shows
operating frequency. Figurethe measurement
8 shows of the particle
the measurement size
of the of the atomized
particle size of theparticles.
atomized particles.
operating frequency. Figure 8 shows the measurement of the particle size of the atomized particles.
Figure 8. Measurement of the particle size of the atomized particles.
Figure 8. Measurement of the particle size of the atomized particles.
Figure 8. Measurement of the particle size of the atomized particles.
The relationship among the atomization rate, the atomization height, the particle size of the
The relationship among the atomization rate, the atomization height, the particle size of the
The relationship
atomized particles andamong drivingthe atomization
voltage rate,from
is obtained the atomization
the above test. height, the particle
To establish size of the
the relationship
atomized particles and driving voltage is obtained from the above test. To establish the relationship
atomized
between the particles andand
cone angle driving voltagevoltage,
the driving is obtained fromDC
different thevoltages
above test.
wereTo establish
applied the
to the relationship
piezoceramics
between the cone angle and the driving voltage, different DC voltages were applied to the
between
actuator, andthe the
cone angleinand
changes the drivinghole
the micro-cone voltage, different using
were observed DC voltages
microscopy. were applied
Figure to the
9 shows
piezoceramics actuator, and the changes in the micro-cone hole were observed using microscopy.
piezoceramics actuator, and
method for measurement of thethehole.
changes in the micro-cone
The method for measuring holethewere
coneobserved using is
hole’s diameter microscopy.
as follows:
Figure 9 shows the method for measurement of the hole. The method for measuring the cone hole’s
Figure 9 shows
firstly, we used the method
three pointsfor to measurement
plot the diametersof the of
hole. The method
a circle forismeasuring
(the circle the cone hole’s
plotted according to the
diameter is as follows: firstly, we used three points to plot the diameters of a circle (the circle is
diameter
outermostisofas thefollows:
hole). Infirstly, we used three
the measurement, points to plot
the localization thethree
of the diameters
points of a circle
is hand (the In
chosen. circle is
order
plotted according to the outermost of the hole). In the measurement, the localization of the three
plotted
to avoidaccording
the influence to the outermostfactors
of subjective of the onhole).
the In the measurement,
measurement results, the localization
we chose of the three
three conspicuous
points is hand chosen. In order to avoid the influence of subjective factors on the measurement
points tois hand
plot the chosen.
circle.InWeorder to avoid
continued to the influence
search for theseof subjective
three points factors
after onthe the measurement
voltage changed,
results, we chose three conspicuous points to plot the circle. We continued to search for these three
results,
and used wethese
chosethree
threepoints
conspicuous points
to plot the to plot the
diameters of acircle.
circle.We continued
Then, to search
we obtain for theseof
the diameter three
the
points after the voltage changed, and used these three points to plot the diameters of a circle. Then,
points
cone holeafter the voltage
under differentchanged,
voltages.and In used these three points
the measurement, we lettotheplot the diameters
tapered side of the of dispenser
a circle. Then,
face
we obtain the diameter of the cone hole under different voltages. In the measurement, we let the
we obtain
upward the diameter
firstly, and use the of above
the cone hole to
method under
measuredifferent voltages.
the tapered sideIndiameter
the measurement, we lethole
of the micro-cone the
tapered side of the dispenser face upward firstly, and use the above method to measure the tapered
tapered
under DC side of the(the
voltage dispenser
DC voltages face upward
are −125firstly,
V, 0 V, and
125 V,use
250the above
V and 125method to measure
V, respectively), andthe tapered
record the
side diameter of the micro-cone hole under DC voltage (the DC voltages are −125 V, 0 V, 125 V, 250 V
side diameter
results of the micro-cone
of the measurements for hole under
the five DC voltage
voltages. (the DCofvoltages
The change the largeare −125 V,in0 V,
aperture the125 V, 250 V
micro-cone
and 125 V, respectively), and record the results of the measurements for the five voltages. The
and 125 be
hole can V, measured
respectively),
by theandsame record the The
method. results of theofmeasurements
thickness the dispenser can for bethemeasured
five voltages. The
by vernier
change of the large aperture in the micro-cone hole can be measured by the same method. The
change
calipers,of andthethe
large
angleaperture in the micro-cone
of the micro-cone hole can hole can be from
be obtained measured by the same
the geometric method. The
relations.
thickness of the dispenser can be measured by vernier calipers, and the angle of the micro-cone hole
thickness of the dispenser can be measured by vernier calipers, and the angle of the micro-cone hole
can be obtained from the geometric relations.
can be obtained from the geometric relations.
Appl. Sci. 2019, 9, x; doi: FOR PEER REVIEW www.mdpi.com/journal/applsci
Appl. Sci. 2019, 9, x; doi: FOR PEER REVIEW www.mdpi.com/journal/applsciAppl. Sci. 2019, 9, 1836 9 of 17
Appl. Sci. 2019, 9, x FOR PEER REVIEW 9 of 18
Figure AAphotograph
9. 9.
Figure photograph of
of how theaperture
how the apertureis is measured.
measured.
5. Results and Discussion
5. Results
Figure 10 and
shows Discussion
the frequency sweep curves of the vibration velocity and amplitude, vibration
modes of Figure
resonance 10 shows the deformation
points, frequency sweep diagram
curvesof ofthe
the piezoelectric
vibration velocity oscillator and atomization
and amplitude, vibration rates
at themodes
resonance points. points,
of resonance In thisdeformation
experiment,diagram the flared
of theend of the atomizer
piezoelectric is attached
oscillator to the water
and atomization rates tank
and isatplaced
the resonance
in contact points.
withInthethisfluid
experiment,
surfacethe flared
(i.e., in the end of the atomizer
forward direction). is attached to the water
tank
In and
this is placed in no
experiment, contact
visiblewith the fluid surface
atomization was (i.e., in the below
observed forwarda direction).
resonant frequency of 15.9 kHz.
In this experiment, no visible atomization
As shown in Figure 10, the atomization rate increased gradually withwas observed below a resonant
resonancefrequency of 15.9
frequency and at
kHz.
the resonance frequency of 121.1 kHz, the atomization rate was maximized (2.805 mL/min). However,
As shown in Figure 10, the atomization rate increased gradually with resonance frequency and
at the resonance frequency of 148.3 kHz, the atomization rate decreased significantly.
at the resonance frequency of 121.1 kHz, the atomization rate was maximized (2.805 mL/min).
When the frequency increases (where O 1 refers to the increasing frequency trend), the dispenser
However, at the resonance frequency of 148.3 kHz, the atomization rate decreased significantly.
deformation When the frequency increases (whereindicates
becomes more complex, which ① refers that
to its
therate of deformation
increasing frequency curvature
trend), the change
and the rate of tapered
dispenser deformation aperture
becomes volume more change both which
complex, increase. Furthermore,
indicates that itsthe rate
rate of ofdeformation
liquid chamber
volume changechange
curvature decreasesand the rate ofO
(where refers to
2 tapered the decreasing
aperture volume change rate ofbothliquid chamber
increase. volumethe
Furthermore, change
rateHowever,
trend). of liquid chamber volume change
the atomization rates atdecreases
the resonant(where ② refers togenerally
frequencies the decreasingincreaserateincrementally.
of liquid
chambercontradicts
This finding volume change trend). of
the findings However,
previousthe atomization
discussions ratespumping
on the at the resonant
effect causedfrequencies
by volume
changes and the atomization generated under ultrasound conditions. No clear explanationsonare
generally increase incrementally. This finding contradicts the findings of previous discussions thegiven
pumping effect caused by volume changes and the atomization generated under ultrasound
in the literature [29,38,39].
conditions. No clear explanations are given in the literature [29,38,39].
When the rate of dispenser deformation curvature change increases (referring to larger changes
When the rate of dispenser deformation curvature change increases (referring to larger changes
in theindynamic cone angle) as shown in Figure 3, the dynamic cone angle pumping effect becomes
the dynamic cone angle) as shown in Figure 3, the dynamic cone angle pumping effect becomes
stronger, and this
stronger, and results in aninincrease
this results an increasein the in atomization
the atomization rate.rate.
Therefore,
Therefore, thethevibration
vibration andandthethe
elastic
deformation
elastic deformation of the dispenser allow the micro-dynamic cone angle to act as a pump. There are two
of the dispenser allow the micro-dynamic cone angle to act as a pump. There are
possible
tworeasons
possiblefor the reduction
reasons of the atomization
for the reduction of the atomization rate atrate
theatsixth-order
the sixth-order resonance
resonance point. The
point. Thefirst is
firstoverall
that the is that the overall displacement
displacement amplitude amplitude
decreases decreases
at higher at higher resonance
resonance modes modesand and
the the
raterate of
of change
change alsoThe
also decreases. decreases.
secondThe second
reason reason
is that theisflow
that velocity
the flow in velocity in the aperture
the aperture increases increases with
with increasing
increasing
frequency, and frequency,
this leads to andthethis leads to flow
increased the increased
resistance. flowTherefore,
resistance.the Therefore,
dynamic thecone
dynamic
anglecone
plays an
angle plays an important role in the atomization.
important role in the atomization.
Figures 11 and 12 show that the atomization rate and atomization height measured in the forward
direction are much higher than those measured in the reverse direction. This atomization rate and
atomization height difference increases as the working voltage increases. As determined through the
analysis above, the atomization of the vibrating mesh atomizer is caused by pressure atomization and
dynamic cone angle atomization. The pressure atomization is caused by the change of the volume in
the liquid chamber, and the dynamic cone angle atomization is caused by the change of the volume
in the micro-cone hole. When the vibrating mesh atomizer is working in the forward configuration,
the atomization rate is the sum of the pressure atomization and the dynamic cone angle atomization,
as shown in Equation (8). Therefore, the atomization rate in the forward direction is much higher than
in the reverse direction. The initial velocity of the atomized droplets is more rapid at the exit of the
micro-cone
Appl. Sci. hole
2019, 9,when
x; doi: the atomization
FOR PEER REVIEW rate is larger. Therefore, the atomization height in the forward
www.mdpi.com/journal/applsci
direction is much higher than in the reverse direction. The experiment shows that the micro-cone hole
is integral to and influences the atomization behavior.Appl. Sci. 2019, 9, 1836 10 of 17
Appl. Sci. 2019, 9, x FOR PEER REVIEW 10 of 18
Figure 10. Frequency sweep curves of the vibration velocity and amplitude, vibration modes of
Figure 10. Frequency sweep curves of the vibration velocity and amplitude, vibration modes of
resonance points, deformation diagram of piezoelectric oscillator and atomization rates at the resonance
resonance points, deformation diagram of piezoelectric oscillator and atomization rates at the
points. (a)-(f) Vibration modes of resonance points 1–6 and the corresponding tapered aperture
resonance points. (a)-(f) Vibration modes of resonance points 1–6 and the corresponding tapered
Appl. Sci. 2019, 9, xdiagrams
deformation FOR PEER at
REVIEW
these points. 11 of 18
aperture deformation diagrams at these points.
Figure 11 and Figure 12 show that the atomization rate and atomization height measured in the
forward direction are much higher than those measured in the reverse direction. This atomization
rate and atomization height difference increases as the working voltage increases. As determined
through the analysis above, the atomization of the vibrating mesh atomizer is caused by pressure
atomization and dynamic cone angle atomization. The pressure atomization is caused by the change
of the volume in the liquid chamber, and the dynamic cone angle atomization is caused by the
change of the volume in the micro-cone hole. When the vibrating mesh atomizer is working in the
forward configuration, the atomization rate is the sum of the pressure atomization and the dynamic
cone angle atomization, as shown in Equation (8). Therefore, the atomization rate in the forward
direction is much higher than in the reverse direction. The initial velocity of the atomized droplets is
more rapid at the exit of the micro-cone hole when the atomization rate is larger. Therefore, the
atomization height in the forward direction is much higher than in the reverse direction. The
experiment shows that the micro-cone hole is integral to and influences the atomization behavior.
Figure11.
Figure 11.Variation
Variationin
in the
the atomization
atomization rates
rateswith
withworking
workingvoltage.
voltage.
Figures 11 and 12 show that at the same resonance frequency, with increasing driving voltage,
the atomization rate and the atomization height gradually increase. When the driving frequency is
unchanged, the vibration mode of the piezoelectric vibrator is also unchanged. With increasing driving
voltage of the piezoelectric vibrator, the deformation of the piezoelectric vibrator amplitude is greater.
Xu et al. proposed that the flow is driven by the actual displacement of the piezoelectric in a piezoelectric
nozzle [47], and the liquid obtained more energy when the voltage increased. With increasing driving
voltage of the piezoelectric vibrator, the deformation of the piezoelectric vibrator amplitude is greater,
and the angle and change of the volume of the micro-cone hole increases. The difference of the average
flow resistance in the forward and reverse directions increases with an increase in the angle of the
Appl. Sci. 2019, 9, x; doi: FOR PEER REVIEW www.mdpi.com/journal/applsciAppl. Sci. 2019, 9, 1836 11 of 17
micro-cone hole. With the increase of the displacement of the piezoelectric vibrator, the increase of
volume of the micro-cone hole and the increase of the difference of the average flow resistance in the
forward and reverse directions, the atomization
Figure 11. Variation rate andrates
in the atomization atomization height
with working also increase.
voltage.
Appl. Sci. 2019, 9, x FOR PEER REVIEW 11 of 18
Figure12.
Figure 12.Variation
Variationin
inthe
the atomization
atomization heights
heights with
withworking
workingvoltage.
voltage.
Figure 11. Variation in the atomization rates with working voltage.
Figures 13 and 14 show that at the same resonance frequency, with increasing driving voltage,
the atomization particle size decreases, the atomized particle size distribution is more concentrated,
and droplet size range gradually decreases. When the driving frequency is unchanged, the vibration
mode of the piezoelectric vibrator is also unchanged. With increasing driving voltage of the piezoelectric
vibrator, the deformation of the piezoelectric vibrator amplitude is greater, and the angle and change
of the volume of the micro-cone hole increases. As shown in Figure 3, the diameter of the tapered
side with the micro-cone hole is smaller when the piezoelectric vibrator is in the lowest position.
By analyzing the theory of the phenomenon of dynamic cone angle [42,43], the atomized droplets
are found to eject from the micro-cone hole into (a)the
10 Vair when the piezoelectric vibrator reaches the
lowest position. The diameter of the atomized particles is reduced by reducing the diameter of the
tapered side with the micro-cone hole in this position. Simultaneously, the maximum diameter of
the atomized droplets is reduced by reducing the diameter of the tapered side with the micro-cone
hole. The speed of droplets leaving the micro-cone hole increases with the increase of voltage.
The distance between the two separated droplets increases with the increase of speed. At this point,
the probability of collision decreases, and the atomized particle size distribution is more concentrated.
The experiment to characterize the atomization parameters at different driving voltages proves the
presence of the dynamic cone angle, and the experiment establishes that the dynamic cone angle affects
theAppl. Sci. 2019, 9, x;
atomization doi: FOR PEER
performance.
Figure REVIEW in the atomization heights with workingwww.mdpi.com/journal/applsci
12. Variation voltage.
(a) 10 V
Figure 13. Cont.Appl. Sci. 2019, 9, 1836 12 of 17
Appl. Sci. 2019, 9, x FOR PEER REVIEW 12 of 18
(b) 20 V
(c) 30 V
(d) 40 V
(e) 50 V
(f) 60 V
Figure 13. Cont.
Appl. Sci. 2019, 9, x; doi: FOR PEER REVIEW www.mdpi.com/journal/applsciAppl. Sci. 2019, 9, 1836 13 of 17
Appl. Sci. 2019, 9, x FOR PEER REVIEW 13 of 18
(g) 70 V
(h) 80V
Appl. Sci. 2019, 9, x FOR PEER REVIEW 14 of 18
Figure
Figure13.
13.Cumulative
Cumulative particle sizesizedistribution
distribution and
and analysis
analysis results
results of atomized
of atomized particles
particles under
under different
different
workingworking
voltages.voltages. (X10
(X10 is the is the percentage
percentage of cumulativeof cumulative
distributiondistribution
reaches 10%,reaches 10%, the
the corresponding
increases with the increase of speed. At this point, the probability of collision decreases, and the
corresponding
particle size isparticle size
obtained, is isobtained,
X50 median size,X50 X90
is median size, X90 is
is the percentage of the percentage
cumulative of cumulative
distribution reaches
atomized particle size distribution is more concentrated. The experiment to characterize the
10%, the corresponding
distribution particle
reaches 10%, the size is obtained,
corresponding S/V
particle is the
size surface area
is obtained, S/V specific volume
is the surface of atomized
area specific
atomization parameters at different driving voltages proves the presence of the dynamic cone angle,
droplets,
volume SMD is the
of atomized averageSMD
droplets, diameter
is theofaverage
sotail). diameter of sotail).
and the experiment establishes that the dynamic cone angle affects the atomization performance.
Figure 11 and Figure 12 show that at the same resonance frequency, with increasing driving
voltage, the atomization rate and the atomization height gradually increase. When the driving
frequency is unchanged, the vibration mode of the piezoelectric vibrator is also unchanged. With
Diameter of particle (μm)
increasing driving voltage of the piezoelectric vibrator, the deformation of the piezoelectric vibrator
amplitude is greater. Xu et al. proposed that the flow is driven by the actual displacement of the
piezoelectric in a piezoelectric nozzle [47], and the liquid obtained more energy when the voltage
increased. With increasing driving voltage of the piezoelectric vibrator, the deformation of the
piezoelectric vibrator amplitude is greater, and the angle and change of the volume of the
micro-cone hole increases. The difference of the average flow resistance in the forward and reverse
directions increases with an increase in the angle of the micro-cone hole. With the increase of the
displacement of the piezoelectric vibrator, the increase of volume of the micro-cone hole and the
increase of the difference of the average flow resistance in the forward and reverse directions, the
atomization rate and atomization height also increase.
Figure 13Figure
and Figure 14 show
14. Variation in thethat at theofsame
diameter resonance
the atomized frequency,
particles with increasing
with working voltage. driving
Figure 14. Variation
voltage, the atomization in the
particle sizediameter of thethe
decreases, atomized particles
atomized with working
particle voltage. is more
size distribution
concentrated,
Figure 15and showsdroplet size ofrange
the results gradually
measurement decreases.
of the parameters Whenof thethe driving hole
micro-cone frequency is
at different
Figure 15 shows the results of measurement of the parameters of the micro-cone hole at
unchanged,
voltages alongthe with
vibration modeofofthethe
schematics piezoelectric
change. vibrator
Figure 15a–e is the
shows alsoresults
unchanged. With
of five time increasing
measurements
different voltages along with schematics of the change. Figure 15a–e shows the results of five time
driving voltage
at different of the Figure
voltages. piezoelectric
15 shows vibrator,
that thethe deformation
micro-cone of the piezoelectric
hole changes vibrator
constantly under amplitude
diverse voltages.
measurements at different voltages. Figure 15 shows that the micro-cone hole changes constantly
is greater,
Tableand the angle
1 shows and change of
the measurement the volume
results of the micro-cone
of the micro-cone hole under holedifferent
increases. As shown
voltages. It caninbe
under diverse voltages.
Figure 3, theTable
seen from diameter
1 thatofthe
theangle
tapered side
of the with the micro-cone
micro-cone hole changed hole is smaller
under when
different the piezoelectric
working voltages.
Table 1 shows the measurement results of the micro-cone hole under different voltages. It can
vibratorTheis in the lowest
angle of the position.
micro-coneBy analyzing
hole can be theclosely
theory of the phenomenon
related to the voltage of dynamic
through cone angle
microscope
be seen from Table 1 that the angle of the micro-cone hole changed under different working
[42,43], the atomized
observation. droplets
The previous are foundshowed
experiment to ejectthat
from thethe micro-coneperformance
atomization hole into the is air whenbythe
affected the
voltages.
piezoelectric vibrator reaches the lowest position. The diameter of the atomized particles
driving voltage. Therefore, the atomization performance is closely related to the change of the angle of is reduced
The angle of the micro-cone hole can be closely related to the voltage through microscope
bythereducing
micro-cone thehole.
diameter of the tapered side with the micro-cone hole in this position.
observation. The previous experiment showed that the atomization performance is affected by the
Simultaneously, the maximum diameter of the atomized droplets is reduced by reducing the
driving voltage. Therefore, the atomization performance is closely related to the change of the angle
diameter of the tapered side with the micro-cone hole. The speed of droplets leaving the micro-cone
of the micro-cone hole.
hole increases with the increase of voltage. The distance between the two separated droplets
Table 1. Measurement results of the micro-cone hole under different voltages. (d1 is the small
Appl. Sci. 2019, 9, x; doi: FOR PEER REVIEW www.mdpi.com/journal/applsci
diameter of the cone hole, d2 is the large diameter of the cone hole, t is the thickness of the
dispenser. ).Appl. Sci. 2019, 9, 1836 14 of 17
Table 1. Measurement results of the micro-cone hole under different voltages. (d1 is the small diameter
of the cone hole, d2 is the large diameter of the cone hole, t is the thickness of the dispenser).
Measurement Result d1 (µm) U (V) d2 (µm) t (µm) Angle (◦ )
1 10.58 −250 82.56 50 71.49
2 10.64 −125 82.24 50 71.21
3 10.77 0 81.81 50 70.78
4 10.91 125 81.32 50 70.30
5 10.96 250 81.03 50 70.04
It is also important to note that in this experiment, the voltage applied is DC voltage, and in the
actual work process, the voltage applied to the nebulizer will be AC voltage. The frequency of the
applied alternating current is consistent with the resonant frequency of piezoelectric, thus producing
resonance and augmenting the vibration of the piezoelectric vibrator. Thus, the actual deformation
of the dispenser is much more complicated than that in the present experiment, and these resulting
changes in the
Appl. Sci. 2019, 9, xangle willREVIEW
FOR PEER also be larger than those in the experiment. 15 of 18
Figure 15. Measurement results of the micro-cone hole under different voltages. (a) −250 V; (b) −125 V;
Figure 15. Measurement results of the micro-cone hole under different voltages. (a) −250 V; (b) −125
(c) 0 V; (d) 125 V; (e) 250 V.
V; (c) 0 V; (d) 125 V; (e) 250 V.
6. Conclusions
Liquid fuel can be atomized by piezoceramic atomizers, which will ensure that the combustion
is more complete and thorough to reduce the pollution. Our research team studied the micro-cone
hole atomizer. The main conclusions are summarized as follows:
The phenomenon of dynamic cone angle is analyzed in this study. Under micro-scaleYou can also read