4G/5G Network Experience Evaluation Guideline - GSMA
←
→
Page content transcription
If your browser does not render page correctly, please read the page content below
4G/5G Network Experience Evaluation Guideline
Table of Contents
Executive Summary ...........................................................................................................3
1.     Introduction .................................................................................................................4
1.1.        Abbreviations ............................................................................................................5
2.     Typical Services and Experience Requirements .....................................................7
     2.1.      Video Playback ................................................................................................................ 7
     2.1.1.       Key Factors to Video Experience ................................................................................. 7
     2.1.2.       Video Experience Requirements on Networks ............................................................. 8
     2.1.3.       Video Experience Requirements on RF Performance ................................................ 11
2.2.        VR Video .................................................................................................................16
     2.2.1.       Key Factors to VR Video Experience ......................................................................... 16
     2.2.2.       VR Video Experience Requirements on Networks ..................................................... 17
     2.2.3.       VR Video Experience Requirements on RF Performance .......................................... 18
2.3.        Mobile Gaming ........................................................................................................19
     2.3.1.       Main Factors Affecting Mobile Game Experience ...................................................... 19
     2.3.2.       Requirements of Mobile Gaming Experience on Networks ........................................ 20
     2.3.3.       Mobile Game Experience Requirements on RF Performance .................................... 21
2.4.        VoLTE Call ..............................................................................................................23
     2.4.1.       Key Factors to VoLTE Experience ............................................................................. 23
     2.4.2.       VoLTE Experience Requirements on RF Performance .............................................. 25
3.     Typical Methods for Service Experience Evaluation .............................................29
3.1.        Using MRs to Measure User Experience Distribution .............................................29
3.2.        VoLTE Experience Evaluation Method ....................................................................31
4.     Summary ...................................................................................................................32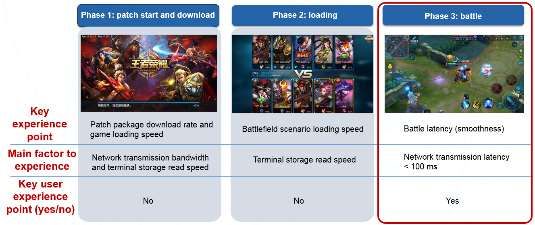
Executive Summary
This document describes main mobile broadband (MBB) services in the 5G era, such as video,
virtual reality (VR), and mobile gaming, and analyses their experience requirements. Through
simulation and testing, this document provides mapping from service experience to air-interface
indicators such as the LTE reference signal received power (RSRP), signal to interference plus
noise ratio (SINR), and traffic load. The purpose of this document is to guide mobile operators
through network deployment and optimisation based on service experience.

Additionally, this document elaborates on methods for evaluating service experiences, such as
traffic counters and measurement report (MR) grids. These methods can intuitively indicate
experience indicators for operators to proactively identify exceptions and perform network
optimisation accordingly.

                                                                                                  3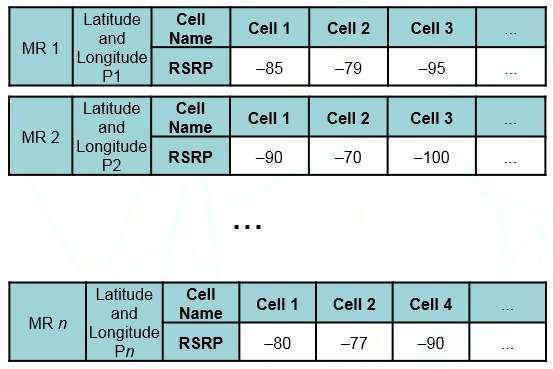
1. Introduction
The 4G era witnessed the quick popularisation of MBB Internet and smart terminals, as well as the
rapid development of MBB applications such as mobile video streaming, mobile gaming, and
mobile payments. In the 5G era, immersive mobile experiences provided by VR and augmented
reality (AR) technologies have become a new direction for development, while traditional
applications (typically mobile gaming and video) will require higher definition and lower latency.
Given the fact that LTE will continue to be the main bearer network for MBB services in the 5G era,
the user experience will change across the services that impose higher requirements on LTE
networks.

User experience directly affects user loyalty and operator revenues. It is generally acknowledged
that experience is crucial in guiding network planning and optimisation. However, service
experience of video, gaming, and VR cannot be directly perceived on the network side, and is
often reflected only in complaints from users or over-the-top (OTT) content providers. It is difficult
for operators to perform network planning and optimisation based on Service Level Agreement
(SLA) requirements.

This document describes typical services in the 5G era and the main factors that affect service
experience, by associating service experience first with network requirements (such as throughput
and latency) and finally with air interface indicators which are useful for network planning and
optimisation (such as LTE RSRP, SINR, and load).

This document also presents quantitative and visualised methods for evaluating service
experience. These methods provide information about network experience satisfaction and
geographical location exceptions, thereby effectively guiding network optimisation.

                                                                                                     4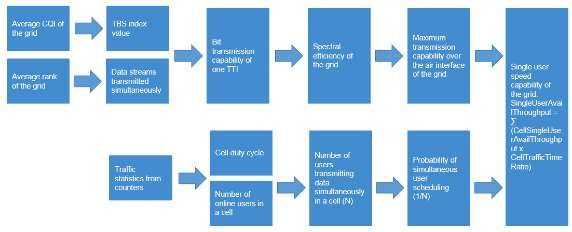
1.1.    Abbreviations
Term        Description
ACT         Action
AMR-NB      Adaptive Multi-Rate Narrowband
AMR-WB      Adaptive Multi-Rate Wideband
AR          Augmented Reality
AVG         Adventure Game
CDN         Content Distribution Network
CQI         Channel Quality Indicator
CSFB        Circuit-Switched Fall-back
DASH        Dynamic Adaptive Streaming over HTTP
dB          Decibel
DNS         Domain Name Server
EIRP        Equivalent Isotropically Radiated Power
eNB         Evolved Node B
E-RAB       E-UTRAN Radio Access Bearer
EVS         Enhanced Voice Services
FOV         Field of View
FPS         First Person Shooter
FTG         Fighting Game
GPS         Global Positioning System
HMD         Head Mounted Display
IMS         IP Multimedia Subsystem
ITU-T       International Telecommunication Union-Telecommunication Standardization Sector
KPI         Key Performance Indicator
KQI         Key Quality Indicator
LTE         Long-Term Evolution
MBB         Mobile Broadband
MOS         Mean Opinion Score
MR          Measurement Report
MTP         Motion to Photons
MUG         Music Game
OTT         Over the Top
PDCP        Packet Data Convergence Protocol
PESQ        Perceptual Evaluation of Speech Quality
POLQA       Perceptual Objective Listening Quality Analysis
PPD         Pixel Per Degree
PRB         Physical Resource Block
PUZ         Puzzle Game

                                                                                             5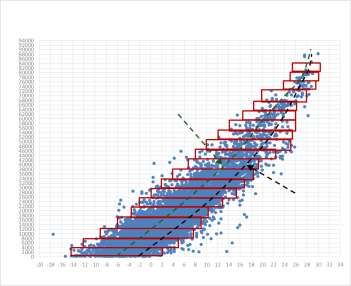
Term    Description
QCI     QoS Class Identifier
QoS     Quality of Service
RAC     Racing Game
RAN     Radio Access Network
RF      Radio Frequency
RLC     Radio Link Control
RoHC    Robust Header Compression
RPG     Role-Playing Game
RRC     Radio Resource Control
RS      Reference Signal
RSRP    Reference Signal Received Power
RTS     Real-Time Strategy Game
RTT     Round-Trip Time
SD      Standard Definition
SINR    Signal to Interference plus Noise Ratio
SLA     Service Level Agreement
SLG     Simulated Life Game
SPG     Sports Game
STG     Shooting Game
TCP     Transmission Control Protocol
TDD     Time Division Duplex
TTI     Transmission Time Interval
UDP     User Datagram Protocol
VoLTE   Voice over Long Term Evolution
VR      Virtual Reality
YOY     Year on Year

                                                  6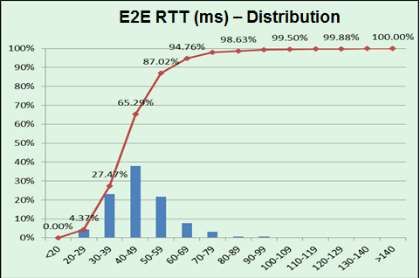
2. Typical Services and Experience Requirements
   2.1.        Video Playback
Video has become a primary source of mobile network traffic, and video experience is a key
indicator for network quality of service (QoS). Video services place higher requirements on
networks as video resolution increases (from 360p/720p to 1080p/2K), therefore experience
assurance is particularly important for operators.

       2.1.1. Key Factors to Video Experience
A complete video service includes buffering, download, and playback. User experience can also be
affected by video quality (definition), initial buffering delay, and frame freezing (smoothness).

Video quality: the quality of video is determined by resolution and bit rate. The higher the
resolution and bit rate, the clearer the image. Generally, video quality is more affected by an OTT
content provider’s video sources and user behaviour than by the mobile network. A higher video
resolution or bit-rate requires a higher download rate (bandwidth).

The following table lists the typical average bit rates of YouTube mobile videos.

      Video         Image         Resolution    Typical Bit Rate          Video Encoding
      Source        Quality                     (Mbit/s)                  (Profile and Level)
                                                H264         VP9
      YouTube       360p          640 x 360     0.35         0.3          H.264 Main
                    480p          854 x 480     0.66         0.55         H.264 Main
                    720p          1280 x 720    1.3          1.1          H.264 Main
                    1080p         1920 x        2.5          2            H.264 High
                                  1080
                    2K            2560 x        6            6            H.264 High
                                  1440
                    4K            3840 x        15.5         15.5         H.264 High
                                  2160

Initial buffering delay: The time a user has to wait before a video is played, namely the initial play
delay. It includes the time it takes to access the video service (through DNS enquiry, TCP link
setup, and directory download) and for the initial buffering and download.

According to a research report by UMass, some users abandon a video if the initial buffering delay
exceeds two seconds, and this user percentage increases by 5.8% for every one-second increase.
Users are especially intolerant of delays for short videos.

                                                                                                   7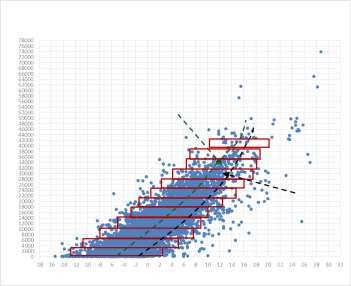
NOTE
          Short videos: < 30 minutes (e.g. a news clip); median duration: 1.8 minutes
          Long videos: ≥ 30 minutes (e.g. a movie); median duration: 43.2 minutes

Frame freezing: Frame freezing occurs during video playback and severely affects user
experience. The freezing-free ratio helps measure video experience and is calculated using the
following formula: Samples of video call data records (CDRs) without frame freezing/total samples
of video CDRs.

The standard video experience consists of an initial buffering delay of fewer than three seconds
and zero frame freezing. If the initial buffering delay is one second or less, and no frame freezing
occurs, video experience is considered excellent.

       2.1.2. Video Experience Requirements on Networks
Video service falls into two stages, namely initial buffering and playback, which vary in terms of
rate requirements.

Initial buffering phase

Initial buffering delay = Initial buffering preparation delay + Initial download delay

During the initial buffering preparation (including DNS enquiry and TCP link setup), the OTT
interaction mechanism and transmission path round-trip time (RTT) are the main factors that affect
the experience. In the initial buffering and download phase, influencing factors include initial
buffering volume thresholds, transmission path RTT, and TCP download rates (bandwidth). The
initial buffering and download phase is short (usually a few seconds or even hundreds of
milliseconds), and therefore has high requirements on RTT and short-term burst bandwidth.

                                                                                                     8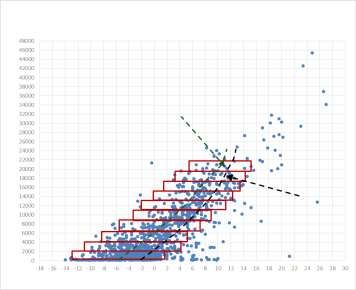
The following table maps initial buffering rate, video resolution, RTT, and initial buffering delay
of YouTube.

  Resolution       RTT (ms)     Initial Buffering Duration (s)   Required Rate (Mbit/s)
  720p             40           3                                2.13
  720p             40           2                                3.498
  720p             40           1                                10.419
  720p             50           3                                2.221
  720p             50           2                                3.782
  720p             50           1                                14.645
  720p             60           3                                2.327
  720p             60           2                                4.117
  720p             60           1                                30.246
  1080p            40           3                                4.113
  1080p            40           2                                6.818
  1080p            40           1                                21.48
  1080p            50           3                                4.308
  1080p            50           2                                7.442
  1080p            50           1                                32.763
  1080p            60           3                                4.535
  1080p            60           2                                8.192
  1080p            60           1                                62.757
  2K               40           3                                9.998
  2K               40           2                                16.83
  2K               40           1                                57.978
  2K               50           3                                10.542

                                                                                                 9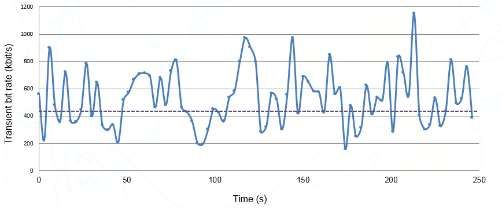
Resolution          RTT (ms)      Initial Buffering Duration (s)      Required Rate (Mbit/s)
      2K                  50            2                                   18.558
      2K                  60            3                                   11.194
      2K                  60            2                                   20.91

           NOTE
           The above table uses YouTube as the video source, H.264 video encoding, the DASH player, and a video
           buffer size of 4s.

Video playback phase

In this phase, the video bitrate is not a constant value and fluctuates around an average, as shown
in the following figure. When the video image is rich in detail and frequently switched, the transient
bit rate is high. If the download rate is lower than the video bit rate, frame freezing may occur.

According to a test (using YouTube DASH player with 1080p and 720p videos) on a commercial
network, the freezing-free ratio reached 90%, 95%, and 98% when download rates were 1.5, 1.7,
and 2.0 times the average video bit rate respectively.

      Whole-process             Samples         Samples         Samples in       Samples Without
      Perceived                 Without         with Frame      Test Period      Frame Freezing in
      Rate/Average Bit          Frame           Freezing                         Test Period (%)
      Rate                      Freezing
      < 0.9                     125             1,708           1,833            6.82
      0.9–1.0                   235             328             563              41.74
      1.0–1.1                   334             256             590              56.61
      1.1–1.2                   378             175             553              68.35
      1.2–1.3                   731             111             842              86.82
      1.3–1.4                   455             69              524              86.83
      1.4–1.5                   488             57              545              89.54
      1.5–1.6                   532             48              580              91.72
      1.6–1.7                   668             54              722              92.52
      1.7–1.8                   612             26              638              95.92
      1.8–1.9                   678             26              704              96.31

                                                                                                                  10
Whole-process Samples Samples Samples in Samples Without
Perceived Without with Frame Test Period Frame Freezing in
Rate/Average Bit Frame Freezing Test Period (%)
Rate Freezing
1.9–2.0 668 33 701 95.29
2.0–2.1 1,962 30 1,992 98.49
> 2.1 50,401 503 50,904 99.01
The following table displays the speed required to ensure a freezing-free ratio is greater than
98% (twice the bit rate) on YouTube.
Resolution Speed for a 98% Freezing-free Ratio (Mbit/s)
720p 2.6
1080p 5
2K 12
The preceding analysis reveals that the initial buffering phase is short, yet requires a high network
speed and good network coverage. The video playback phase, however, has relatively relaxed
network rate requirements but calls for a large capacity due to long duration and high probability of
simultaneous multi-user access.
2.1.3. Video Experience Requirements on RF Performance
This section describes how to associate network capabilities with air interface capabilities in
network planning.
Data throughput and target RTT selection
End-to-end (E2E) RTT and TCP data throughput are complementary, and therefore their target
values should be considered equally during network planning.
Generally, network infrastructure optimisation is required to shorten E2E RTT, which is both time-
consuming and costly. Additionally, some paths and nodes are beyond the operator’s control and
cannot be optimised. For these reasons, a short and feasible target E2E RTT is usually determined
first, in order to serve as the basis to determine a target TCP data throughput.
If the optimisation of network infrastructure or content delivery network (CDN) is not used, the
target E2E RTT is determined based on real values on live networks. Considering RTT fluctuation,
the planned E2E RTT should correspond to a 90% fulfilment ratio.
11If RTT optimisation is required during network planning, the after-optimisation target RTT is used
as the planned target RTT.
Once the RTT is determined, video experience and TCP data throughput mapping can be
achieved. Considering a TCP and IP header overhead of about 2.7% (which is negligible, and
calculated based on a 40-byte TCP/IP header and a payload of 1,460), the following equation is
true: PDCP throughput over the air interface = TCP data throughput x (100% + 2.7%).
PDCP throughput and SINR/RSRP/load mapping
Based on the target PDCP throughput achieved in the previous step, we can map it to network RF
planning parameters. Due to variations in the radio environment, equipment capability, and
software implementation, theoretically there is no accurate mapping between PDCP throughput
and RF planning target SINR, RSRP, and physical resource block (PRB) usage. In actual
engineering applications, a large number of live network test samples are analysed to approximate
a mapping model between PDCP throughput and SINR/RSRP in different networks, ground
objects, and load scenarios. Model accuracy is positively correlated to the test scenario, sample
quantity, and sample distribution. The more test scenarios, the larger the sample quantity, and the
more comprehensive the sample distribution, the more accurate the model.
Piecewise fitting is a common method used to map PDCP downlink throughput to SINR and
RSRP:
1) Differentiate scenarios (by network mode, frequency band, bandwidth, indoor/outdoor,
and PRB load). Specifically, identify cell load based on the number of PRBs allocated to
each sampling point in seconds by the driving test (DT) tool. For example, during a DT,
actual cell load is about 10% if 90 of 100 PRBs are allocated to the tested terminal, and is
about 20% if 80 of 100 PRBs are allocated to the tested terminal. Then draw a scatter
chart of PDCP downlink throughput and SINR.
2) Divide the SINR segment at a fixed step (for example, 2 dB) and, at all points in the
segment, measure the median distribution value or 90% distribution value of PDCP
12downlink throughput and SINR. The following figures are examples of the curves of
median distribution values and quantile points using a 20 MHz bandwidth cell in the
outdoor, LTE TDD (1.9 GHz) scenario.
PDCP downlink throughput (kbit/s) vs SINR
Allocated PRB ≥ 80% (i.e. cell load 0–20%)
PDCP download rate (kbit/s)
Median value/Average value curve
90% quantile
point curve
SINR (dB)
PDCP downlink throughput (kbit/s) vs SINR
Allocated PRB ≥ 60–80% (i.e. cell load 20–40%)
PDCP download rate (kbit/s)
Median value/Average value curve
90% quantile
point curve
SINR (dB)
13PDCP downlink throughput (kbit/s) vs SINR
Allocated PRB ≥ 40–60% (i.e. cell load 40–60%)
PDCP download rate (kbit/s)
Median value/Average value curve
90% quantile
point curve
SINR (dB)
3) Summarise the median value or 90% quantile point results in different scenarios and draw
mapping curves between PDCP downlink throughput and SINR.
The following figures are examples of the mapping curves between PDCP downlink
throughput and SINR using a 20 MHz bandwidth cell in the outdoor, LTE TDD (1.9 GHz)
scenario.
PDCP downlink throughput (kbit/s) vs SINR – median value PDCP downlink throughput (kbit/s) vs SINR – 90% quantile points
PDCP throughput (Mbit/s)
PDCP throughput (Mbit/s)
PRB load (0–20%) PRB load (0–20%)
PRB load (20–40%)
PRB load (20–40%)
PRB load (40–60%)
PRB load (40–60%)
PDCP throughput (Mbit/s) PDCP throughput (Mbit/s) PDCP throughput (Mbit/s)
PDCP throughput (Mbit/s) PDCP throughput (Mbit/s) PDCP throughput (Mbit/s) (10% load) (30% load) (50% load)
(10% load) (30% load) (50% load) Polynomial PDCP Polynomial PDCP Polynomial PDCP
Polynomial PDCP Polynomial PDCP Polynomial PDCP throughput (Mbit/s) (10% throughput (Mbit/s) (30% throughput (Mbit/s) (50%
throughput (Mbit/s) (10% throughput (Mbit/s) (30% throughput (Mbit/s) (50% load) load) load)
load) load) load)
In general, it is recommended that median value fitting be used as the mapping curve
between PDCP downlink throughput and SINR.
4) Draw a scatter chart of SINR and RSRP based on scenarios differentiated by network
mode, frequency band, and indoor/outdoor.
5) Divide the RSRP segment at a fixed step (for example, 0.2 dB) and, at all points in the
segment, measure the median distribution value or 90% distribution value of SINR and
RSRP.
146) Summarise the median value or 90% quantile point results in different scenarios and draw
the mapping curve between SINR and RSRP.
Median value
90% quantile points
SINR (dB)
RSRP (dBm)
In general, it is recommended that median value fitting be used as the mapping curve between
SINR and RSRP.
The following table displays the mapped relationship between user throughput and SINR/RSRP
based on the test data on China Unicom's live network.
Frequency Bandwidth Downlink Light-Load Medium-Load Heavy-Load
Band (MHz) (MHz) Rate Network Network Network
(Mbit/s)
PRB Load ≤ 20% < PRB 40% < PRB
20% Load ≤ 40% Load < 60%
SINR RSRP SINR RSRP SINR RSRP
(dB) (dBm) (dB) (dBm) (dB) (dBm)
1800 20 4.9 –4.1 –115.5 0.4 –109.4 2.6 –105.6
5 –4.1 –115.5 0.4 –109.4 2.6 –105.6
5.5 –3.5 –115 1 –108.5 3 –104.5
6.1 –3.1 –114.6 1.4 –107.9 3.6 –103.8
6.2 –3.1 –114.6 1.4 –107.9 3.6 –103.8
6.6 –2.5 –113 3 –107 4 –103
6.9 –2.2 –112.4 2.4 –106.4 4.6 –102.1
7.2 –2.2 –112.4 2.4 –106.4 4.6 –102.1
7.4 –1.5 –110.5 3 –105.5 5 –101
8 –1.1 –110 3.4 –104.9 5.6 –100.4
8.3 –1.1 –110 3.4 –104.9 5.6 –100.4
15Frequency Bandwidth Downlink Light-Load Medium-Load Heavy-Load
Band (MHz) (MHz) Rate Network Network Network
(Mbit/s)
PRB Load ≤ 20% < PRB 40% < PRB
20% Load ≤ 40% Load < 60%
SINR RSRP SINR RSRP SINR RSRP
(dB) (dBm) (dB) (dBm) (dB) (dBm)
8.6 –0.5 –109.5 4 –104 6 –99.5
9.7 1.1 –107.9 5.3 –101.7 7.5 –97
10.1 1.1 –107.9 5.3 –101.7 7.5 –97
11.8 3.1 –105 7.1 –98.5 9.4 –93.6
21.3 10.6 –92.1 14.5 –83.8 17.6 –78.6
28.8 15.5 –81.9 20 –71.4 24.2 –65.7
Based on the above analysis, 1080p requires a rate of 32.8 Mbit/s to achieve a 1s initial buffering
delay and a rate of 5 Mbit/s with a 98% freezing-free ratio at the video playback phase, assuming a
network RTT of 50ms. If the operator has three 20 MHz carriers, each carrier's required rate is
10.9 Mbit/s (32.8/3). In a lightly loaded network (PRB usage ≤ 20%), the corresponding RSRP is –
105 dBm and SINR is 3.1 dB. Network edge rate must be planned based on a –105 dBm RSRP
and a 3.1 dB SINR in order to enable instant playback of videos anytime anywhere.
2.2. VR Video
VR blocks the connection between human eyes and the real world and presents a virtual 3D
environment through computer rendering. This environment can be a replica of the real world or an
imaginary setting. People interact in real time with this 3D virtual environment.
VR has multiple applications: Video on Demand (VOD) and event on-live using 360° panoramic
video, standalone VR games, online VR games, and simulated VR environments using computer
graphics technology.
VR 360° video provides the observer an all-around physical space view field surrounded 360°
horizontally (longitude) and 180° vertically (latitude). A user can enjoy an immersive experience by
switching view angle through head position adjustment or through an input device such as a
mouse or a remote control.
Since 2016 the VR industry has grown quickly with substantial capital investment. VR is
recognized as a major service in the 5G era.
2.2.1. Key Factors to VR Video Experience
A user's view in a virtual environment can be considered as a spatial sphere with a 360° horizontal
view if expanded from left to right and a 180° vertical view if expanded from top to bottom. When a
user uses a VR terminal, the visual data actually seen by a single eye is only a part of all spherical
data, and this part's area is determined by a Field of View (FOV) provided by the terminal.
16The visual data of a single eye is only 1/8 and 2/9 of the spherical data with a 90° and 120° FOV,
respectively.
Factors that affect VR experience include image quality and interaction experience:
Image quality experience refers to the resolution of VR videos. Full view and FOV in VR are
different. The traditionally defined OTT video resolution corresponds to full-view resolution
in VR. However, where users really perceive VR image quality is single-eye resolution (also
known as FOV resolution). Take online 4K VR 360° video on YouTube for example. The
actual single-eye resolution is only 960 x 960 and only 10 pixels per degree (PPDs) in 90°
FOV, which is far lower than the 60 PPDs required by the retina in normal eyesight
conditions. The actual video experience is worse than that of SD videos watched on
traditional TVs, PCs, and tablets.
Interaction experience of VR 360° videos is mainly reflected by Motion-to-Photon (MTP)
latency. Dominant industry consensus is that immersive terminal MTP latency cannot
exceed 20 ms to avoid dizziness. That is, when a user changes a view angle for example,
by turning their head, the overall latency of processing by the terminal, network, and cloud
should ensure consistency between head movement and change of FOV image, and FOV
image update delay should not exceed 20ms.
2.2.2. VR Video Experience Requirements on Networks
VR online videos can be transmitted in two modes: Full-view and FOV transmission.
The full-view transmission solution transmits all 360° images to terminals and, when the
images need to be switched upon user head movement, all the processing is completed
locally. This solution requires larger bandwidths but can tolerate a higher latency.
In the FOV transmission solution, only high-quality images from the current viewing angle
are transmitted to terminals in order to save bandwidths. For example, a VR video is
divided into 30 viewing angles, and terminals request the corresponding FOV file from the
server based on the user's current viewing angle. In this solution, the bit rate can be
reduced to about 20% of that required by full-view mode. However, this solution requires a
lower latency, as new FOV files must be sent and switched immediately when users turn
their heads.
VR evolution goes through the following four stages which vary in network requirements:
1. Pre-VR: The representative head mounted display (HMD) terminal is Samsung Gear, and
the representative content is 4K VR 360° video on YouTube. In this stage, full-view
transmission is the mainstream solution.
172. Entry-Level VR: Terminal full-view resolution is increased to 8K so that the image quality is
close to the PPD of 480p videos viewed on a PC. The industry prefers the full-view
transmission solution to ensure good interactivity.
3. Advanced VR: Screen resolution, chip performance, human body engineering, and content
quality of HMD terminals are greatly improved. Due to improved image quality, the full-view
transmission solution requires large network bandwidth.
4. Ultimate VR: User experience is the best in this stage due to further development of HMD
terminals and content. Single-eye image quality reaches retina-level. Due to extremely high
network bandwidth requirements in the full-view transmission solution, FOV transmission
must be used but it requires a lower network latency.
Standard Pre-VR Entry-Level VR Advanced VR Ultimate VR
Video Full-view 4K 2D Full-view 8K 2D Full-view 12K 2D Full-view 24K
resolution video (YouTube) video (full-view video (full-view 3D video (full-
(full-view resolution resolution 7,680 x resolution 11,520 x view resolution
3,840 x 1,920) 3,840) 5,760) 23,040 x
11,520)
Single-eye 960 x 960 (wearing 1,920 x 1,920 3,840 x 3,840 7,680 x 7,680
resolution VR glasses, 90° (wearing VR (wearing dedicated (wearing
FOV) glasses, 90° FOV) HMD terminals, dedicated
120° FOV) HMD
terminals, 120°
FOV)
PPD 11 21 32 64
Equivalent 240p 480p 2K 4K
traditional TV
screen
resolution
Frame rate 30 30 60 120
(frame/second)
Typical video 16 Mbit/s 64 Mbit/s 279 Mbit/s 3.29 Gbit/s
bit rate
Typical network 25 Mbit/s (full-view 100 Mbit/s (full- 418 Mbit/s (full- 1 Gbit/s (FOV
bandwidth transmission which view transmission view transmission solution)
requirement is the mainstream which is the which is the
solution in this mainstream mainstream
stage) solution in this solution in this
stage) stage)
Typical network 40 30 20 10
RTT (ms)
2.2.3. VR Video Experience Requirements on RF Performance
VR video experience has similar requirements on air interface capabilities as video experience. For
details, see section "Video Experience Requirements on RF Performance." Take Pre-VR for
18example. Assuming a network RTT of 40 ms, a smooth play rate of 25 Mbit/s, and three 20 MHz
carriers, the rate of each carrier is about 8.3 Mbit/s (25/3). In a lightly loaded network (PRB usage
≤ 20%), the corresponding RSRP is –110 dBm and SINR is –1.1 dB, which must be used as the
basis when planning the network edge rate.
2.3. Mobile Gaming
Mobile games, running on mobile terminals such as phones and tablets, have developed rapidly
with the recent popularity of smartphones and mobile Internet. According to Newzoo, the global
consumption of mobile games is estimated to be US$ 68.5 billion in 2019, with a year-on-year
(YOY) growth rate of 10.2%.
Mobile games fall into the following types: Action (ACT), Adventure Game (AVG), Role-Playing
Game (RPG), First Person Shooter (FPS), Racing Game (RAC), Sports Game (SPG), Simulated
Life Game (SLG), Real-Time Strategy Game (RTS), Music Game (MUG), Fighting Game (FTG),
Puzzle (PUZ), Shooting Game (STG), and so on. FPS, RTS, and RAC games have high
requirements on network latency and low requirements on network bandwidth, and will be
discussed in detail within this document.
2.3.1. Main Factors Affecting Mobile Game Experience
A mobile game usually involves three phases:
Phase 1: Patch start and download. Download time affects user experience.
Phase 2: Loading. Load time affects user experience.
Phase 3: Battle. Response latency affects user experience.
The patch download is mostly completed over Wi-Fi, and as such user experience is not affected
by mobile network quality. In the loading phase, latency depends on terminal storage read speed
and is independent of the mobile network. The battle phase is the most crucial part where user
experience might be affected, because the game latency mainly depends on the network
transmission latency.
192.3.2. Requirements of Mobile Gaming Experience on Networks
The Worcester Polytechnic Institute conducted a study titled On Latency and Player Actions in
Online Games. The following figure illustrates the relationship between experience and latency for
FPS and RAC games.
Figure (a) depicts the relationship between latency and the scores of an FPS game. As latency
increases, the scores drop sharply at 100 ms latency.
Figure (b) depicts the relationship between latency and the time to complete a lap around a
racetrack of a RAC game. As latency increases, the time to complete a lap around a racetrack
increases sharply at 150 ms latency. (For details about this study, see
https://digitalcommons.wpi.edu/cgi/viewcontent.cgi?article=1053&context=computerscience-pubs.)
OTT game companies pay much attention to user experience and usually measure E2E latency
through heartbeat packets. The following are the RTS mobile game experience standards of an
OTT content provider:
Latency: Game latency is collected and calculated by sending user datagram protocol
(UDP) heartbeat packets every 5s.
High frame freezing round: RTT latency of all packets sent in one round of game is
sampled and calculated based on the number of sampling points that fall into the following
five ranges.
High frame freezing round is identified if the following is true: Packets sent in each range x
Weight/Total packets > 15%.
Latency Range (ms) Weight
< 100 0
100–200 0.2
200–300 0.5
300–460 0.7
> 460 1
20 Cell frame freezing ratio = Rounds with frame freezing/Total rounds
A cell with frame freezing is identified if its frame freezing ratio exceeds 7% and the
number of rounds in a week is greater than 70.
According to the preceding analysis, E2E latency must be lower than 100 ms to ensure good user
experience of mobile games.
2.3.3. Mobile Game Experience Requirements on RF Performance
Two-way latency between a base station and a game server depends on the backhaul latency,
core network processing latency, and server processing latency. Backhaul latency depends on the
distance and number of hops between the base station and game server. Processing latency
depends on the network element's processing capability. According to live network tests, the
latency between an eNodeB and a game server is generally within 30–50 ms. Therefore, the
latency on the radio access network (RAN) side must be within 50 ms to ensure smooth user
experience.
Latency over air interface can be affected by signal quality and cell load.
Signal quality
In areas with poor radio signal coverage, the block error rate (BLER) over air interface is high.
Therefore, multiple retransmissions over the physical layer are required before data is successfully
transmitted, prolonging transmission latency. The following figure shows field test results of a load-
free cell. To ensure a loopback latency from the UE to the game server of less than 100 ms, the
SINR must be greater than –7 dB and RSRP must be greater than –110 dBm.
Cell load
In heavily loaded cells, game data packages may stay in the scheduling queue for a long period of
time due to multi-user scheduling, increasing latency and deteriorating user experience. The
21following figure shows the correlation between the cell frame freezing ratio reported by mobile
game OTT and the number of users and PRB usage in this cell. The number of users in busy
hours and downlink PRB usage are in a positive linear relationship with the cell frame freezing
ratio. Cell frame freezing ratio exceeds 7% when the number of users is above 220 or when the
PRB usage is above 78%.
222.4. VoLTE Call
Compared with GSM or UMTS voice services, VoLTE voice services provide higher spectral
efficiency, clearer voice quality, and shorter call setup delay, and users can have high-speed data
services while a VoLTE call is proceeding.
2.4.1. Key Factors to VoLTE Experience
For voice over LTE (VoLTE), user experience is reflected by basic key performance indicators
(KPIs) and voice quality.
Basic KPIs indicate service availability, including the call success rate, call setup delay, and call
drop rate.
The call success rate refers to the rate that a calling party initiates calls, to the rate the calling
party hears the ringback tone. The call success rate is affected by the E2E service process
and, excluding the impact of exceptions on the core network, mainly refers to the E-UTRAN
radio access bearer (E-RAB) setup success rate with a RAN QoS class identifier (QCI) of 1
(QCI 1).
The call setup delay is the duration from the time when the calling party initiates a call to the
time the calling party hears the ring back tone. Delay is the shortest for VoLTE calls and longer
for circuit-switched fall back (CSFB) calls.
The call drop rate is the proportion of dropped calls after the calling and called parties
successfully set up calls. Main factors affecting the call drop rate are on the RAN side, such as
handover failure, weak coverage, and strong interference. RAN-side call drop rate is reflected
by the proportion of abnormal QCI1 E-RAB releases.
Voice quality indicates service quality. A higher voice bit rate ensures better voice quality.
Generally, voice quality is represented by the mean opinion score (MOS).
The following table lists the recommended baseline values of basic VoLTE KPIs. Operators can
set the baseline values based on their network development stage.
KPI Early Stage Mature Stage Ultimate Experience
Call success rate > 99% > 99.5% > 99.9%
Call setup delay < 8s < 2.5s < 1s
Call drop rate < 1% < 0.4% < 0.05%
MOS is an important indicator for voice quality of communication systems. Generally, the MOS
value is calculated by using a specific algorithm, such as perceptual objective listening quality
analysis (POLQA), to compare the source signal with the receiver signal. The MOS value ranges
from zero to five. The higher the value, the better the voice quality. Generally, user experience is
good when the MOS value is greater than or equal to four, and is acceptable when the MOS value
is greater than or equal to three.
23MOS Quality Service Loss
5 Excellent None (excellent service experience, smooth and clear)
4 Good A little (perceived service loss but user experience not affected)
3 Medium Slight
2 Poor Significant
1 Bad Extreme (services interrupted)
The average (50%) or bottom (10%) MOS value can be used to evaluate voice quality of a
network. Of the two, the bottom MOS value is recommended, given that the average MOS value is
easy to conceal problems and will not benefit network optimization.
The MOS value of enhanced voice services (EVS) is higher than that of adaptive multi-rate
wideband (AMR-WB) because of the advantages of EVS. Therefore, it is recommended that the
P10 (10%) target MOS value be set for EVS and AMR-WB separately. The suggestions are as
follows:
KQI Early Stage Mature Stage Ultimate Experience
AMR-WB 10% MOS > 2.5 > 3.0 > 3.5
EVS P10 MOS > 3.0 > 3.5 > 4.0
Voice call MOS value is affected by the codec, E2E transmission latency, jitter, and packet loss
rate.
Codec
VoLTE supports the following voice codecs: EVS, AMR-WB, and adaptive multi-rate narrowband
(AMR-NB). A higher bit rate offers better user experience.
Codec Bandwidth (KHz) Bit Rate (kbit/s)
EVS 20 5.9–128
AMR-WB 7 6.6–23.85
AMR-NB 3.4 4.75–12.2
24Driven by HD voice experience requirements, the VoLTE voice codec is changing to high bit rate
and the EVS codec. It is recommended that AMR-WB 23.85 kbit/s or EVS 24.4 kbit/s be used as
the network construction criteria.
E2E latency
The following factors affect E2E latency: UE voice coding and decoding latency, air interface
transmission latency, core network processing latency, and transport network transmission latency.
Transmission latency over the air interface fluctuates greatly, which is affected by the eNodeB
scheduling wait latency, retransmission of error packets over the air interface, and segmentation.
Packet loss and jitter
The main factors that cause packet loss and jitter are signal quality over the air interface, eNodeB
load, and packet loss or jitter on the transport network. Poor air-interface signal quality may
increase the packet error rate, which results in more packet retransmissions and segmentation. As
a result, the number of lost packets and jitters increases.
According to the preceding analysis, voice quality (namely experience) is determined by voice
codec and air interface quality.
2.4.2. VoLTE Experience Requirements on RF Performance
RF performance directly affects voice experience. VoLTE services, in particular, are symmetric in
the uplink and downlink, but the uplink coverage is likely to be a bottleneck. To solve this problem,
features such as robust header compression (ROHC), uplink radio link control (RLC) segment, and
uplink TTI bundling can be enabled on the RAN side to reduce uplink requirements and improve
the VoLTE experience of cell edge users.
VoLTE coverage is limited in the uplink and therefore the valid coverage area is determined by the
uplink coverage area. Uplink coverage requires a large enough uplink SINR so that the base
station can correctly demodulate voice contents. According to simulation results, the uplink SINR is
–6 to –3 dB when the MOS is greater than 2.5 to 3.5 for a probability of 90%.
Assuming a 20 MHz bandwidth on the 1800 MHz band, 2T2R antenna configuration of the base
station, a total power of 40 W, and the 23.85 kbit/s VoLTE codec, the theoretical RSRP required by
UEs at the uplink coverage edge is calculated as follows:
Item Formula Value No.
eNodeB reference Total power – 10 x log (12 x Total number 15.2 dBm A
signal (RS) power of RBs) (The total number of RBs is 100.)
UE equivalent 23 – 10 x log (12 x Number of RBs) (The 7.44 dBm B
isotropically radiated number of RBs is 3.)
power (EIRP)
Uplink SINR Base station performance, MOS simulation –6 to –3 dB C
value of 2.5–3.5
Difference between 33.9 x log (Downlink frequency/Uplink 0.78 D
uplink and downlink frequency) (The downlink frequency and
frequency bands uplink frequency are 1850 MHz and 1755
MHz, respectively.)
25Item Formula Value No.
Uplink interference Thermal noise + Noise coefficient + Uplink –124 to –120 E
interference margin = (–174 + 10 x log dBm
[15000]) + 2.3 + (6 – 10)
Receiver sensitivity A–B+C–D+E –123 to –116 F
dBm
Body loss - 3 dB G
UE loss - 6 dB H
RSRP F+G+H –114 to –107
dBm
The uplink interference margin is related to load. In urban areas where load is high, it is
recommended that the uplink interference margin be set to 10 dB (with the corresponding RSRP of
about –110 dBm). In rural areas where load is light, the uplink interference margin can be set to 6
dB (with the corresponding RSRP of about –116 dBm).
Bottom MOS RSRP (Light Load, < 30%) with RSRP (High Load, > 50%) with
10% Interference Margin of 6 Interference Margin of 10
2.5 –114 –110
3.0 –112 –108
3.5 –111 –107
The preceding table lists the theoretical coverage capability requirements. The following describes
MOS correlation with RSRP and SINR based on live network test results.
A large number of DTs on VoLTE 23.85 kbit/s HD voice calls were performed in a field of urban
areas on a China Unicom live network. In the DTs, RS power was 15.2 dBm, load was below 30%,
and RoHC and TTI bundling were enabled. RSRP, SINR, and MOS at each location during the
DTs or fixed-point tests were recorded, and required RSRP and SINR were calculated when the
P10 MOS value was greater than 2.5, 3.0, and 3.5 respectively.
According to the analysis, when 90% of MOS values are greater than 2.5, RSRP is about –116
dBm and SINR is greater than –4 dB; When 90% of MOS values are greater than 3.0, RSRP is
about –112 dBm and SINR is greater than –3 dB; When 90% of MOS values are greater than 3.5,
RSRP is about –107 dBm and SINR is greater than 2 dB.
26Proportion of MOS > 2.5 vs RSRP
Proportion of MOS > 2.5 vs SINR
Proportion of MOS > 3.0 vs RSRP
27Proportion of MOS > 3.0 vs SINR
Proportion of MOS > 3.5 vs RSRP
Proportion of MOS > 3.5 vs SINR
The load was light during DTs. Considering the increase in interference caused by subsequent
load increases, a 2 to 4 dB interference margin was reserved during planning. Therefore, it is
recommended that when the P10 MOS is greater than 2.5, 3.0, and 3.5, the RSRP be –112 dBm,
–108 dBm, and –103 dBm, respectively, and the SINR be greater than –4 dB, –3 dB, and 2 dB,
respectively.
According to this principle, the planned RSRP needs to be adjusted accordingly if the configuration
changes. For example, if the RS power increases, the planned RSRP must also increase. If the
base station uses 4R configuration, the planned RSRP can decrease by about 3 dB.
283. Typical Methods for Service Experience Evaluation
3.1. Using MRs to Measure User Experience Distribution
MRs from UEs contain information such as CQI, rank, RSRP (of the serving cell and neighbouring
cells), and Global Positioning System (GPS). Based on the CQI and rank, the data volume
transmitted in each TTI at a location can be calculated. Based on mapping among the GPS and
geographic grids (50 m x 50 m), the spectral efficiency and maximum transmission rate of a grid
can be calculated. Since the transmission capability of a grid is shared by multiple users, the
number of users transmitting data simultaneously in a cell must also be obtained in order to obtain
the grid's user experienced rate.
The number of UEs that transmit data simultaneously in a cell can be obtained based on traffic
statistics, including the number of UEs in RRC_CONNECTED state and the data transmission duty
cycle.
Based on the MRs from GPS-enabled UEs, a fingerprint database that maps the GPS and RSRP
data of each cell can be constructed on the network side. If the GPS function is not enabled on a
UE, the UE can query the fingerprint database for grid mapping based on the cell RSRP in the MR.
The UE can then participate in the calculation of grid-level experienced rate, improving the
accuracy of experience evaluation.
29The following figure shows the experience data distribution in a city served by China Unicom. The
experienced rate distribution in different areas is intuitively displayed, and poor experience areas
can be identified.
Grid Legend Setting
Grid rate (Mbit/s) Grid rate (Mbit/s)
Indoor grid rate (Mbit/s)
Outdoor grid rate (Mbit/s)
Base Station
Live network site
Grid frequency band
Site Info to Display
Site name
Cell name
Cell sector
IDW rendering
303.2. VoLTE Experience Evaluation Method
VoLTE service evaluation involves basic KPIs and voice quality.
Basic KPIs can be evaluated by observing network KPIs. Call success rate and call drop rate
correspond to the QCI1 E-RAB setup success rate and abnormal release rate on the RAN side
respectively. Call setup delay on the IP multimedia core network subsystem (IMS) is observed.
Voice quality is evaluated by the MOS value. To obtain the MOS value, perceptual evaluation of
speech quality (PESQ) standardized in ITU-T Recommendation P.862 or POLQA standardized in
ITU-T Recommendation P.863 is used to perform tests with assistance of special instruments.
Specifically, VoLTE calls are tested in the network planning area by means of outdoor DTs or
indoor fixed-point tests. The target UE is connected to a professional voice quality test instrument
(such as DSLA) which outputs the MOS value. This evaluation method requires professional test
personnel to perform a large number of tests on roads or indoors to obtain the voice quality of a
network. This method features high accuracy but huge labour input and insufficient traversal.
As an alternative of DT-based voice quality evaluation, the packet loss rate, packet error rate, and
jitter of uplink and downlink voice packets on the base station can be measured (periodically by the
base station and then mapped to MOS values using algorithms). Statistics are collected by
segment based on the MOS 0–5 range to obtain the distribution of different MOS values in a cell.
This method can evaluate the voice quality of a network from a macro perspective without
performing DTs, but the specific location of problems that compromise voice quality cannot be
determined.
The grid-based MOS evaluation method combines the advantages of the preceding two methods.
In this method, a network is divided into multiple 50 m x 50 m grids, with the RSRP and SINR of
each location on the network obtained based on the MRs of UEs and then mapped to the grids.
The voice quality in a grid is estimated based on mapping among the MOS value, RSRP, and
SINR determined in section 2.4.2 "VoLTE Experience Requirements on RF Performance." This
method can be used to obtain the voice quality of a network from a macro perspective and identify
specific areas where voice quality problems exist, thereby providing accurate input for network
optimization.
314. Summary
In the 5G era, network deployment and optimisation must take both signal coverage and service
experience satisfaction rates into consideration.
The mapping between services and air interface indicators described in this document can guide
network planning and optimisation. Based on the target services carried on a network, experience
requirements can be analysed, and experience objectives can be set accordingly. Eventually, air
interface KPIs such as RSRP, SINR, and network load are obtained to guide network construction.
The service experience evaluation methods described in this document can help operators identify
problems with user experience and perform targeted network optimisation, thereby providing better
user experience assurance.
32GSMA HEAD OFFICE Floor 2 The Walbrook Building 25 Walbrook London EC4N 8AF United Kingdom www.gsma.com
You can also read