Unreeling Netflix: Understanding and Improving Multi-CDN Movie Delivery
←
→
Page content transcription
If your browser does not render page correctly, please read the page content below
Unreeling Netflix: Understanding and Improving
               Multi-CDN Movie Delivery
Vijay Kumar Adhikari∗ , Yang Guo† , Fang Hao† , Matteo Varvello† , Volker Hilt† , Moritz Steiner† and Zhi-Li Zhang∗
                                           ∗ University   of Minnesota, † Bell-Labs/Alcatel-Lucent

   Abstract—Netflix is the leading provider of on-demand Internet          architecture can be considered as a possible blue print for a
video streaming in the US and Canada, accounting for 29.7%                 scalable, infrastructure-less content provider. We discuss the
of the peak downstream traffic in US. Understanding the Netflix            interaction between the components of this design including
architecture and its performance can shed light on how to best
optimize its design as well as on the design of similar on-demand          multiple CDNs and HTTP adaptive streaming, and analyze
streaming services. In this paper, we perform a measurement                the algorithms used by Netflix that provide the glue to piece
study of Netflix to uncover its architecture and service strategy.         together the overall system. We also shed light on the implica-
We find that Netflix employs a blend of data centers and Content           tions the Netflix design decisions have on CDNs, the network
Delivery Networks (CDNs) for content distribution. We also                 and the end user experience both to understand its performance
perform active measurements of the three CDNs employed by
Netflix to quantify the video delivery bandwidth available to              and to improve its design. In addition, based on our measure-
users across the US. Finally, as improvements to Netflix’s current         ment results, we suggest new video delivery strategies that
CDN assignment strategy, we propose a measurement-based                    can further improve user experience by effectively utilizing
adaptive CDN selection strategy and a multiple-CDN-based video             multiple CDNs.
delivery strategy, and demonstrate their potentials in significantly          Despite the popularity of Netflix, surprisingly there have
increasing user’s average bandwidth.
                                                                           been very few studies looking into its streaming service
                        I. I NTRODUCTION                                   platform. The authors of [4] investigate the Netflix secu-
                                                                           rity framework, while the authors of [5] focus on the rate-
   Netflix is the leading subscription service provider for                adaptation mechanisms employed by Silverlight player and
online movies and TV shows. Netflix attracts more than 23                  experimentally evaluated the Netflix players. To the best of
million subscribers in the United States and Canada, and can               our knowledge, we are the first to take a systematic look into
stream out HD (High Definition) quality video with average                 the architecture of the Netflix video streaming together with
bitrate reaching 3.6 Mbps. In fact, Netflix is the single largest          an extensive measurement study of three CDNs it employs.
source of Internet traffic in the US, consuming 29.7% of peak                 The main contributions of this paper can be summarized as
downstream traffic [1]. Its design and traffic management deci-            follows:
sions have a substantial impact on the network infrastructure.                • We dissect the basic architecture of the Netflix video
   Designing such a large scale, fast growing video streaming                    streaming platform by monitoring the communications
platform with high availability and scalability is technically                   between the Netflix player and various components of
challenging. The majority of functions used to be hosted in                      the Netflix platform. We collect a large number of Netflix
Netflix’s own data center. Recently, Netflix has resorted to                     video streaming manifest files to analyze how geographic
the use of cloud services [2], Content Distribution Networks                     locations, client capabilities, and content type affect the
(CDNs), and other public computing services. Amazon AWS                          streaming parameters used by Netflix, such as content
cloud replace in-house IT, and Amazon SimpleDB, S3 and                           formats, video quality levels, CDN ranking, and so forth.
Cassandra are used for file storage [2]. Video streaming is                   • We analyze how Netflix makes use of multiple CDNs un-
served out of multiple CDNs, and UltraDNS, a public DNS                          der changing bandwidth conditions. We find that Netflix
service, is used as its authoritative DNS servers. Microsoft                     players stay attached to a fixed CDN even when the other
Silverlight [3] is employed as the video playback platform                       CDNs can offer better video quality.
for Netflix desktop users. The end result is amazing: Netflix                 • We perform an extensive bandwidth measurement study
manages to build its Internet video delivery service with little                 of the three CDNs used by Netflix. The results show that
infrastructure of its own!                                                       there is significant variation in CDN performance across
   In this paper we provide a detailed analysis of the Netflix                   time and location.
architecture, which is designed to serve massive amounts                      • Finally, we explore alternative strategies for improving
of content by combining multiple third party services. This                      video delivery performance by using multiple CDNs. Our
                                                                                 study shows that selecting the best serving CDN based
   This study was done while Vijay Kumar Adhikari was a summer intern
at Bell Labs, Alcatel-Lucent. It was supported in part by the NSF grants         on a small number of measurements at the beginning of
08-31734, CNS-0905037, CNS-1017092 and CNS-1017647.                              each video session can deliver more than 12% bandwidth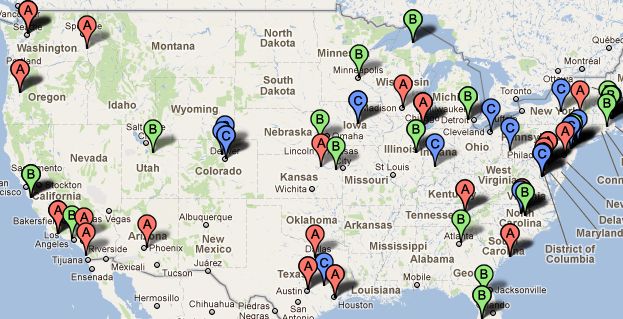
TABLE I
K EY N ETFLIX H OSTNAMES
Hostname Organization
www.netflix.com Netflix
signup.netflix.com Amazon
movies.netflix.com Amazon
agmoviecontrol.netflix.com Amazon
nflx.i.87f50a04.x.lcdn.nflximg.com Level 3
netflix-753.vo.llnwd.net Limelight
netflix753.as.nflximg.com.edgesuite.net Akamai
improvement over the static CDN assignment strategy
currently employed by Netflix. Furthermore, using mul-
tiple CDNs simultaneously can achieve more than 50%
improvement. Fig. 1. Netflix architecture
The paper is organized as follows. Section II describes
the architecture of Netflix video streaming system and CDN
signup.netflix.com based on whether the user is logged
selection strategy. Section III presents our measurement study
in or not respectively. This server does not interact with the
of the three CDNs. Section IV explores the alternative strate-
client during the movie playback, which is consistent with the
gies for CDN assignment in order to improve video delivery
recent presentation from Netflix team [9].
performance. Section V discusses the related work. Finally,
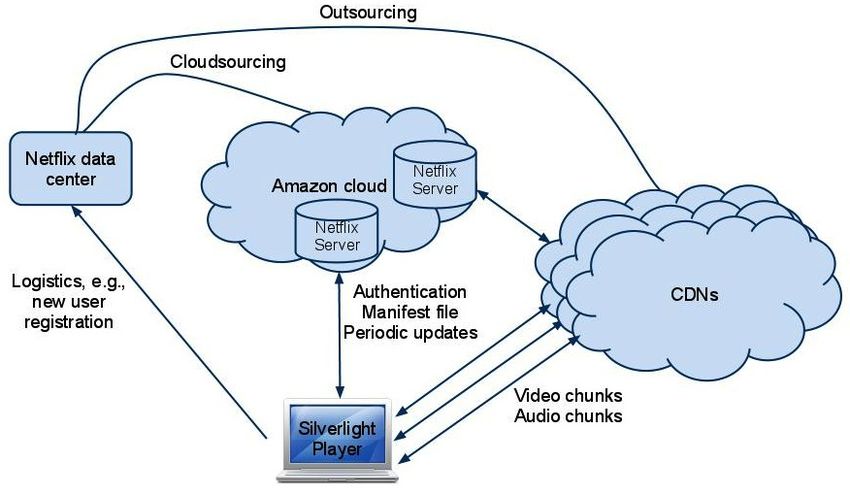
• Amazon cloud. Except for www.netflix.com
Section VI concludes the paper and discusses the future work.
which is hosted by Netflix, most of the other Netflix
II. N ETFLIX VIDEO STREAMING PLATFORM servers such as agmoviecontrol.netflix.com and
We start the section with the overview of Netflix video movies.netflix.com are served off the Amazon
streaming platform architecture. We dissect the architecture via cloud [10]. [9] indicates that Netflix uses various Amazon
cloud services, ranging from EC2 and S3, to SDB and
traffic monitoring, DNS resolutions, and WHOIS[6] lookup.
We then present the timeline of serving a single Netflix client VPC [10]. Key functions, such as content ingestion, log
as an example to illustrate the interplay between a Netflix recording/analysis, DRM, CDN routing, user sign-in, and
player and various service components. We further collect a mobile device support, are all done in Amazon cloud.
large number of video streaming manifest files using Tamper • Content Distribution Networks (CDNs). Netflix employs
Data add-on[7], and analyze how geographic locations, client multiple CDNs to deliver the video content to end users. The
capabilities, and content types influence the streaming parame- encoded and DRM protected videos are sourced in Amazon
ters. Finally, we focus on the Netflix CDN assignment strategy. cloud and copied to CDNs. Netflix employs three CDNs:
Using dummynet [8] to strategically throttle individual CDN’s Akamai, LimeLight, and Level-3. For the same video with the
bandwidth, we discover how Netflix makes use of multiple same quality level, the same encoded content is delivered from
CDNs in face of bandwidth fluctuation. all three CDNs. In Section II-D we study the Netflix strategy
used to select these CDNs to serve videos.
A. Overview of Netflix architecture • Players. Netflix uses Silverlight to download, decode and
To observe the basic service behavior, we create a new play Netflix movies on desktop web browsers. The run-time
user account, login into the Netflix website and play a movie. environment for Silverlight is available as a plug-in for most
We monitor the traffic during all of this activity and record web browsers. There are also players for mobile phones and
the hostnames of the servers involved in the process. We other devices such as Wii, Roku, etc. This paper, however,
then perform DNS resolutions to collect the canonical names focuses on Silverlight player running on desktop PCs.
(CNAMEs) and IP addresses of all the server names that Netflix uses the DASH (Dynamic Streaming over HTTP)
the browser have contacted. We also perform WHOIS[6] protocol for streaming. In DASH, each video is encoded at sev-
lookups for the IP addresses to find out their owners. Table eral different quality levels, and is divided into small ‘chunks’
I summarizes the most relevant hostnames and their owners. - video segments of no more than a few seconds in length. The
Fig. 1 shows the basic architecture for Netflix video streaming client requests one video chunk at a time via HTTP. With each
platform. It consists of four key components: Netflix data download, it measures the received bandwidth and runs a rate
center, Amazon cloud, CDNs and players. determination algorithm to determine the quality of the next
• Netflix data centers. Our analysis reveals that Net- chunk to request. DASH allows the player to freely switch
flix uses its own IP address space for the hostname between different quality levels at the chunk boundaries.
www.netflix.com. This server primarily handles two
key functions: (a) registration of new user accounts and B. Servicing a Netflix client
capture of payment information (credit card or Paypal ac- We now take a closer look at the interaction between the
count), and (b) redirect users to movies.netflix.com or client web browser and various web servers involved in theReporting (Amazon Cloud)
Audio chunk (CDN)
Video chunk (CDN)
Trickplay (CDN)
Manifest (Amazon Cloud)
Player (Amazon Cloud)
50 100 150 200 250 300
Number of seconds from start
Fig. 2. Timeline in serving a Netflix client
video playback process. Fig. 2 shows the timeline along which
the streaming service is provided to a desktop client, and level3
indicates the involved server entities. The X-axis in this figure 6
1
shows the time from the beginning of the experiment to 5 140
minutes and the Y-axis lists different activities. The client
first downloads the Microsoft Silverlight application from
limelight
movies.netflix.com and authenticates the user. After 4
authentication, the player fetches the manifest file from the 2
control server at agmoviecontrol.netflix.com, based 120
on which it starts to download trickplay data and audio/video
chunks from different CDNs. Client reports are sent back to akamai
the control server periodically. We describe further details of 9
3
individual activities below. 100
1) Silverlight player download and user authentication:
Video playback on a desktop computer requires the Microsoft
Silverlight browser plug-in to be installed on the computer. Fig. 3. CDN list in manifest file
When the user clicks on “Play Now” button, the browser
downloads the Silverlight application and then that application
starts downloading and playing the video content. This small
Silverlight application is downloaded for each video playback. more preferred than others. A section of one of the manifest
files is shown in Fig. 3, where Level3 is listed as the most
2) Netflix manifest file: Netflix video streaming are con-
preferred CDN for this client. We will conduct more elaborate
trolled by instructions in a manifest file that the Silverlight
experiments and discuss more details of the manifest files later
client downloads. The Netflix manifest file provides the DASH
in this section.
player metadata to conduct the adaptive video streaming.
The manifest files are client-specific, i.e., they are generated 3) Trickplay: Netflix Silverlight player supports simple
according to each client’s playback capability. For instance, trickplay such as pause, rewind, forward and random seek.
if the user player indicates it is capable of rendering h.264 Trickplay is achieved by downloading a set of thumbnail
encoded video, h.264 format video is included in the manifest images for periodic snapshots. The thumbnail resolution, pixel
file. If the player indicates that it can only play back .wmv aspect, trickplay interval, and CDN from where to download
format, only .wmv format video is included. the trickplay file are described in the manifest file. The
The manifest file is delivered to end user via SSL connection trickplay interval for the desktop browser is 10 seconds,
and hence the content of the file cannot be read over the wire and multiple resolutions and pixel aspects for trickplay are
using packet capture tools such as tcpdump or wireshark. We provided.
use Firefox browser and Tamper Data plug-in to extract the 4) Audio and video chunk downloading: As shown in
manifest files. The extracted manifest file is in XML format Fig. 2, audio and video contents are downloaded in chunks.
and contains several key pieces of information including the Download sessions are more frequent at the beginning so as
list of the CDNs, location of the trickplay data, video/audio to build up the player buffer. Once the buffer is sufficiently
chunk URLs for multiple quality levels, and timing parameters filled, downloads become periodic. The interval between the
such as time-out interval, polling interval and so on. The beginning of two consecutive downloads is approximately four
manifest file also reveals interesting information on the Netflix seconds - the playback length of a typical chunk.
system architecture. For instance, they show that Netflix uses The manifest file contains multiple audio and video quality
three CDNs to serve the videos. Different ranks are assigned levels. For each quality level, it contains the URLs for indi-
to different CDNs to indicate to the clients which CDN is vidual CDNs, as shown in Fig. 4.560
ranking determines from which CDN the client downloads
playready-h264mpl30-dash the video and may affect user perceived video quality. We
analyze the collected manifest files to understand the factors
512 that affect the rankings of the CDNs. For this analysis, we
384 build a table that lists CDN ranking for each combination of
user account, client computer (or PlanetLab proxy), movie ID
4 and time of day for several days. Analysis of this table suggests
3 that the CDN ranking is only based upon the user account.
v For a given user account, the CDN ranking in the manifest file
remains the same irrespective of movie types, computers, time
131xxx and locations. Furthermore, for the same movie, computer,
6 location and around the same time, two different users may
http://nflx.i.../...
see different CDN rankings. We also observe that the CDN
ranking for each user account remains unchanged for at least
131xxx several days. As we show in measurement results in the next
4
http://netflix.../... section, such assignment of ranking seems to be independent
of available bandwidth from each CDN.
2) Audio/Video bit rates: Netflix serves videos in multiple
131xxx
9 formats and bitrates. When a Netflix client requests for the
http://netflix.../... manifest file from Netflix, the client indicates the formats
of the content it can play. Netflix server then sends back
a manifest file based upon the client request. For instance,
Fig. 4. Video downloadable for one quality level Netflix client running on an older computer (Thinkpad T60
with Windows XP) and a newer computer (Macbook Pro with
Snow Leopard) have different capabilities and receive different
5) User experience reporting: After the playback starts, video downloading format and bit rates.
Netflix player communicates periodically with the control Based on the client capabilities, the server sends URLs for
server agmoviecontrol.netflix.com. Based upon the the video and audio chunks in the returned manifest files.
keywords such as “/heartbeat” and “/logblob” in the request In general, manifest files contain information about video
URLs and the periodicity of the communication, we conjecture chunks encoded in bitrates between 100Kbps to 1750Kbps
that they are periodic keep alive messages and log updates. (and 2350Kbps and 3600Kbps for videos available in HD) for
However, the actual messages that we have extracted by using the manifest files sent to the newer computer. We see that
Tamper Data do not appear to be in clear text and hence we videos available in HD can be served in up to 14 different
cannot verify it further. bitrates whereas non-HD content can be served in up to 12
different bitrates. We also note that Netflix clients do not try
C. Manifest file analysis all possible available bitrates when trying to determine the
A manifest file is delivered over the SSL connection. We optimal playback rate.
use Tamper Data plug-in for Firefox browser to read the file.
Since the manifest files contain a wealth of information and D. CDN selection strategy
shed lights on the Netflix strategies, we conduct a large scale We have seen that a Netflix client can choose different
experiment by collecting and analyzing a number of manifest video bitrates and different CDNs for video downloading. In
files. We are interested in understanding how geographic this section we conduct experiments to help understand how
locations, client capabilities, and content type (e.g., popular vs Netflix make such choices when bandwidth is dynamic. We
unpopular, movies vs TV shows) may impact the streaming play a single movie from the beginning. Once the playback
parameters. We use six different user accounts, 25 movies starts, we gradually throttle the available bandwidth of the top
of varying popularity, age and type, four computers with ranked CDN in the manifest file. We use dummynet to throttle
Mac and Windows systems at four different locations for this the inbound bandwidth to the client.
experiment. From each computer, we log into Netflix site using At the beginning, servers from each CDN are allowed to
each of the user accounts and play all of the movies for few send data at 3,900Kbps. After every minute, we reduce the
minutes to collect the manifest files. In addition to using client available bandwidth for the current CDN by 100Kbps till it
machines located in different geographies, we also configure reaches 100Kbps. At that point we start throttling the next
those client browsers to use Squid proxy servers running on CDN in the same way and so on. We plot our observation
ten PlanetLab nodes hosted by US universities in different in Fig. 5. In this figure, the X-axis shows the time starting
geographic regions to collect additional manifest files. from the beginning of playback. The Y-axis shows both the
1) CDN ranking and user accounts: Netflix manifest files throttled bandwidth and the playback rate. In this instance,
rank CDNs to indicate which CDNs are preferred. CDN Level3, Limelight and Akamai CDNs are ranked first, secondAllowed bandwidth/Observed bitrate (in Kbps)
4000
Bitrate − LimeLight
3500 Bitrate − Level3
Bitrate − Akamai
3000
Bandwidth − LimeLight
2500 Bandwidth − Level3
Bandwidth − Akamai
2000
1500
1000
500
0
0 1000 2000 3000 4000 5000 6000 7000 8000
Number of seconds from start
Fig. 5. CDN switching
• How does each CDN perform? Can the selected CDN
server consistently support the bandwidth needed for high
quality streaming?
• How do different CDNs compare in terms of perfor-
mance? Is any CDN clearly better or worse than others?
• How far is the current Netflix assignment strategy from
“optimal”?
• Is it possible to improve the assignment strategy to
support higher delivery bandwidth?
In the next two sections, we attempt to address the above
questions by conducting extensive measurement experiments
Fig. 6. Best CDN at each vantage point for the three CDNs used by Netflix from 95 vantage points
across the United States.
We measure the bandwidth throughput between each van-
and third respectively. The client starts downloading video tage point and a given CDN server by downloading multiple
chunks from the first CDN. In the beginning, it starts from video chunks from the CDN server. Video file URLs are
a low bitrate and gradually improves the bitrate in a probing collected for all three CDNs from manifest files. Here we
fashion. As we lower the available bandwidth for the first CDN take advantage of the fact that the URLs in the manifest
while leaving the other CDNs intact, we notice something remain valid for several hours from the time the manifest file is
interesting. Instead of switching to a different CDN, which generated, and the validity of the URLs are not tied to client
is not throttled, the client keeps lowering the bitrate and stays IP address. Furthermore, the byte “range” of the download
with the first CDN. Only when it can no longer support even can be adjusted without affecting the URL validity. Once we
the very low quality level (i.e. when the available bandwidth extract the URLs for the three CDNs, we “replay” the GET
for the first CDN reaches 100Kbps), it switches to the second request from all vantage points with byte range modified so
CDN. It repeats almost the same behavior as we leave the first that we download video chunks of the same size.
CDN at 100Kbps and gradually lower the available bandwidth Similar to the actual Netflix video playback, when GET
for the second CDN while leaving the third CDN intact. In requests are sent from a vantage point, the hostnames in
general, the Netflix client appears to stay with the same CDN the URLs are resolved by DNS server, which returns the
as long as possible even if it has to degrade the quality level IP address of the edge server assigned by the CDN. To
of the playback. ensure the measured bandwidth of three CDNs are comparable,
we send GET requests to three CDNs in round-robin order
III. CDN P ERFORMANCE M EASUREMENT within a short duration. More specifically, measurement is
We have observed in the previous section that Netflix CDN repeated in multiple “rounds”, with each round lasting 96
ranking is tied to each user account and remains unchanged seconds. A round is further partitioned into four “slots”, with
over many days. Even a change in the user geographic location 24 seconds for each slot. The first three slots of each round
does not trigger any CDN ranking change. Such assignment correspond to three CDNs, respectively, and we download
strategy naturally leads to the following questions: video chunks of size 1.8MByte. The last slot of each round100 20
CDN A CDN A CDN A
160
CDN B CDN B CDN B
Average bandwidth in Mbps
Average bandwidth in Mbps
80 CDN C 140 CDN C CDN C
15
120
60
100
CDF
10
80
40
60
5
20 40
20
0 0
0 35.8 71.6 107.4 143.2 179 20 40 60 80 1 2 3 4 5 6 7 8 9 10 11 12
Average bandwidth in Mbps PlanetLab node IDs Residential host IDs
Fig. 7. CDF of average bandwidth for three CDNs Fig. 8. Average bandwidth for the three CDNs at Fig. 9. Average bandwidth for the three CDNs at
measured at 83 PlanetLab nodes different PlanetLab nodes over the entire period different residential networks over the entire period
is for a “joint” measurement for all CDNs, i.e., we send GET As the result indicates, no CDN clearly outperforms the others.
requests to the three CDNs simultaneously, each requesting In addition, Fig. 7 shows the CDF (Cumulative Distribution
video chunks for 0.6MByte data. We intend to find out how Function) of average bandwidth at the PlanetLab nodes over
much total bandwidth one can get if all three CDNs are used the entire measurement period. The available bandwidth at
simultaneously. We pick the size of the chunks and length different PlanetLab nodes varies significantly from location
of “slots” based upon multiple trial measurements. In our to location, ranging from 3Mbps to more than 200Mbps. The
trials, we find that these numbers make sure that different CDF curves of three CDNs, however, are close to each other,
experiments do not interfere with each other and chunk size indicating similar overall performance.
is sufficiently large so that we can have a good estimate of the Figures 8 and 9 further show the average bandwidth at
bandwidth. We also send keep-alive messages to each server individual locations for PlanetLab nodes and residential sites,
every second when no data is transferred to make sure that the respectively. The location index is sorted in the ascending or-
TCP session is alive and sender window size does not drop. der of CDN A’s average bandwidth. CDN bandwidth measured
The measurement is conducted for two hours between 8 to at PlanetLab nodes appear to have much higher than that of
10pm CST, from June 8, 2011 to June 26, 2011. Based on residential sites in general. This is because most PlanetLab
downloading time, we calculate the instantaneous bandwidth nodes are located in universities, which typically have better
(i.e., throughput for each GET request), the one-day average access links. This also implies that in most cases, the last mile
bandwidth (average bandwidth during the two hour period), is still the bottleneck for streaming video. However, even the
and average bandwidth (over entire measurement study). These residential sites with relatively low bandwidth, e.g. home 1
metrics allow us to examine CDN performance at multiple and 2 in Fig. 9, can support 1.3Mbps on average, enough for
timescales. standard definition (SD) videos.
We have conducted experiments from both residential sites It is also interesting to note that home sites 4, 9, and 11
and PlanetLab nodes. There are 12 residential sites, 10 in New see significantly different average bandwidth from different
Jersey, 1 in Minnesota, and 1 in California. The residential CDNs. In particular, CDN B outperforms all others by a large
sites spread across 5 different service providers. To cover margin. We find that these three homes use the same service
a wider range of geographic locations, we also choose 83 provider. It is conceivable that CDN B has a better presence
PlanetLab nodes spread across the United States as additional in this provider’s network.
vantage points. We ensure that all selected PlanetLab nodes B. Daily bandwidth variation
are lightly loaded so that the nodes themselves do not become
the bottleneck and the measurement results reflect the actual Next we examine the bandwidth variation at different sites
bandwidth that can be supported by the CDN server and the from different CDNs over different timescales. We compute
network. the coefficient of variance of the daily average bandwidth at
The rest of this section attempts to address the first two all PlanetLab nodes by computing the ratio of the standard
questions on CDN performance. We will further investigate deviation to the mean at each of the locations. Fig. 10
the other two questions on performance improvement in the shows the coefficient of variance for the one-day average
Section IV. We use CDN A, B, and C to denote the three bandwidth at different PlanetLab nodes over multiple days.
CDNs without particular order in the rest of the discussion. We indeed see high coefficient of variance at most nodes.
The average coefficient of variance is 0.33, 0.30, and 0.30 for
A. Overall CDN performance CDN A, B and C, respectively. At most locations, there is a
Fig. 6 shows the locations of all vantage points in our significant variation in daily bandwidth for all three CDNs.
experiments as well as the CDN with highest average band- We show a few representative locations in Figures 11, 12
width at each vantage point during the measurement period. and 13, which plot the one-day average bandwidth over the2 45 10
CDN A CDN A
CDN B 40 CDN B 9
Average bandwidth in Mbps
Average bandwidth in Mbps
CDN C CDN C
Coefficient of variance
1.5 35
8
30
7
1 25
6
20
5
0.5 15
CDN A
10 4 CDN B
CDN C
5 3
20 40 60 80 0 5 10 15 20 0 5 10 15
PlanetLab node IDs Time (in days) Time (in days)
Fig. 10. Coefficient of variance for the one-day Fig. 11. One-day average bandwidth at a PlanetLab Fig. 12. One-day average bandwidth over time at
average bandwidth at different PlanetLab nodes node over time residential site 7
measurement period at one PlanetLab node and two residential video viewing quality may suffer even though other CDNs can
sites, respectively. The results show significant variation of provide them with more satisfying experience. In addition to
average bandwidth on a daily basis. improving experience for “unlucky” users, exploring potential
Furthermore, Figures 11, 12 and 13 show that the per- ways of increasing video delivery bandwidth may also open
formance ranking of different CDNs also change over time. doors for new bandwidth-demanding services in future, e.g.,
Although the lowest CDN bandwidth across all three nodes 3D movies or multiple concurrent movies in the same house-
is still above 3Mbps, sufficient to support standard definition hold.
(SD) levels, the significant variation in bandwidth and ranking In this section, we first determine how much room there is
of CDNs indicates a good potential to further increase band- for further improvement. In other words, if we could have the
width for future higher quality video delivery if better CDN optimal CDN selection strategy in theory, how much better
selection strategy is used. it would be compared to current static assignment. We then
explore two alternative strategies for CDN assignment that can
C. Variation in instantaneous bandwidth
easily be used in practice, and demonstrate we can indeed
We further investigate the instantaneous bandwidth variation significantly increase the bandwidth for video delivery to users
during two hours of video playing. This is important since a despite the simplicity of such strategies.
DASH player constantly monitors the available bandwidth to
decide which quality level of video to download. The small A. Room for improvement
time scale bandwidth may significantly impact the Netflix Given the instantaneous bandwidth trace, the optimal CDN
users’ viewing experience as two hours is a typical length of selection strategy is to choose the top CDN at each point of
movie. Figures 14, 15 and 16 show the comparison of three time. Although this cannot be done in practice since we do not
CDNs for the same PlanetLab node and residential nodes. know the instantaneous bandwidth beforehand, this theoretical
Although the variance is still significant, there is a “pattern” optimal strategy allows us to find out the highest bandwidth
in the bandwidth change. For example, bandwidth for CDN B each client can receive if the best (one) CDN is used at
in Fig. 14 alternates between two levels, one around 35 Mbps any given point of time. We refer to the average bandwidth
and one around 20 Mbps. The average coefficient of variation achieved by the optimal strategy as the upper bound average
for two hour period is 0.19, 0.21 and 0.18 respectively for bandwidth.
CDNs A, B and C respectively for residential sites. Fig. 17 and Fig. 18 show the average bandwidth of three
CDNs and the upper bound average bandwidth for residential
IV. A LTERNATE V IDEO D ELIVERY S TRATEGIES sites and PlanetLab nodes respectively. Here we use the
From the measurement study, we observe that Netflix stat- average bandwidth over all three CDNs to reflect the static
ically assigns a CDN to users for extended period of time. assignment strategy. The actual assignment may of course be
Although all three CDNs are available, each user only uses one better or worse depending on which CDN gets selected, but
in most cases. Other CDNs appear to serve only as backups this gives the expected value. We also show the bandwidth if
and are used only if current CDN server cannot support even one top CDN, i.e., the one with highest average bandwidth
the lowest video quality. On the other hand, our study also is selected. For the majority of the sites, the upper bound is
shows that the available bandwidth on all three CDNs vary much better than the average CDN case, and close to the top
significantly over time and over geographic locations. For CDN case. In particular, the upper bound is 17% and 33%
instance, as shown in Fig. 6, out of 83 PlanetLab locations, better than the average case for residential sites and PlanetLab
CDNs A, B, and C perform best at 30, 28 and 25 locations, nodes respectively, indicating there is significant room for
respectively. The measurement study of residential hosts shows improvement. Assigning users to top CDN is only 6% to 7%
similar results. If users are tied to a bad CDN choice, their worse than the theoretical optimal case. This indicates that if20 40 25
CDN A CDN A
35 CDN B CDN B
Average bandwidth in Mbps
Average bandwidth in Mbps
Average bandwidth in Mbps
CDN C 20 CDN C
15 30
25 15
10 20
15 10
5 10
CDN A 5
CDN B 5
CDN C
0 0 0
0 5 10 15 0 0.5 1 1.5 2 0 0.5 1 1.5 2
Time (in days) Time (in hours) Time (in hours)
Fig. 13. One-day average bandwidth over time at Fig. 14. Instantaneous bandwidth for the three Fig. 15. Instantaneous bandwidth for the three
residential site 9 CDNs at a PlanetLab node CDNs at residential site 7
10
CDN A Best CDN Best CDN
9 18 200
CDN B Average CDN Average CDN
Average bandwidth in Mbps
Average bandwidth in Mbps
Average bandwidth in Mbps
CDN C 16 Upper bound Upper bound
8
14 150
7
12
6 10
100
5 8
4 6
50
3 4
2
2
0 0.5 1 1.5 2 2 4 6 8 10 12 20 40 60 80
Time (in hours) Residential site IDs PlanetLab node IDs
Fig. 16. Instantaneous bandwidth for the three Fig. 17. Average bandwidth for three CDNs and Fig. 18. Average bandwidth for three CDNs and
CDNs at 9-th residential site the upper bound at residential sites the upper bound at PlanetLab nodes
we can estimate which CDN is likely to perform best in next is very straightforward and easy to implement, we believe this
couple hours, we can achieve average bandwidth that is fairly is a favorable approach for improving video delivery.
close to the upper bound average bandwidth.
C. Using multiple CDNs simultaneously
B. Measurement based CDN selection In previous sections, we have assumed that only one CDN
Since selecting the top CDN for users gives good perfor- can be used at a time. However, since Silverlight player
mance, we next study how to identify the top CDN effectively. downloads video and audio content in chunks, it is possible
We propose to have the player conduct the instantaneous to use all three CDNs simultaneously. For instance, the player
bandwidth measurement multiple times at the beginning, and can download three different chunks in parallel from three
assign users the best-performing CDN for the rest of the different CDNs to obtain larger bandwidth. Since the design
movie. Fig. 19 shows the effect of number of measurements of a HTTP adaptive streaming protocol that can best utilize
on performance. As reference, two straight lines show the ratio multiple CDNs is out of the scope of this paper, we try to see
of the CDN average bandwidth over top CDN bandwidth for if multiple CDNs can be used, whether they can offer higher
all PlanetLab and residential nodes, respectively. In both cases aggregated throughput for end users.
we calculate the average CDN bandwidth over all locations, Fig. 20 and Fig. 21 compare the average bandwidth using
time, and CDN providers, so they reflect the expected CDN top CDN and the average bandwidth obtained by combining
performance, assuming the three CDNs are equally likely to three CDNs for residential and PlanetLab nodes, respectively.
be chosen in the static CDN assignment strategy. The other We see that combining all three CDNs can significantly
two curves are ratio of average bandwidth using measurement improve the average bandwidth. Specifically, the aggregate
based CDN selection strategy over that of using top CDN bandwidth obtained by combining all 3 CDNs is greater than
for both PlanetLab nodes and residential sites. Using a small the bandwidth of the single best CDN by 54% to 70% for
number of measurements (≥ 2), the measurement based residential sites and PlanetLab nodes, respectively.
strategy delivers more than 12% improvement over the static
CDN assignment strategy. Although the average improvement V. R ELATED W ORK
is moderate, for certain users the improvement is significant, Several recent works have been done in analyzing dif-
e.g., more than 100% for residential host 4. Given this method ferent aspects of Netflix video streaming. Akhshabi et al.100 400
30 Best CDN Best CDN
95 3 CDNs combined 350 3 CDNs combined
Average bandwidth in Mbps
Percentage of the best CDN
Average bandwidth in Mbps
90 25 300
85 20 250
80 200
15
75 150
PlanetLab with measurement 10
70 100
PlanetLab average
65 Residential with measurement
5 50
Residential average
60
0 2 4 6 8 10 2 4 6 8 10 12 20 40 60 80
Number of measurements in the beginning Residential host IDs PlanetLab node IDs
Fig. 19. Measurement based CDN selection: effect Fig. 20. Bandwidth from best CDN vs three Fig. 21. Bandwidth from best CDN vs three
of number of measurements combined CDNs for residential hosts combined CDNs for PlanetLab nodes
have studied several video streaming players including Netflix find that conducting light-weighted measurement at the begin-
player and investigated how the streaming clients react to ning of the video playback and choosing the best-performing
bandwidth changes [5]. The measurement is done mostly from CDN can improve the average bandwidth by more than 12%
one fixed location. Pomelo has also presented an interesting than static CDN assignment strategy, and using all three CDNs
analysis of Netflix security framework [4]. This work was simultaneously can improve the average bandwidth by more
done before Netflix is migrated into Amazon cloud. Unlike than 50%. This can be very beneficial for future bandwidth-
the previous work, we investigate a broader set of components demanding services such as 3D movies.
in Netflix video delivery system, and focus on how the player Future work can proceed in couple of directions. We are
interacts with different CDNs. To achieve this, we conduct interested in looking into other video streaming delivery
more extensive measurement from multiple geo locations. systems such as Hulu, to see if cloudsourcing and/or multiple
Recent work has also been done for other streaming CDN strategy have been adopted. Another venue is to develop
platforms [11], [12]. Krishnappa et al. have studied Hulu practical HTTP adaptive streaming system that can actually
streaming with emphasis on improving performance using utilize multiple CDNs simultaneously.
prefetching and caching [11]. Adhikari et al. build a measure-
R EFERENCES
ment infrastructure by using PlanetLab nodes with the goal to
understand the YouTube system architecture [12]. Unlike our [1] Sandvine, “Global Internet Phenomena Report, Spring 2011,” http:
//www.sandvine.com/news/global broadband trends.asp, 2011.
work, such works do not cover behavior of multiple CDNs. [2] A. Cockroft, C. Hicks, and G. Orzell, “Lessons Netflix Learned from
Extensive work has been done to study CDNs such as the AWS Outage,” Netflix Techblog, 2011.
Akamai, Limelight and Google/YouTube [13], [14], [12]. But [3] “Microsoft Silverlight,” http://www.microsoft.com/silverlight/.
[4] Pomelo LLC, “Analysis of Netixs security framework for ‘Watch In-
most work has been focusing on measurement of latency and stantly’ service.” 2009.
does not cover the scenario where the client interacts with [5] S. Akhshabi et al., “An experimental evaluation of rate-adaptation
multiple CDNs. algorithms in adaptive streaming over http,” in MMSys’11.
[6] L. Daigle, “WHOIS Protocol Specification,” RFC 3912, 2004.
Many techniques have been proposed to measure available [7] “Tamper Data,” addons.mozilla.org/en-US/firefox/addon/tamper-data.
bandwidth on a network path before, such as pathchar [15], [8] “Dummynet,” http://info.iet.unipi.it/∼ luigi/dummynet/.
pathload [16] and FabProbe [17]. However, they are not [9] A. Cockroft, “Netflix Cloud Architecture,” Velocity conference, 2011.
[10] “Amazon Web Services,” http://aws.amazon.com.
suitable for our study for two reasons. First, both pathchar [11] D. K. Krishnappa et al., “On the feasibility of prefetching and caching
and pathload require control at the target machine of the for online tv services: a measurement study on hulu,” in PAM’11.
measurement. Second, all such tools only measure the in- [12] V. K. Adhikari, S. Jain, Y. Chen, and Z.-L. Zhang, “Vivisecting youtube:
An active measurement study,” in INFOCOM’12 Mini-conference, 2012.
path bandwidth and they cannot capture possible bandwidth [13] A.-J. Su et al., “Drafting behind akamai: inferring network conditions
shaping at the server side. Additionally, using our method based on cdn redirections,” IEEE/ACM Trans. Netw., 2009.
more accurately reflects the download speed over HTTP than [14] C. Huang, A. Wang, J. Li, and K. W. Ross, “Understanding hybrid cdn-
p2p: why limelight needs its own red swoosh,” in NOSSDAV ’08.
other generic methods. [15] A. Downey, “Using pathchar to estimate internet link characteristics,”
in ACM SIGCOMM CCR, 1999.
VI. C ONCLUSIONS [16] M. Jain and C. Dovrolis, “ Pathload: A Measurement Tool for End-to-
In this paper, we perform active and passive measurements End Available Bandwidth ,” in PAM’02, March 2002.
[17] D. Croce, T. En-Najjary, G. Urvoy-Keller, and E. W. Biersack, “Fast
to uncover the overall architecture of Netflix, currently the available bandwidth sampling for adsl links: Rethinking the estimation
leading on-demand video streaming Internet provider. Since for larger-scale measurements,” in PAM ’09, 2009, pp. 67–76.
Netflix uses multiple Content Delivery Networks (CDNs) to
deliver videos to its subscribers, we measure the available
bandwidth of employed CDNs, and investigate its behavior at
multiple time scales and at different geographic locations. WeYou can also read