New Zealand Journal of Marine and Freshwater Research
←
→
Page content transcription
If your browser does not render page correctly, please read the page content below
This article was downloaded by: [144.76.86.22]
On: 25 July 2015, At: 16:30
Publisher: Taylor & Francis
Informa Ltd Registered in England and Wales Registered Number: 1072954 Registered
office: 5 Howick Place, London, SW1P 1WG

                                New Zealand Journal of Marine and
                                Freshwater Research
                                Publication details, including instructions for authors and
                                subscription information:
                                http://www.tandfonline.com/loi/tnzm20

                                Sediment macrobenthos off eastern
                                Waiheke Island, Hauraki Gulf, New
                                Zealand
                                                 a b                    a
                                KL Clara Wong          & Steve O'Shea
                                a
                                    Earth & Oceanic Sciences Research Institute
                                b
                                 School of Applied Sciences , Auckland University of Technology ,
                                Auckland, New Zealand
                                Published online: 06 Sep 2010.

To cite this article: KL Clara Wong & Steve O'Shea (2010) Sediment macrobenthos off eastern
Waiheke Island, Hauraki Gulf, New Zealand, New Zealand Journal of Marine and Freshwater
Research, 44:3, 149-165, DOI: 10.1080/00288330.2010.498088

To link to this article: http://dx.doi.org/10.1080/00288330.2010.498088

PLEASE SCROLL DOWN FOR ARTICLE

Taylor & Francis makes every effort to ensure the accuracy of all the information (the
“Content”) contained in the publications on our platform. However, Taylor & Francis,
our agents, and our licensors make no representations or warranties whatsoever as to
the accuracy, completeness, or suitability for any purpose of the Content. Any opinions
and views expressed in this publication are the opinions and views of the authors,
and are not the views of or endorsed by Taylor & Francis. The accuracy of the Content
should not be relied upon and should be independently verified with primary sources
of information. Taylor and Francis shall not be liable for any losses, actions, claims,
proceedings, demands, costs, expenses, damages, and other liabilities whatsoever
or howsoever caused arising directly or indirectly in connection with, in relation to or
arising out of the use of the Content.

This article may be used for research, teaching, and private study purposes. Any
substantial or systematic reproduction, redistribution, reselling, loan, sub-licensing,
systematic supply, or distribution in any form to anyone is expressly forbidden. Terms &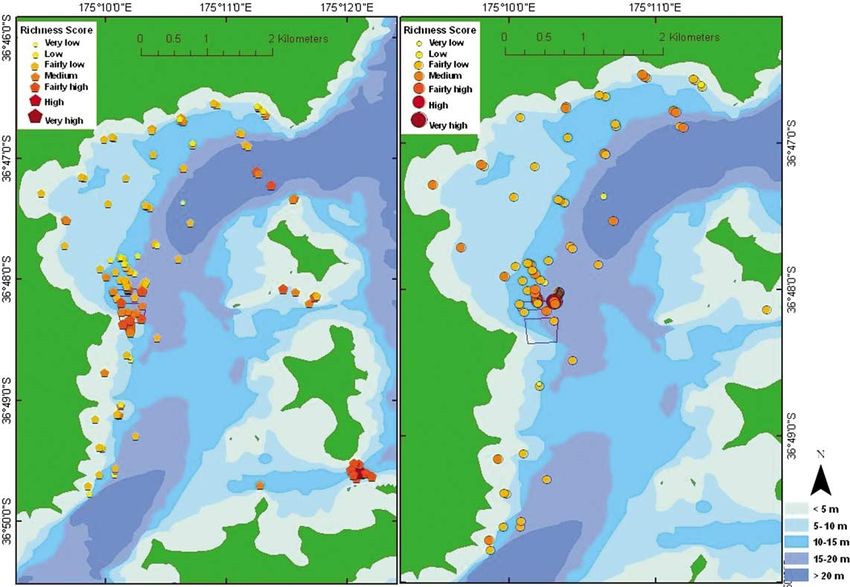
Conditions of access and use can be found at http://www.tandfonline.com/page/terms-
                                                     and-conditions
Downloaded by [144.76.86.22] at 16:30 25 July 2015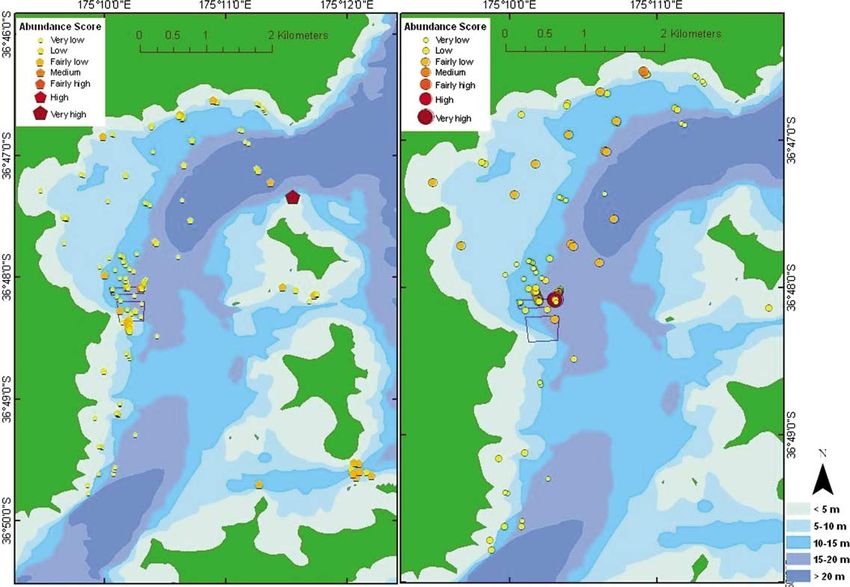
New Zealand Journal of Marine and Freshwater Research
                                                     Vol. 44, No. 3, September 2010, 149165

                                                     Sediment macrobenthos off eastern Waiheke Island, Hauraki Gulf,
                                                     New Zealand
                                                     KL Clara Wonga,b* and Steve O’Sheaa
                                                     a
                                                      Earth & Oceanic Sciences Research Institute; bSchool of Applied Sciences, Auckland University of Technology,
                                                     Auckland, New Zealand
                                                     (Received 14 January 2010; final version received 27 May 2010)

                                                            Aspects of sea-bed structure and benthic-macroinvertebrate species composition, distribution,
                                                            richness and diversity in coastal waters off eastern Waiheke Island, Hauraki Gulf, are reported.
                                                            In contrast to the sole historical account of sea-bed community structure from this same region,
Downloaded by [144.76.86.22] at 16:30 25 July 2015

                                                            no widely distributed assemblages of species are recognised throughout it; no two sites share the
                                                            exact same complement of species; and almost all sites are less than 80% similar in their
                                                            taxonomic composition, most considerably so. Species richness and diversity are reported to
                                                            vary with substratum type and depth, and spatially; species occurring within muds are the least
                                                            diverse and species rich, followed by those of muddy gravels, and then gravels; many taxa prove
                                                            common to the three substratum types; and dominance of taxa is recognised to decrease with an
                                                            increase in substratum complexity, from muds to gravels, and species richness. With the
                                                            exception of invasive marine species, apparent changes in the composition of assemblages
                                                            throughout this region over the eight-decade period that data span are considered artefacts of
                                                            the way in which such assemblages were historically defined. We recommend historical accounts
                                                            of sea-bed community distributions throughout Hauraki Gulf be interpreted with caution,
                                                            especially when attempting to use such schematic depictions to determine whether changes have
                                                            occurred in assemblage composition.
                                                            Keywords: Waiheke Island; sea-bed communities; benthos; sediments; species; diversity;
                                                            richness; dominance

                                                     Introduction                                             generalised assemblages of species occur
                                                     Substantive accounts of the composition and              throughout parts of Hauraki Gulf. However,
                                                     distribution of sea-bed communities through-             biological data from neither of these accounts
                                                     out Hauraki Gulf are few, limited largely to the         have been subject to more rigorous multivariate
                                                     pioneering works of Powell (1937), based on              statistical evaluation, and as such the validity of
                                                     sampling at 138 dredge stations undertaken               purported species assemblages has not been
                                                     between 1926 and 1936 throughout the gulf,               demonstrated.
                                                     and a broadly comparable but more geogra-                    With the exception of that limited sea-bed
                                                     phically limited survey of the inner Waitemata           sampling reported by Powell (1937), sea-bed
                                                     Harbour and Rangitoto Channel undertaken                 communities off eastern Waiheke Island have
                                                     by Hayward et al. (1997), based on sampling at           not been reported. On the basis of nine widely
                                                     150 dredge stations surveyed between 1993 and            spread dredge stations, three collected in 1927
                                                     1995. These studies have firmly entrenched in            and six in 1933, Powell (1937) recognised two
                                                     the minds of natural historians the concept that         sea-bed formations in this region: a widespread

                                                     *Corresponding author. Email: clara.wong@aut.ac.nz
                                                     ISSN 0028-8330 print/ISSN 1175-8805 online
                                                     # 2010 The Royal Society of New Zealand
                                                     DOI: 10.1080/00288330.2010.498088
                                                     http://www.informaworld.com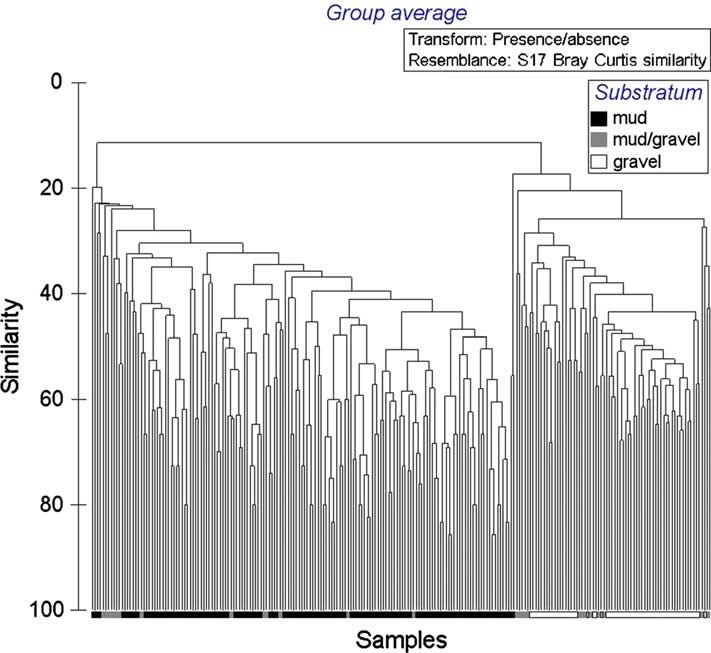
l

                                                         150 KLC Wong and S O’Shea

                                                         urchin (Echinocardium) formation/association;     characteristic species, and secondarily on the
                                                         and a more-restricted-in distribution bivalve     basis of changes in species richness (Powell
                                                         (TaweraVenericardia (now Purpurocardia))         1937: 371). However, we cannot reliably repli-
                                                         formation/association (Fig. 1). Powell appears    cate this procedure, a problem exacerbated by
                                                         to have differentiated his formations from his    Powell’s boundaries also being somewhat in-
                                                         associations on the basis of the absence of a     tuitively defined and likely influenced by that
    Downloaded by [144.76.86.22] at 16:30 25 July 2015

                                                         Fig. 1 Site distribution and associated substratum type [hatched area depicts TaweraPurpurocardia
                                                         formation of Powell (1937)]; insets: North Island, New Zealand; and Waiheke Island, Hauraki Gulf.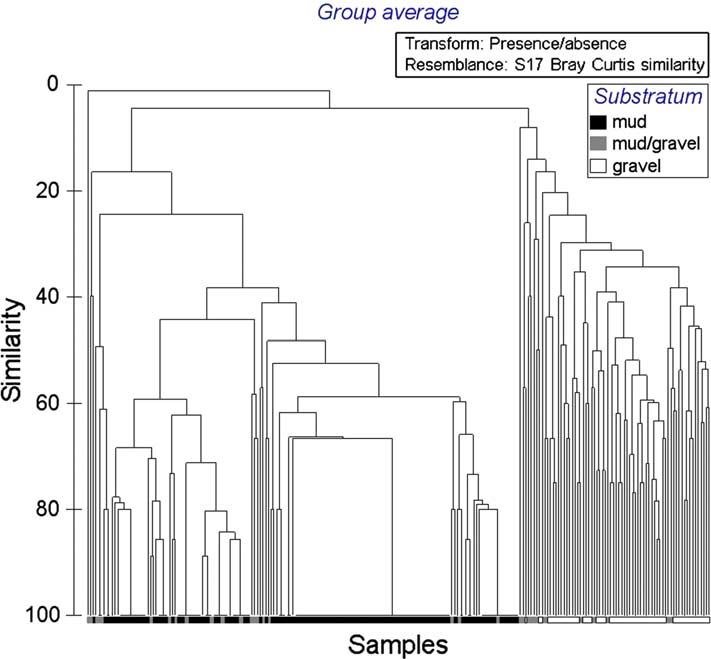
Sediment macrobenthos off eastern Waiheke Island 151

                                                     information he had on the composition of            in a 5% buffered (sodium bicarbonate) for-
                                                     sediments throughout the region.                    malinseawater solution and returned to the
                                                         The purpose of the survey reported herein       laboratory. These were subsequently sieved
                                                     was to establish series of control sites for a      over a 500-mm Endicott mesh, then species
                                                     separate monitoring programme designed to           removed from the coarser fraction (500 mm)
                                                     evaluate the effects of mussel farming on sea-      and identified to the lowest common denomi-
                                                     bed communities off Taniwhanui Point, rather        nator, whether this be species or species-specific
                                                     than to critique Powell’s sea-bed communities       enumerated unknown, with the exception of all
                                                     off eastern Waiheke Island (Fig. 1). As such, all   Nemertea, Nematoda and Oligochaeta, each
                                                     sites surveyed by Powell were not resampled.        treated as single taxonomic entities. A voucher
                                                     Nevertheless, as a consequence of our study, we     collection of all taxa has been accessioned into
                                                     can report the benthos and sedimentary char-        the biological collections of Auckland Univer-
                                                     acteristics of the sea bed in a quantitative        sity of Technology; full biological data from
                                                     manner at many more sites spread over a             these sites, and those surveyed elsewhere
                                                     greater area than has been previously reported.     throughout Hauraki Gulf are available online
Downloaded by [144.76.86.22] at 16:30 25 July 2015

                                                     This represents the first fully quantitative        at the Monalisa Biodiversity database, www.
                                                     evaluation of sea-bed communities in Hauraki        Monalisa.ac.nz.
                                                     Gulf, which we intend to augment with addi-             With the time and resources available, it was
                                                     tional accounts of sea-bed fauna elsewhere (see     not possible to analyse sediment grain-size
                                                     the Monalisa Biodiversity Database for cover-       properties from each of the 228 biological sites
                                                     age, www.Monalisa.ac.nz).                           that were surveyed; our compromise was to
                                                                                                         describe sediments from these sites as either
                                                                                                         predominantly mud, mud/gravel or gravel,
                                                     Methods                                             based on a visual and tactile appraisal of the
                                                     The sea bed from 430 m between Cowes Bay           proportion of shell gravel and granule to mud
                                                     and Kauri Point (36846.5249.85?S, 175809.47       and silt within it. To characterise sediment grain-
                                                     12.21?E), eastern Waiheke Island, was surveyed      size properties more accurately, nine additional
                                                     during February of 2008. Macrobenthic fauna         samples were collected, three from locations
                                                     was identified from 228 sea-bed samples, 102        classified as belonging to each aforementioned
                                                     samples (34 sites with three replicates at each)    substratum type. Percentage volumes for sedi-
                                                     from along three transects extending from           ment fractions (3.35, 1.18 and 1.0 mm, and 600,
                                                     within an existing mussel farm off Taniwhanui       500, 300, 150, 63, 11 and B11 mm) were
                                                     Point to approximately 80 m outside its physi-      determined by wet-sieving, with the grain-size
                                                     cal boundary, and 126 non-replicated grab sites     properties of each sample characterised by
                                                     spread throughout the greater survey region         five granulometric indices: median particle dia-
                                                     (Fig. 1). Nine further grabs were collected         meter (850), first (825) and third (875) quartiles,
                                                     at representative sites for sediment grain-size     sorting coefficient ((875825)/2), and 8-
                                                     analysis.                                           quartile skewness ((875825)/2 850); the
                                                         All samples, whether collected for biological   degree of sorting of each sediment sample was
                                                     purposes or for sediment grain-size analysis,       characterised in accordance with the classifica-
                                                     were taken by Van Veen grab. This grab has          tion of Gray (1981).
                                                     a bite aperture of 0.0336 m2, but the depth             To determine if any depth-related differ-
                                                     to which it samples depends upon grain size         ences were apparent in the composition of sea-
                                                     and degree of substratum compaction; any grab       bed communities, mud and mud/gravel sites
                                                     was discarded in the event the sample was not       were placed into three arbitrarily selected depth
                                                     at least 75% full. Upon collection, samples        ranges, capturing the range in depth through-
                                                     for biological analyses were immediately fixed      out the region: those more shallow than 10 m,
152 KLC Wong and S O’Shea
those from 1015 m, and those at depths
15 m (to 30 m); gravel sites were encountered
within only two of these depth ranges, those
more shallow than 10 m, and those between 10
and 15 m.
Biological data were analysed using PRI-
MER v6 (Clarke & Gorley 2006). Measures of
biological diversity were presented in five
indices: total individuals (n), Margalef’s index
of species richness (d), Pielou’s evenness index
(J’), ShannonWiener diversity index (H’), and
Simpson dominance index (l). To determine Fig. 2 Dry weight composition of sediment grain
whether significant differences existed in these size class each of the three substrata (mud, mud/
gravel and gravel).
indices in different substrata, each was tested
by ANOVA in SPSS 15.0. To determine the
in the distribution of species richness existed
Downloaded by [144.76.86.22] at 16:30 25 July 2015
relationship between species dominance, sub-
throughout the region, such as localised ‘hot
stratum type, and species richness, Simpson
spots’ of richness. To do this, we created a 7-
index (l), a dominance index, was plotted
point index of species richness from and unique
against species richness for each substratum.
A similarity matrix was constructed using to our data set, with relative measures of
square-root transformed data and the Bray species richness ranging very low to very high
Curtis coefficient. Data were presented graphi- (Table 1); for instance, should a sample from
cally using multi-dimensional scaling (MDS) any site have three species in it, and the range in
ordinations and group average clustering richness (number of species) throughout the
(CLUSTER). Significant differences in the com- region be 269 per sample, then such a site
position of species assemblages by depth and would be categorised as very low in richness (3
substratum type (groups) were determined using being 4.3% of 69). The second classification
a randomised permutation test (ANOSIM; enables the spatial distribution of abundance
Clarke & Green 1988) on the similarity matrix. (density) to be depicted, calculated in the same
The main species contributing most to the manner as species richness (Table 1); should a
within-group similarity between sites, or dissim- sample from any site have 21 individuals in it,
ilarity between groups were determined using and the range in numbers of individuals
the Similarity Percentage Routine (SIMPER; throughout the survey region for any given
Clarke & Warwick 1994). The breakdown in sample be 21572, then such a site would be
SIMPER is based on BrayCurtis coefficient of
all pairs of samples within or between groups. Table 1 Classification of relative density and richness
To determine to what extent our sampling using a 7-point scale for all subtidal substratum
effort captured the total number of species types, eastern Waiheke Island.
throughout the survey region, species accumu-
lation curves were prepared using pooled bio- Density/richness (%) Density/richness score
logical data for all substrata throughout the B5 Very low
survey region, and separately for each substra- 510 Low
tum type (Fig. 2), using the ‘Species-Area plot’ 1125 Fairly low
in PRIMER. 2650 Medium
Our data set was subject to two final, 5175 Fairly high
somewhat unorthodox classifications. The first 7695 High
of these was to determine whether any pattern 96100 Very highSediment macrobenthos off eastern Waiheke Island 153
categorised as very low in density (21 being the Simpson dominance index (l) (Table 4,
0.1% of 1572). Both classifications may have Fig. 4). Community composition was also sig-
limited application outside of the survey area, nificantly different among substratum types
substratum (habitat) type or time during which (R 0.575 0.951, P 0.1%), with mud/gravel
this survey was undertaken. sites having species assemblages intermediate
between those of mud and gravel sites (Fig. 5).
Annelida (primarily Polychaeta) was the
Results
most species rich taxon in all substratum types;
Within the 228 sea-bed samples off eastern the number of polychaete taxa, in addition to
Waiheke Island, 326 taxa were identified. Of those of Mollusca and Arthropoda, increased
these, 168 occurred beneath the mussel farm with increased sediment complexity, from muds
and 307 outside of it. Numbers and ranges of to gravels (Table 5). Within muddy substrata,
individuals, taxa and degree of apparent local bivalves were proportionally most abundant,
endemism within our samples by substratum
whereas polychaetes were proportionally (not
type are detailed in Table 2. Only 31.6% of taxa
necessarily absolutely) most abundant in mud/
occurred in both muds and gravels, 40%
Downloaded by [144.76.86.22] at 16:30 25 July 2015
gravels and gravels (Table 6). The invasive
occurred in both muds and muddy gravels,
bivalve Theora lubrica was the most regularly
and 44.8% were common to both muddy
and abundantly occurring taxon in muddy
gravels and gravels.
samples throughout this region (Table 7). An
Wet-sieved grain-size data for the three
sediment samples collected from three represen- ostracod (Ostracod sp. 2), Nemertea, three
tative sites within each substratum type are polychaete species (Prionospio sp., Heteromastus
presented in Table 3 and Fig. 2. Species accu- filiformis and Sthenelais sp.) were the most
mulation curves for each of the substrata, and regularly and densely occurring taxa in mud/
for them all combined are presented in Fig. 3. gravels (Table 8). Within gravels, four poly-
The relationship between species dominance, chaetes (Heteromastus filiformis, Prionospio sp.,
substratum type and species richness is depicted spionid sp. 1 and Macroclymenella stewartensis)
in Fig. 4. and one bivalve, Notocorbula zelandica, were the
DIVERSE indices and community composi- most regularly and abundantly occurring taxa
tion both differ significantly among substrata (Table 9).
(ANOVA, P-value B0.05). Gravel samples, Taxa occurring in muds differed signifi-
followed by mud/gravel samples, had the cantly by depth (R 0.046 0.223, PB0.5%;
highest total number of individuals (n), Marga- Fig. 6), but no significant difference was
lef’s index of species richness (d), Pielou’s apparent in any DIVERSE index. ANOSIM
evenness index (J’), ShannonWiener diversity revealed assemblages of species from muddy
index (H’), but lowest Simpson dominance gravel sites only differed significantly between
index (l); mud substrata had the lowest value sites more shallow than 10 m and those deeper
for each DIVERSE index, with the exception of than 15 m (R 0.315, P 0.3%; Fig. 7), but
Table 2 Number of individuals and taxa per sample (0.0336 m2) in each substratum type.
# of # of Average individuals/ # of Taxa range/ Taxa endemic to
Substrata samples individuals sample taxa sample substrata
Mud 139 6805 49.0 142 241 36
Mud/ 32 2531 79.1 166 1153 25
gravel
Gravel 57 10,559 185.2 255 1869 106154 KLC Wong and S O’Shea
Table 3 Sediment grain size analyses by substratum
type.
Sorting
Substrata 825 850 875 coefficient
Mud
# of 3 3 3 Moderately to
samples moderately
Mean 4.13 4.97 5.93 well sorted
SD 0.38 0.15 0.45
Mud/gravel
# of 3 3 3 Very poorly
samples sorted Fig. 4 The relationship between species dominance
Mean 0.1 1.9 4.63 and richness, all substrata, eastern Waiheke Island.
SD 0.61 0.98 0.4
Gravel an existing mussel farm, in the deeper channels
Downloaded by [144.76.86.22] at 16:30 25 July 2015
# of 2 3 3 Poorly sorted between Waiheke Island and Pakatoa Island,
samples and between Rotoroa and Ponui Islands
Mean 1.15 0.1 2.07 (Fig. 9, left). When limiting analysis to relative
SD 0.49 0.95 0.67
species richness within muds, the most species-
rich sites are rather evenly distributed through-
again, DIVERSE indices were not significantly out the eastern Waiheke Island region, but
different between these depths. To the contrary, many occur inside and within the immediate
ANOSIM revealed species assemblages from vicinity of the northern side of the existing
gravel sites did not differ significantly between mussel farm (Fig. 9, right) * an area and
depths (Fig. 8), but one DIVERSE index,
substratum type subject to more intensive
Margalef’s index of species richness (d), was
sampling effort than elsewhere.
significantly different, being higher at depths
Those sites with the greatest density of
1015 m than depths B10 m (Table 4).
individuals proved to be beneath and in the
The most species-rich sites (relative to all
immediate vicinity of the existing mussel farm, in
sites throughout the survey region) prove to be
the deeper channels between Waiheke Island
those beneath and in the immediate vicinity of
and Pakatoa Island, and Rotoroa and Ponui
Island, and one site of relatively exceptional
spionid polychaete density north of Pakatoa
Island (Fig. 10, left). When limiting analysis
to density within muds only, those sites with
the greatest density of individuals are also
rather evenly distributed throughout the eastern
Waiheke Island region, but again many occur
inside and within the immediate vicinity of the
northern side of the existing mussel farm, at
depths exceeding 20 m north and northeast of
the mussel farm, and in the deeper parts of the
channel between Waiheke and Pakatoa Islands
(Fig. 10, right).
When analysis is limited to the presence
Fig. 3 Species accumulation curves, all substrata. or absence of taxa identified in all samples,Sediment macrobenthos off eastern Waiheke Island 155
Table 4 DIVERSE indices by substratum type and depth (mean9SD), square-root transformed data.
B10 m 1015 m 15 m Total
Mud
n 49.17944.53 39.85930.72 59.37978.71 48.96955.85
d 2.0990.82 2.0590.91 2.1191.06 2.0890.95
J’ 0.6290.21 0.6790.15 0.6190.13 0.6490.16
H’ 1.2890.51 1.3790.47 1.390.44 1.3290.47
l 0.4590.2 0.3990.17 0.4390.15 0.4290.17
Mud/
gravel
n 83.05956.65 63.67965.99 81.57958.38 79.09957.29
d 4.291.81 4.0391.42 5.6791.67 4.4991.78
J’ 0.6690.22 0.7890.24 0.8390.08 0.7290.21
H’ 1.8890.70 2.0490.65 2.6090.30 2.0790.67
l 0.3290.23 0.2490.22 0.1390.04 0.2790.21
Downloaded by [144.76.86.22] at 16:30 25 July 2015
Gravel
n 186.259208.01 176.67950.21 N/A 185.259197.15
d 6.1691.35 7.6092.74 N/A 6.3291.58
J’ 0.7390.11 0.7790.05 N/A 0.7390.11
H’ 2.5190.42 2.8090.42 N/A 2.5490.42
l 0.1790.11 0.1190.03 N/A 0.1690.11
Abbreviations: n, number of individuals; d, Margalef’s index of species richness; J’, Pielou’s eveness index; H’, Shannon
Wiener diversity index; l, Simpson dominance index.
two main clusters of species assemblages are used to characterise communities in the sche-
apparent, muds (right) and gravels (left), with mata depicted by Powell (1937) and Hayward
species assemblages occurring within muddy- et al. (1997), two main clusters of species
gravels occurring throughout both (Fig. 11); assemblages of muds (right) and gravels (left)
the cluster using full quantitative data (not are again apparent, but those sites of a muddy-
presented here) is even less clear. When limiting gravel nature similarly occur throughout both
analysis to presence or absence of molluscan (Fig. 12). When analysis is limited to the most
and echinoderm taxa, those two phyla largely intensively sampled substratum type, muds,
for which the species accumulation curve most
closely approximates an asymptote (Fig. 3),
it is especially obvious that recurring assem-
blages of species do not occur, in that no
two sites share the same assemblage of taxa
(Fig. 13).
Discussion
Potential changes in community structure
Benthic-invertebrate assemblages off eastern
Waiheke Island were attributed to one of two
formations by Powell (1937): a Venericardia
Fig. 5 Multi-dimensional scaling plot of species (now Purpurocardia) formation between Rotoroa
assemblages within three substrata. Island and Ponui Island, and off the156 KLC Wong and S O’Shea
Table 5 Breakdown of average similarity in taxon richness by substratum, to Phylum, square-root
transformed data.
Average # taxa Contribution (%) Cumulative contribution (%)
Mud (average similarity: 63.63)
Annelida 3.58 38.61 38.61
Arthropoda 2.92 37.53 76.15
Mollusca 1.31 18.71 94.86
Mud/gravel (average similarity: 64.73)
Annelida 10.06 53.45 53.45
Arthropoda 4.53 24.16 77.60
Mollusca 2.28 10.91 88.52
Echinodermata 1.34 8.37 96.88
Gravel (average similarity: 74.97)
Annelida 16.75 56.71 56.71
Mollusca 5.98 17.60 74.31
Arthropoda 6.05 16.95 91.26
Downloaded by [144.76.86.22] at 16:30 25 July 2015
eastern side of Ponui Island (Fig. 1), and an tories were provided, were also resampled
Echinocardium formation throughout most of (Powell’s J1, J6), both attributed to his
the rest of the region. Too few samples TaweraPurpurocardia formation between
were collected at sites falling within Powell’s Rotoroa and Ponui Islands. On the basis of recent
Purpurocardia (as Venericardia) formation in sampling, neither Tawera nor Purpurocardia
this current study to fully compare/contrast characterise species assemblages within gravels
with Powell’s earlier formations, although our in this region, although the small, thick-shelled
results show no recurring or widely distributed bivalve, Notocorbula zelandica, a species re-
community structures occur within areas at- corded from more than 95% of gravel samples,
tributed to this formation/association, or that does appear appropriate for this purpose
of his Echinocardium formation/association. (Table 9).
Only four of Powell’s (1937) nine sea-bed Excluding Powell’s unidentified poly-
stations off eastern Waiheke Island occur within chaetes, 32% (nine of 28 taxa, Table 10)
the area re-surveyed herein; for only two of reported by him from two of four sea-bed
Powell’s stations did he provide species inven- stations within formations for which he furn-
tories (Powell’s J3, J4); we have resampled only ished taxonomic inventories (Powell 1937:
one of these stations (J4). A further two sites 370384) were not re-identified during our
surveyed by Powell, for which no species inven- sampling. Two of Powell’s taxa were likely
Table 6 Breakdown of average similarity in taxon abundance by substratum to level of Class, and Phylum
Nemertea (average similarity of samples in parentheses).
SIMPER Muds (58.26%) Mud/gravels (50.37%) Gravels (66.4%)
Cumulative Bivalvia 41.85% Polychaeta 41.69% Polychaeta 42.74%
contribution (%) Ostracoda 64.79% Ostracoda 60.07% Bivalvia 62.09%
Polychaeta 86.58% Malacostraca 72.88% Malacostraca 74.00%
Malacostraca 96.44% Bivalvia 83.80% Gastropoda 81.61%
Ophiuroidea 90.23% Ostracoda 85.89%
Nemertea 89.18%
Ophiuroidea 92.31%Sediment macrobenthos off eastern Waiheke Island 157
Table 7 SIMPER results for muds, average similarity: 39.09, square-root transformed data.
Species Average abundance Contribution (%) Cumulative contribution (%)
Theora lubrica 4.05 50.12 50.12
Ostracod sp. 2 2.55 24.77 74.88
Prionospio sp. 0.84 4.73 79.62
Sthenelais sp. 0.51 3.28 82.90
Paraphoxus sp. 1 0.73 3.03 85.93
Cossura consimilis 0.51 2.86 88.79
Echinocardium cordatum 0.41 1.92 90.71
Table 8 SIMPER results for mud/gravels, average similarity: 22.09, square-root transformed data.
Downloaded by [144.76.86.22] at 16:30 25 July 2015
Species Average abundance Contribution (%) Cumulative contribution (%)
Ostracod sp. 2 3.30 21.72 21.72
Prionospio sp. 1.54 15.30 37.02
Heteromastus filiformis 2.14 9.38 46.40
Nemertea 0.77 4.83 51.23
Sthenelais sp. 0.52 4.23 55.46
Paraphoxus sp. 1 0.70 4.00 59.46
Amphiura rosea 0.65 3.42 62.88
Echinocardium cordatum 0.40 2.63 65.51
Theora lubrica 0.64 2.56 68.07
Aonides sp. 0.40 2.30 70.37
Trichobranchus sp. 0.39 1.86 72.22
Cirratulid sp. 1 0.36 1.52 73.75
Arabella sp. 0.36 1.47 75.21
Glycera tesselata 0.45 1.42 76.64
Macroclymenella 0.42 1.32 77.96
stewartensis
Ostracod sp. 1 0.33 1.24 79.19
Onuphis aucklandensis 0.32 1.11 80.30
Sphaerosyllis sp. 0.34 1.07 81.37
Spionid sp. 1 0.60 1.05 82.42
Leptochiton inquinatus 0.37 0.87 83.30
Cossura consimilis 0.26 0.83 84.12
Exogone sp. 0.33 0.82 84.94
Commensal polychaete 0.52 0.76 85.71
Amphicteis philippinarum 0.37 0.73 86.43
Armandia maculata 0.46 0.72 87.16
Phoronis psammophila 0.32 0.67 87.83
Terebellides stroemi 0.31 0.62 88.45
Nematoda 0.28 0.60 89.05
Notocorbula zelandica 0.27 0.59 89.64
Paraphoxus sp. 2 0.27 0.59 90.22158 KLC Wong and S O’Shea
Table 9 SIMPER results for gravels, average similarity: 38.16, square-root transformed data.
Species Average abundance Contribution (%) Cumulative contribution (%)
Heteromastus filiformis 5.03 17.08 17.08
Notocorbula zelandica 4.45 14.43 31.51
Prionospio sp. 2.24 7.41 38.91
Spionid sp. 1 2.87 6.20 45.11
Macroclymenella 1.45 3.97 49.08
stewartensis
Commensal polychaete 1.75 3.25 52.33
Terebellides stroemi 1.28 3.18 55.51
Nemertea 1.09 2.83 58.34
Oridia sp. 1.60 2.74 61.08
Paguristes setosus 1.83 2.47 63.54
Sphaerosyllis sp. 1.01 1.92 65.46
Amphicteis philippinarum 0.93 1.91 67.37
Downloaded by [144.76.86.22] at 16:30 25 July 2015
Trochodota dendyi 0.95 1.90 69.27
Ostracod sp. 2 0.97 1.85 71.12
Ophiodromus 0.81 1.70 72.82
angustifrons
Aonides sp. 0.82 1.56 74.38
Hydroides norvegicus 1.14 1.54 75.92
Ostracod sp. 1 0.67 1.39 77.31
Anomia trigonopsis 0.76 1.37 78.67
Armandia maculata 0.74 1.35 80.03
Leptochiton inquinatus 0.73 1.33 81.35
Glycera tesselata 0.62 1.21 82.56
Nematoda 0.63 1.15 83.71
Syllid sp. 10 0.68 1.14 84.85
Anthurid sp. 2 0.62 0.98 85.84
Maoricolpus roseus 0.67 0.92 86.76
Paraphoxus sp. 1 0.52 0.87 87.63
Glycinde sp. 0.64 0.86 88.48
Trichobranchus sp. 0.49 0.79 89.28
Amphiura aster 0.55 0.72 90.00
Exogone sp. 0.52 0.62 90.62
misidentified (Petrolisthes elongatus and Rangitoto Channel reported by Hayward et al.
Nectocarcinus antarcticus); Powell’s ‘small, (1997). Having been relatively recently recog-
pink holothurian’ was probably one of Ocnus nised from New Zealand waters, first recorded
brevidentis or, more likely, Trochodota dendyi, in 1971 (Climo 1976), this species has become
both of which occur throughout this region, widespread throughout Waitemata Harbour
the latter being more common. One notable and Hauraki Gulf; it was not recognised by
addition to the faunal inventory from this Powell in his surveys seven decades earlier
region is the establishment of the invasive (Powell 1979: 451).
bivalve taxon Theora lubrica; this species now Species assemblages occurring within muds
characterises well-sorted muddy sediments off differ markedly from those of gravels, but those
eastern Waiheke Island, in addition to those of muddy-gravels are somewhat transitional
muddy sediments in Waitemata Harbour and between the two (Figs. 11 and 12). Muds, muddySediment macrobenthos off eastern Waiheke Island 159
Downloaded by [144.76.86.22] at 16:30 25 July 2015
Fig. 6 Multi-dimensional scaling plot of species Fig. 8 Multi-dimensional scaling plot of species
assemblages within muds, grouped by depth (B10, assemblages within gravels, grouped by depth
1015, 15 m). (B10, 1015 m).
gravels and gravelly substrata are also patchily depict schematically the distributions of any
distributed throughout the eastern Waiheke communities throughout this region. The reality
Island region (Fig. 1). Because of this, and is that too few sites were sampled by Powell
because of the high level of dissimilarity in as- (1937) for him to have generalised sea-bed
semblage structure between the greatest major- communities throughout this region, and the
ity of samples throughout this region, regardless same may apply in our study (with a combined
of what transformation we subject our data to surface area of all grabs sampled being only
7.66 m2). An alternative, plausible argument
(Figs. 11 and 12), we do not recognise recurring,
(Gray 1981) is that discrete assemblages of
spatially discrete assemblages of species akin to
species do not exist, as the distributions of
those of Powell (1937) off eastern Waiheke
species overlap, with one community grading
Island. Accordingly, we make no attempt to
into another; alternatively, the scale of our
survey was too small, and the range of habitats
too limited for any discrete community types to
develop, although we consider this to be less
likely given the intensity of our sampling, the
range in substratum types experienced, and the
relatively large size of the survey area.
Assemblage structure
Although recurring assemblages do not occur
in the region, some relationships were apparent
in the composition of assemblages by sub-
stratum type. The moderately to moderately
Fig. 7 Multi-dimensional scaling plot of species well-sorted muds were characterised by bi-
assemblages within mud/gravels, grouped by depth valves, ostracods, polychaetes and amphipods;
(B10, 1015, 15 m). the very poorly sorted mud/gravel-dwelling160 KLC Wong and S O’Shea
Downloaded by [144.76.86.22] at 16:30 25 July 2015
Fig. 9 Spatial distribution of relative species richness, all substrata (left), muds (right).
in- and epifaunal species assemblages were shelf. Regardless of whether the individual
characterised by polychaetes, ostracods, am- substrata are classified as well sorted, moderately
phipods, bivalves and ophiuroids; and the well, poorly or very poorly sorted, when the
poorly sorted gravel-dwelling in- and epifaunal incidence of gravel is used as a proxy for
species assemblages were characterised by poly- increased structure or complexity, it is apparent
chaetes, bivalves, pagurid crabs, gastropods, that elevated diversities and densities of benthic
ostracods, ophiuroids and nemertean worms. invertebrate taxa are encountered (Table 2).
In this study, the higher numbers of taxa and These findings are consistent with those of
diversity in gravel samples could be related to the Dewas (2008) for sea-bed communities off Otata
poorly sorted nature of the substratum, with Island, Hauraki Gulf, where the density and
such structurally heterogeneous substrata pro- richness of benthic invertebrates in adjoining
viding more niche space, therefore elevating types of sea-bed, complex valves of the bivalve
diversity (Gray 1981); conversely, the well- Tucetona laticostata interspersed with rhodo-
sorted, structurally homogeneous muds had the liths, and less-structured and extensively frag-
least diverse communities (Figs. 1 and 9). How- mented coarse sands, were greater in the former.
ever, this relationship is not without exception; Of the 326 taxa recorded from the 228 grab
for example, Ellingsen & Gray (2002) discerned samples throughout this region, 142 taxa were
no relationship between species richness and identified from 139 muddy sites, 166 taxa from
sediment properties (sorting coefficient and 32 muddy gravel sites, and 255 taxa from 57
percentage of silt) on the Norwegian continental gravel sites; less than 50% of the taxa wereSediment macrobenthos off eastern Waiheke Island 161
Downloaded by [144.76.86.22] at 16:30 25 July 2015
Fig. 10 Spatial distribution of relative species density, all substrata (left), muds (right).
common to any two of these substratum types, As species richness increased, concomitant
rendering the assemblages of each substratum with an increase in substratum complexity,
unique. In fact, no two grab samples had the there also was a tendency for dominance of
exact same complement of taxa either (Fig. 11), taxa to decrease (Fig. 4, Tables 79). This
effectively rendering each surveyed site unique. relationship is more typical of terrestrial sys-
None of the species accumulation curves pre- tems (e.g. Odum 1971; Hill 1973) than marine
pared for individual substrata reached an asy- systems, with Birch (1981) recognising an
mptote, although that for muds most closely inverse relationship between dominance and
did; it is apparent that many additional taxa species richness in the marine environment,
occur within each substratum type in this region, and Gray (2002) recognising no relationship
particularly within the coarser substrata, and on between these two at all.
the basis of monitoring exercises throughout During the survey period, February 2008,
this region, seasonally also (Wong 2009). little variation was apparent in the distribution
Although none of these accumulation curves of species richness throughout the eastern
reached an asymptote, this could be typical of Waiheke Island region, but density was more
marine benthic-community studies (Gray 2002). variable. Muds and mud/gravel substrata had
A major factor contributing to this in our study minimum and maximum densities of individuals
is the relative rarity of species throughout the of 119 m-2 and 17,440 m-2, and 238 m-2 and
survey region, with almost one third of taxa (109 6905 m-2 respectively (with mean densities
taxa) recorded from a single site only. of 1458 m-2 and 2351 m-2, respectively); the162 KLC Wong and S O’Shea
Downloaded by [144.76.86.22] at 16:30 25 July 2015
Fig. 11 Dendrogram of similarity in faunal composition of all sites (n 228), all substratum types, eastern
Waiheke Island, using presence/absence data.
greatest density of individuals throughout this herein); muds off eastern Waiheke Island
region was encountered in gravels, with mini- (17,440 m-2; herein); muddy gravels off eastern
mum and maximum densities of 1339 m-2 and Waiheke Island (6905 m-2; herein); muds off
46,786 m-2, of mean density 5512 m-2. The value eastern Motutapu Island (maximum densities
of the density schema used herein is that it 5832 m-2; Dewas 2008); undefined substrata
enables a comparison of the relative densities of (potentially all of muds, mud/gravels and grav-
individuals in sea-bed samples throughout els) in Rangitoto Channel (maximum density
Hauraki Gulf, at least for those limited loca- 4440 m-2; Roberts 1990); muds off eastern
tions, Motutapu Island (mean density 1797 m-2;
dates and depths that have been surveyed Dewas 2008); and muds proximal to the mussel
in a quantitative manner. Because of non- farm in the Firth of Thames (mean density
standardised sampling volumes or surface areas, 115.5 m-2 outside and 84 m-2 inside a mussel
available density data have had to be standar- farm, de Jong 1994).
dised to number of individuals per m2 to enable The density scale proposed for off eastern
some comparison to be made; we do realise Waiheke Island obviously will vary spatially,
the limitations in this approach, especially given and temporally given both Dewas (2008) and
the total sea-bed area sampled in this study was Wong (2009) report greatest densities of indi-
7.66 m2 only. To date, those areas throughout viduals in samples surveyed during mid-winter.
Hauraki Gulf with the greatest densities of Accordingly, this classification must be used
individuals, in decreasing order, occur off Otata with some caution when extrapolating to other
Island in Tucetona/rhodolith-based shell gravels areas throughout Hauraki Gulf, and obviously
(142,385 m-2; Dewas 2008); eastern Waiheke would not apply for the sea-bed off Otata
Island in shell gravels (with limited Tucetona Island, the most dense and species rich area
and no rhodoliths, 46,786 m-2; data reported thus-far recognised in Hauraki Gulf. OtherSediment macrobenthos off eastern Waiheke Island 163
Downloaded by [144.76.86.22] at 16:30 25 July 2015
Fig. 12 Dendrogram of similarity in molluscan and echinoderm taxa (n 228), all sites, all substratum types,
eastern Waiheke Island, using presence/absence data.
quantitative studies throughout the region are Those sites within 80 m of the boundary
lacking, or data are not presented in a manner of the existing mussel farm, and within the
enabling direct comparison. farm itself had the greatest densities of indivi-
duals per sample, and those to the north of
Fig. 13 Dendrogram of similarity in faunal composition of all sites, muddy substrata (n 139), eastern
Waiheke Island, using presence/absence data.164 KLC Wong and S O’Shea
Table 10 Nomenclature of taxa reported by Powell (1937) and this study.
Powell (1937) Current study
Tawera spissa Tawera spissa
Venericardia purpurata Purpurocardia purpurata
Cominella quoyana Cominella quoyana
Cominella adspersa Cominella adspersa
Nectocarcinus antarcticus Liocarcinus corrugatus (possibly misidentified by
Powell)
Trochus tiaratus Trochus tiaratus
Zegalerus tenuis Zegalerus tenuis
Petrolisthes elongatus Petrolisthes novaezelandiae, or Petrocheles spinosus
Cirostrema zelebori Not found
Proxiuber australis Proxiuber australe
Rhyssoplax stangeri Rhyssoplax stangeri
Zemysia zelandica Felaniella zelandica
Downloaded by [144.76.86.22] at 16:30 25 July 2015
Epitonium jukesianum Not found
Holothuria (small, pink) Probably Ocnus brevidentis or Trochodota dendyi
Trachelochismus pinnulatus Not found
Terenochiton inquinatus Leptochiton inquinatus
Marginella pygmaea Not found
Condylocardia concentrica Not found
Condylocardia crassicosta Not found
Notosetia micans Not found
Estea minor Rissoidae
Notoacmaea subtilis Not found
Zemitrella choava Not found
Echinocardium cordatum Echinocardium cordatum
Dosinia lambata Dosinia lambata
Amphiura rosea Amphiura rosea
Neilo australis Neilo australis
Polychaetes (not ident.) Many taxa
Cadulus delicatulus Cadulus delicatulus
the farm, and northeast and south of the farm out this information, no party is in any
in deeper waters, had the least numbers of position to make informed decisions on the
individuals per sample. On the basis of species relative merits of any area for conservation,
richness and density of benthic invertebrates development, or, and topical at present, har-
throughout the region (Figs. 9 and 10), the bour spoil disposal. Despite this, each activity
mussel farm would not appear to be having any is routinely called for or undertaken in Haur-
demonstrable negative or large-scale effect aki Gulf. There is a compelling case for
on either. The results of temporal monitoring ongoing surveys to determine present-day
of sea-bed communities beneath and at pro- patterns in the geographic and temporal dis-
gressively increasing distances from this mussel tribution and density of species, augmented
farm will be reported separately. with more systematic research to identify
The lack of knowledge on the distribution many currently problematic taxa. This infor-
and composition of sea-bed communities mation is largely absent and urgently required
throughout Hauraki Gulf is lamentable. With- by agencies to ensure sustainable managementSediment macrobenthos off eastern Waiheke Island 165
of Hauraki Gulf marine resources (HGF lished M.App.Sc. thesis, Auckland University of
2008). Technology.
de Jong RJ 1994. The effects of mussel farming on
the benthic environment. Unpublished M.Sc.
Acknowledgements thesis, University of Auckland.
Ellingsen KE, Gray JS 2002. Spatial patterns of
We wish to acknowledge all staff and students in the benthic diversity*is there a latitudinal gradient
Earth and Oceanic Sciences Research Institute, and along the Norwegian continental shelf? Journal
School of Applied Sciences at Auckland University of Animal Ecology 71: 373389.
of Technology that assisted in data collection. Gray JS 1981. The ecology of marine sediments. An
Special thanks are due to Emma Beatson for introduction to the structure and function of
skippering the AUT vessel Taniwha, and Drs Lindsey benthic communities. Cambridge, Cambridge
White, AUT, Martin Cryer (New Zealand Ministry University Press.
of Fisheries) and one anonymous referee for their Gray JS 2002. Species richness of marine soft
constructive comments on an earlier draft of this sediments. Marine Ecology Progress Series
manuscript. Funding for this study was provided by 224: 285297.
the Earth & Oceanic Sciences Research Institute, and Hayward BW, Stephenson AB, Morley M, Riley
School of Applied Sciences, Auckland University of JL, Grenfell HG 1997. Faunal changes in
Downloaded by [144.76.86.22] at 16:30 25 July 2015
Technology. Waitemata Harbour sediments, 1930s1990s.
Journal of the Royal Society of New Zealand
27: 120.
References HGF 2008. Tikapa Moana * Hauraki Gulf state of
the environment report. Hauraki Gulf Forum.
Birch DW 1981. Dominance in marine ecosystems.
Auckland Regional Council.
The American Naturalist 118: 262274.
Hill MO 1973. Diversity and evenness: a unifying
Clarke KR, Green RH 1988. Statistical design and
notation and its consequences. Ecology 54:
analysis for a ‘biological effects’ study. Marine
Ecology Progress Series 46: 213226. 427432.
Clarke KR, Gorley RN 2006. PRIMER v6: User Odum EP 1971. Fundamentals of ecology. Saunders.
manual/tutorial. PRIMER-E Ltd, Plymouth. Powell AWB 1937. Animal communities of the sea-
Clarke KR, Warwick RM 1994. Change in marine bottom in Auckland and Manukau Harbours.
communities: an approach to statistical analysis Transactions and Proceedings of the Royal
and interpretation. Plymouth Marine Labora- Society of New Zealand 66: 354401.
tory, Natural Environment Research Council. Powell AWB 1979. New Zealand Mollusca: marine,
Climo FM 1976. The occurrence of Theora land and freshwater shells. Collins.
(Endopleura) lubrica Gould, 1861 (Mollusca: Roberts RD 1990. Impact of dredge spoil at sea.
Bivalvia: Semelidae) in New Zealand. Auckland Unpublished M.Sc. thesis, University of
Institute and Museum Conchology Section Auckland.
Bulletin 1: 1116. Wong KLC 2009. The effects of green shelled mussel
Dewas SEA 2008. Benthic-invertebrate diversity mariculture on benthic communities in Hauraki
of Tucetona laticostata (Mollusca: Bivalvia) Gulf. Unpublished M.App.Sc. thesis, Auckland
biogenic substrata in Hauraki Gulf. Unpub- University of Technology.You can also read