ALMA reveals a large structured disk and nested rotating outflows in DG Tauri B - Astronomy & Astrophysics
←
→
Page content transcription
If your browser does not render page correctly, please read the page content below
A&A 634, L12 (2020)
https://doi.org/10.1051/0004-6361/201936950                                                                                                               Astronomy
c A. de Valon et al. 2020                                                                                                                                  &
                                                                                                                                                          Astrophysics

                                                                          LETTER TO THE EDITOR

ALMA reveals a large structured disk and nested rotating outflows
                          in DG Tauri B
                   A. de Valon1 , C. Dougados1 , S. Cabrit2,1 , F. Louvet3 , L. A. Zapata4 , and D. Mardones3

      1
          Univ. Grenoble Alpes, CNRS, IPAG, 38000 Grenoble, France
          e-mail: alois.de-valon@univ-grenoble-alpes.fr
      2
          PSL University, Sorbonne Université, Observatoire de Paris, LERMA, CNRS UMR 8112, 75014 Paris, France
      3
          Departamento de Astronomía de Chile, Universidad de Chile, Santiago, Chile
      4
          Instituto de Radioastronomía y Astrofíica, Universidad Nacional Autónoma de México, PO Box 3-72, 58090 Morelia,
          Michoacán, Mexico

     Received 18 October 2019 / Accepted 15 January 2020

                                                                                     ABSTRACT

     We present Atacama Large Millimeter Array (ALMA) Band 6 observations at 14−20 au spatial resolution of the disk and CO(2-1)
     outflow around the Class I protostar DG Tau B in Taurus. The disk is very large, both in dust continuum (Reff,95% = 174 au) and CO
     (RCO = 700 au). It shows Keplerian rotation around a 1.1 ± 0.2 M central star and two dust emission bumps at r = 62 and 135 au. These
     results confirm that large structured disks can form at an early stage where residual infall is still ongoing. The redshifted CO outflow at
     high velocity shows a striking hollow cone morphology out to 3000 au with a shear-like velocity structure within the cone walls. These
     walls coincide with the scattered light cavity, and they appear to be rooted within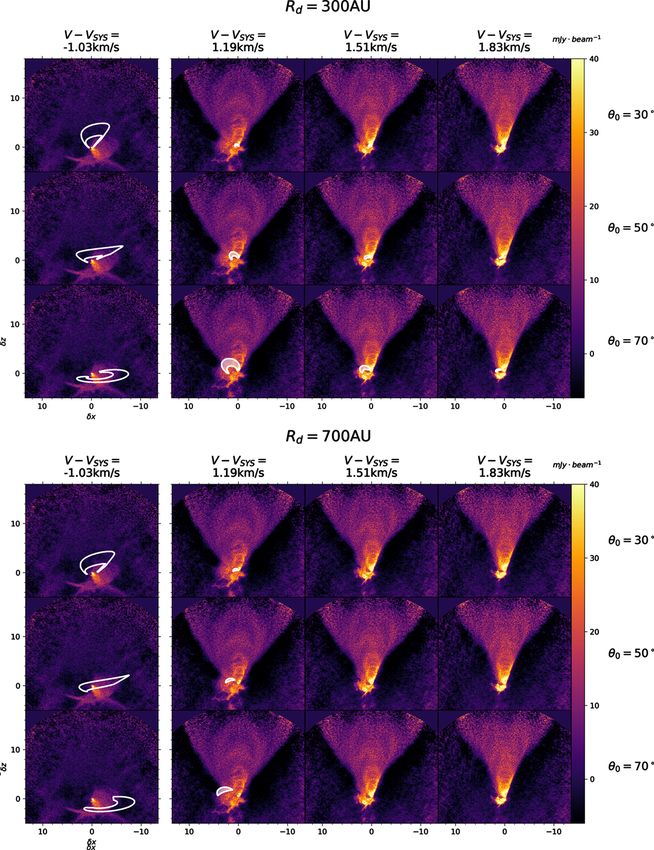
A&A 634, L12 (2020)

Fig. 1. (a) Continuum map at 232 GHz in logarithmic scale. White dotted contours show the 5, 10, 30, and 200σ levels (σ = 50 µJy beam−1 ). The
white dashed line shows the disk major axis at PA = 25.7◦ . (b) Continuum intensity profiles: cut along PA = 25.7◦ (in black) and deprojected and
azimuthally averaged (in red). The tapered power law central component and the two Gaussian components, derived from the fitting and before
beam convolution, are shown in blue dashed and dotted lines, respectively. Bottom panel: fit residuals and ±5σ limit (dotted lines). (c) Position-
velocity diagram in 13 CO along PA = 25.7◦ in a pseudo-slit of 400 width. The 3σ contour is shown in black. The curves show maximum expected
line-of-sight velocities Vmax for three different models: a thin disk in Keplerian rotation around M? = 1.1 M at an inclination of i = 63◦ (red
dashed line), pure rotation with constant angular momentum Vmax ∝ 1/r (blue dotted line), and a rotating and infalling bipolar shell (see Sect. 3.2.2)
with Rd = 300 au, θ0 = 70◦ at an inclination of i = 63◦ (green solid line).

DG tau B disk and outflow, which increase the angular resolution            deconvolution was achieved by the CASA tclean procedure
by more than a factor of 10 with respect to the previous study of           using the Hogbom algorithm and Briggs weighting scheme with
Zapata et al. (2015). In Sect. 2 we describe the observations and           a robust parameter of −1 for the continuum data and 0.5 for the
data reduction. In Sect. 3 we present new results revealing a large         CO. The resulting continuum emission map has a synthesized
and structured disk as well as a rotating outer wide angle com-             beam of 0.0700 × 0.1100 with a root mean square (rms) noise of
ponent, surrounding the inner conical flow. In Sect. 4 we discuss           50 µJy beam−1 . The final 12 CO(2-1) datacube has a synthesized
new implications for the origin of disk structure and small-scale           beam of 0.1300 × 0.1800 with an rms noise of 2 mJy beam−1 per
conical CO outflows.                                                        0.3 km s−1 spectral channel. For the more compact 13 CO(2-1)
                                                                            and C18 O(2-1) emission, we used the pipeline reduced datacubes
                                                                            from the compact C36-2/3 and intermediate C40-5 configura-
2. Observations and data reduction                                          tions, with resulting beams of 0.9700 × 0.7800 and 0.2300 × 0.3400 ,
                                                                            respectively, and rms noise per 0.3 km s−1 spectral channel of 6
DG Tau B was observed in band 6 during ALMA Cycles 3                        and 5 mJy beam−1 , respectively. Our largest recoverable scale is
and 5 with three 12 m array configurations covering a baseline              1100 .
range of 11–6500 kλ (15–8500 m). The details of the observa-
tions are presented in Table A.1. The spectral set-up was sim-
ilar for each observation and included three spectral windows
centered on the 12 CO(2-1), 13 CO(2-1), and C18 O(2-1) emis-                3. Results and analysis
sion lines, each with a native spectral resolution of 122 kHz,              3.1. A large and structured disk
which we rebinned to 244 kHz (≈0.3 km s−1 ) to improve sen-
sitivity. An additional spectral window with 2 GHz bandwidth                Figure 1a shows the 230 GHz continuum image. The continuum
centered at '232 GHz was used to map the continuum. The                     emission is elliptical and centrally peaked, indicating a domi-
three configurations were entirely reprocessed and combined                 nant contribution from the circumstellar disk. The peak intensity
both in continuum and 12 CO to improve the signal-to-noise ratio            is 26 mJy beam−1 (80 K) and the integrated intensity is 430 ±
(S/N) and the quality of the data as well as to greatly reduce              30 mJy. The difference with Zapata et al. (2015) (590 ± 30 mJy)
the residual sidelobes in the final cleaned images. Data cal-               and Guilloteau et al. (2011) (531 mJy) is within the calibra-
ibration was performed using the Common Astronomy Soft-                     tion uncertainties of 20%. We fit an elliptical Gaussian with
ware Application (CASA, see McMullin et al. 2007) version                   the CASA function IMFIT to derive a position axis (PA) of
4.5.3 for Cycle 3 observations and 5.1.1 for the Cycle 5 obser-             25.7 ± 0.3◦ for the disk major axis, which is consistent with the
vations. Flux calibrators were manually checked and the flux                previous determinations of 24 ± 1◦ by Guilloteau et al. (2011)
calibration uncertainty was estimated to be 20%. For each indi-             and 30 ± 5◦ by Zapata et al. (2015). Assuming that the disk
vidual exposure, phase self-calibration was computed on the                 is axisymetric and that the millimetric continuum emission is
high signal-to-noise continuum and applied to both the contin-              mainly located in the midplane, we also derived the disk axis
uum and 12 CO data. The Cycle 5 continuum peak (centered                    inclination to the line of sight at i = 63◦ ± 2◦ , which is consistent
at αJ2000 : 04h 27m 02s.573, δJ2000 : +26◦ 050 3000. 170) was defined       with the estimate of 64◦ ± 2◦ by Guilloteau et al. (2011).
as a phase reference. Relative phase shifts between all dif-                     Figure 1b shows the intensity profile of the continuum along
ferent exposures from the three configurations were automati-               the disk major axis. The effective radius encompassingR          95%
cally corrected by the self-calibration procedure. Final calibrated         of the deprojected continuum flux distribution Iν (r)2πrdr is
data sets from the three different configurations were combined             Reff,95% = 1.2400 = 174 au. The profile shows a centrally peaked
with their default weights. Before combination, we checked                  component with two symmetrical emission bumps. The depro-
that the average weights of each data set were similar. Joint               jected and azimuthally averaged radial profile (dashed red line
L12, page 2 of 11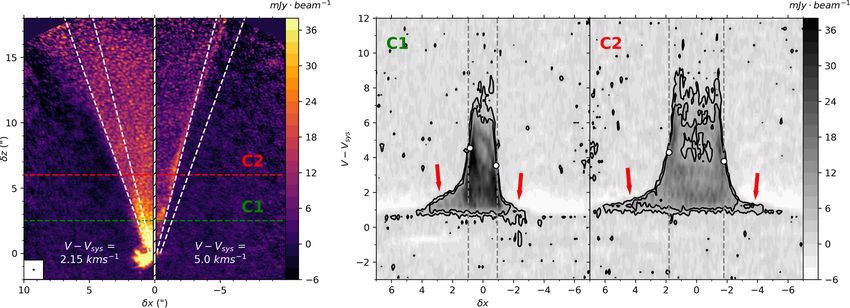
A. de Valon et al.: ALMA observations of DG Tauri B disk and CO outflow
Table 1. Best fit parameters to the disk continuum emission profile.
Main profile Inner ring Outer ring
A rt γ β B1 R1 σ1 B2 R2 σ2
(mJy beam−1 ) (AU) (mJy beam−1 ) (AU) (AU) (mJy beam−1 ) (AU) (AU)
30 ± 1 18 ± 1 0.07 ± 0.02 0.7 ± 0.2 1.5 ± 0.1 62.3 ± 0.5 4.7 ± 0.5 0.4 ± 0.02 135 ± 1 22 ± 1
in Fig. 1b) shows that this feature is axisymmetric, albeit with
a lower contrast due to the large inclination of the system. We
follow the modeling approach developed by Long et al. (2018)
for similar intensity profiles in Class II disks. We fit the inten-
sity profile with an exponentially tapered power-law for the cen-
tral component and two Gaussian components for the emission
bumps (see Appendix A for details). The best fit components are
shown in Fig. 1b together with the fit residuals; the parameters
are given in Table 1. The derived model radial intensity profile
(before beam convolution) is shown in Fig. A.1. The possible
origins of the observed structures are discussed in Sect. 4.1.
Figures B.1 and B.2 present channel maps in 13 CO and C18 O.
They exhibit the characteristic “double loop” pattern and trace
the upper and lower surfaces of disks in Keplerian rotation, as in
IM Lupi (Pinte et al. 2018), for example. The C18 O emitting lay-
ers appear to be at z/r ' 0.3, which is similar to IM Lupi. A con-
tribution from the redshifted outflow is also observed in 13 CO at
δz < 500 and for (V − Vsys ) ≤ 2.5 km s−1 (see Fig. B.1). Figure 1c
shows the 13 CO position-velocity (PV) diagram perpendicular
to the flow axis, averaged over −200 < δz < 200 to increase the
S/N. We also show maximal projected velocities expected for
a disk in Keplerian rotation as well as a rotating infalling shell Fig. 2. Summary of the various 12 CO(2-1) kinematical compo-
model (see Sect. 3.2.2 for more details on this model). The kine- nents in DG Tau B: the inner conical flow (integrated from (V −
matics are clearly best fit by Keplerian rotation out to r = 500 . Vsys ) = +2.15 to +8 km s−1 ) is shown in purple to yellow shades (floor
However, faint redshifted emission is also seen at −200 < δx < 0 at 26 mJy beam−1 km s−1 ). The individual low-velocity 12 CO(2-1) chan-
(the wrong direction for rotation), requiring residual infall on the nel maps at (V − Vsys ) = 1.19 km s−1 (resp. −1.03 km s−1 ) are shown in
front side of the disk (see green curve in Fig. 1c). The fact that red (resp. blue) shades (floor at 3σ with σ = 2 mJy beam−1 ). Inside the
we do not see a symmetric infall signature at negative veloci- white contours, the 13 CO(2-1) channel maps are shown at (V − Vsys ) =
ties and δx > 0 may come from asymetrical infall as seen, for 1.45 km s−1 in red and (V − Vsys ) = −1.55 km s−1 in blue, highlighting
example, in L1489-IRS by Yen et al. (2014). We thus concen- the upper and lower disk surfaces (floor at 3σ with σ = 5 mJy beam−1 ).
trate on the blue wing of the PV diagram, which is less affected
by outflow contributions. It shows a clear Keplerian profile out
to r = 500 , corresponding to a disk radius of RCO = 700 au. The clear whether these two kinematical components trace two phys-
same disk size is indicated in 12 CO (Fig. 2). We estimated the ically distinct mechanisms, we discuss their specific properties
stellar mass by using the model of a thin disk in Keplerian rota- separately below.
tion. With an inclination i = 63◦ , the best fit to the 3σ contour of
the 13 CO PV diagram is found for a systemic local standard of
rest (LSR) velocity Vsys = 6.35 ± 0.05 km s−1 and a stellar mass 3.2.1. Inner rotating conical flow at (V − Vsys ) > 2 km s−1
M? = 1.1 ± 0.2 M . This is the most accurate determination so The channel maps presented in Fig. 3 illustrate the conical mor-
far of the protostellar mass for DG Tau B. phology of the emission at δz ≤ 1000 and at (V − Vsys ) = 2
and 5 km s−1 and they show a decreasing opening angle with
3.2. 12
CO redshifted lobe: Nested rotating outflows an increasing line-of-sight velocity. The outer cone is defined
from the channel map at 2.15 km s−1 , which corresponds to the
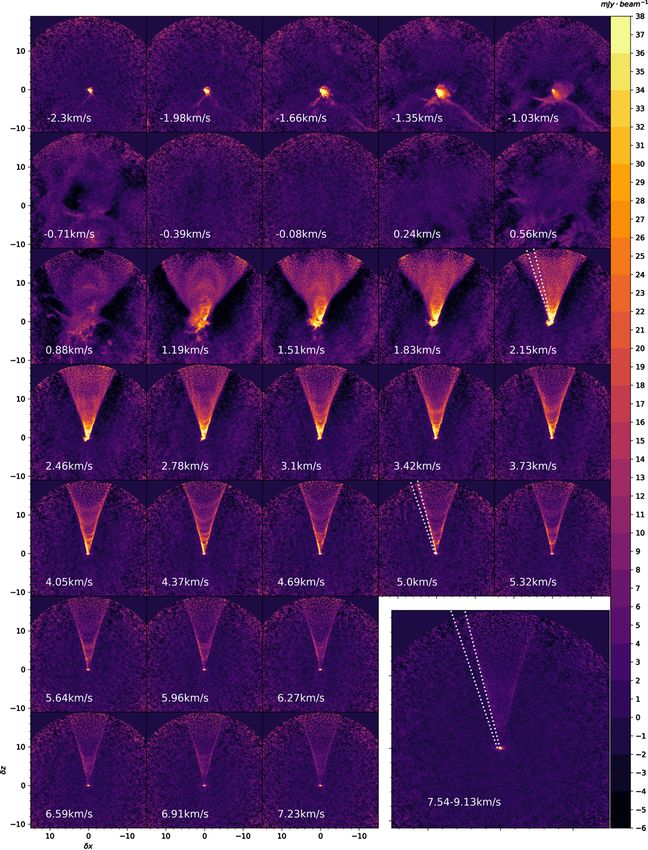
Figure 2 illustrates the change in morphology of the CO red- lowest velocity channel where the conical component dominates
shifted lobe emission as a function of velocity. Individual chan- the emission until δz ≈ 1000 . The derived outer semi-opening
nel maps are shown in Fig. B.3. At large velocities (V − Vsys = angle of '18◦ strikingly coincides with the opening of the near-
2−8 km s−1 ), channel maps show a striking limb-brightened con- infrared (NIR) scattered light cavity observed by Padgett et al.
ical morphology with an almost constant opening angle out (1999). Figure 3 shows that the cone opening angle decreases
to at least z = 1000 = 1400 au. At lower velocities (V − Vsys = to 12◦ at (V − Vsys ) = 5.0 km s−1 , and Fig. B.3 shows that it
1.2−1.8 km s−1 ), a wider, thicker, nonconical component dom- stays constant at higher velocities. This strong velocity stratifi-
inates the emission. The transition in morphology between low cation and hollow cone geometry is confirmed by the shape of
and mid-high velocities can also be observed on the transverse the transverse PV diagrams, which were constructed by posi-
PV diagrams in Fig. 3 where the slope of the velocity gradient tioning a pseudo-slit perpendicular to the flow axis (right panels
steepens at around V − Vsys ' 2−2.5 km s−1 . Although it is not of Fig. 3). The outer contours of the PV diagrams decrease in
L12, page 3 of 11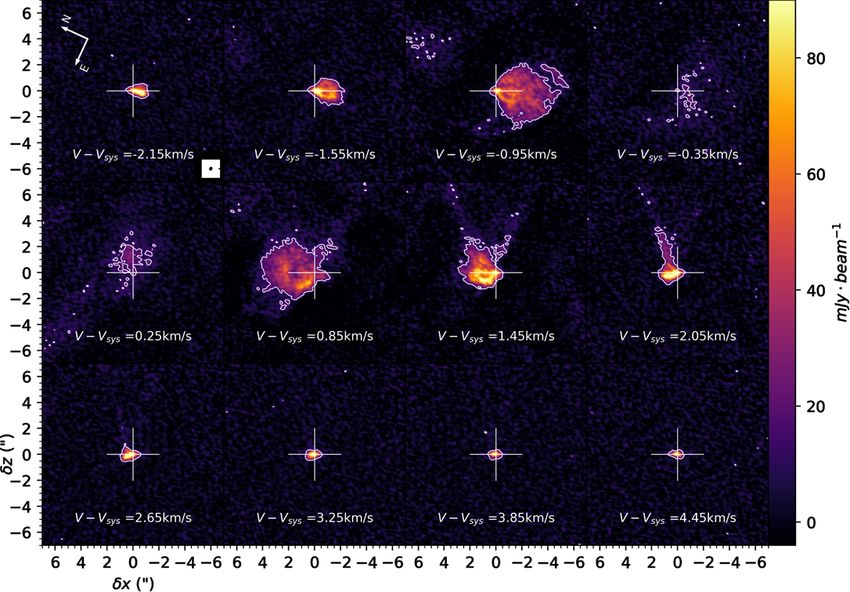
A&A 634, L12 (2020)

Fig. 3. Left panel: 12 CO channel maps at (V − Vsys ) = 2.15 km s−1 and (V − Vsys ) = 5.00 km s−1 . The two white dashed lines trace the outer and
inner cones (see text). Only one side of the outflow is shown in each of the two channel maps. The color scale is the same for the two channel
maps. Right panel: transverse PV diagrams at δz = 2.500 and δz = 600 obtained along the C1 and C2 cuts shown on the channel maps and averaged
on a slice of ∆z = 0.200 . The black contours trace the 2σ and 5σ levels. The two white points represent the symmetric edges of the PV diagrams at
δx = ±0.8500 and δx = ±1.800 , respectively. Their velocity difference gives an estimate of the rotation velocity (see text).

radii with increasing projected velocities, and then they become          3.2.2. Outer low-velocity wide-angle outflow
almost vertical at the highest velocities (V − Vsys ) ≥ 5 km s−1 ,
defining a limiting inner cone. Because the velocity gradient in          Our ALMA maps reveal that the inner conical outflow is nested
the conical component is limited to a rather thin shell and narrow        inside a wider component (R ≈ 1000 at Z = 1500 ) observed at low
range of angles, this suggests a “shear-like” velocity structure          redshifted velocities (V − Vsys = 1−2 km s−1 ). This structure is
within the cone walls with faster material on the internal side.          shown in Figs. 2 and 4 and can also be seen on transverse PV
    By extrapolating the conical morphology fit by the naked eye          diagrams in the form of an extended pedestal with a shallower
to the channel maps of Fig. 3 at δz < 1000 , we derived upper             V(r) slope at (V − Vsys ) ≤ 2 km s−1 (red arrows on Fig. 3). An
limits to the anchoring radii in the range of 10 to 60 au for the         important part of the 12 CO emission from this component falls
inner and outer cone, respectively. No important dynamical or             at velocities (V − Vsys ) ≤ 1 km s−1 where it is absorbed by the
structural changes are observed along the outflow cone over its           surrounding medium or resolved out by ALMA. Contrary to the
extent, except for a small increase in the opening angle at δz >          conical outflow, the wide and slow component shows a parabolic
1000 , suggesting a quasi steady-state flow.                              morphology that shifts away from the source along the outflow
    The PV cuts also reveal a systematic velocity difference              axis as the line-of-sight velocity increases for (V − Vsys ) = 1.2
between symmetric positions at ±r from the flow axis, espe-               to 1.8 km s−1 (see Fig. 4). Discrete loops are also observed in the
cially at low heights above the disk (see white circles in Fig. 3).       channel maps, suggesting time variability and contributions from
Assuming axi-symmetry, this difference can only be due to                 different layers inside this region. A strong transverse asymme-
rotation. We thus confirm the finding of Zapata et al. (2015)             try of the redshifted emission can be observed, for instance, at
that the conical redshifted outflow component rotates coher-              (V − Vsys ) = +1.2 km s−1 , namely; the emission at a given height
ently with altitude and in the same direction as the disk. We             is more extended toward δx > 0 than δx < 0. Transverse PV
observe a velocity shift ∆V = 1.0 km s−1 at z = 2.500 at a radius of      cuts in Fig. 3 show that this is due to a global “skew” across the
r = 0.8500 (=120 au), indicating a typical specific angular momen-        low-velocity pedestal, in the sense that emission at positive δx is
tum of '65 au km s−1 for VZ ≈ 9 km s−1 . A similar value is found         shifted slightly further into the red compared to symmetric neg-
at other positions along the cone (Fig. 3).                               ative δx where it is strongly absorbed. This skew is indicative of
    Assuming a steady flow, the mass flux along the conical               rotation in the same direction as the disk (and the inner conical
structure is estimated from (V − Vsys ) = 2.15 to 8 km s−1 at             flow), but because of absorption by the ambient cloud, it cannot
Ṁ = 1.7−2.9 × 10⁻⁷ M yr−1 depending on the opacity hypoth-               be easily quantified.
esis (see Appendix C for more details). The derived mass flux is              In Fig. 4, we compare the morphology and kinematics of this
35 ± 10 times larger than the mass flux of the receding atomic jet        wide-angle component with analytical predictions for an axisy-
of 6.4 × 10⁻⁹ M yr−1 estimated by Podio et al. (2011), making it          metric rotating shell falling ballistically onto the northwest sur-
of the same order as the mass accretion rate onto the star if a stan-     face of the disk around a central point mass of 1.1 M using the
dard ejection/accretion ratio of 0.01–0.1 (Hartigan et al. 1994) is       dynamics and structure computed by Ulrich (1976) (see details
adopted for the atomic jet. On the other hand, the linear momen-          in Appendix D). Although the model is idealized, it allows one
tum flux for the inner CO conical outflow is on the same order            to visualize the key 3D projection effects expected at i = 63◦
of magnitude as that of the jet (two to four times higher depend-         in such a geometry. The predicted locus of the shell in each
ing on the opacity hypothesis). Similar results were found in the         channel map is shown as white contours, for a centrifugal radius
smaller conical outflow of HH30 (Louvet et al. 2018) and in the           Rd = 700 au and an initial polar angle from the disk axis θ0 = 70◦ .
inner molecular outflow shells of the Class 0/I source HH46-47            The effect of varying Rd and θ0 is illustrated in Fig. D.1. No com-
(Zhang et al. 2019).                                                      bination of infall parameters Rd and θ0 can reproduce both the

L12, page 4 of 11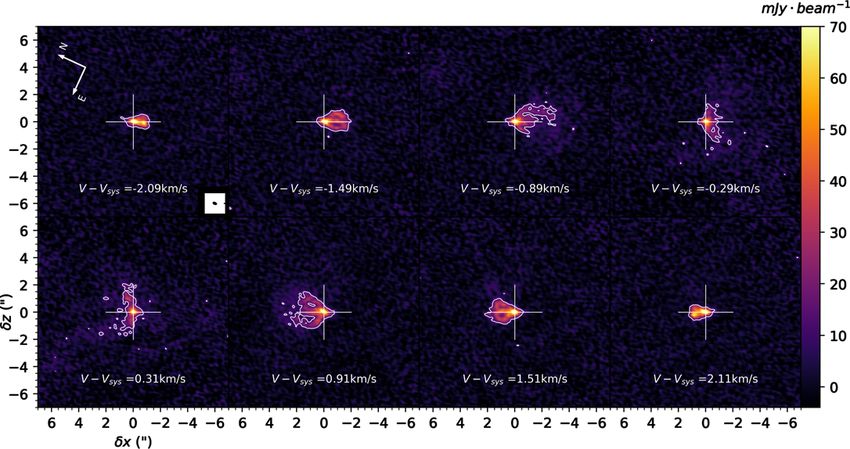
A. de Valon et al.: ALMA observations of DG Tauri B disk and CO outflow

Fig. 4. 12 CO individual channel maps at different line-of-sight velocities. The gray filled white contours trace the model of an infalling shell with
rd = 700 au and θ0 = 70◦ . The contours are not filled when the emission is arising from the back side of the infalling shell. The contour of the slow
wide-angle component is indicated by the white dashed line. The color scale is the same for all the channel maps.

large extent and the apparent acceleration of the wide redshifted           et al. 2016; Harsono et al. 2018) and GY 91 (Sheehan & Eisner
component. The match would be even worse if infall is slown                 2018). All three disks show bumps and dips with low contrast
down by pressure gradients, as in the Class I source TMC1A                  compared to the main emission profile.
(Aso et al. 2015). The only feature indicative of infall in the                  In the model continuum intensity profile of DG Tau B, we
receding lobe of the system is the blueshifted arc opening toward           see a depression preceding the first emission bump (Fig. A.1)
the northwest from z ' −2.200 , which is suggestive of the back             that might trace the possible signature of a gap. Following the
side of an infalling shell from θ0 > 70◦ (see leftmost panel of             method outlined in Long et al. (2018), we estimate a gap center
Fig. 4). Therefore, we conclude that residual infall in the reced-          of Rg = 53 au with a width of ∆ = 9 au, which is typical of those
ing lobe is confined to equatorial regions, and the wide angle              recently observed in Class II disks (Long et al. 2018; Andrews
redshifted component surrounding the inner cone traces mostly               et al. 2018). Assuming that ∆ is 5.5 times the planet’s Hill radius
outflowing material.                                                        (Lodato et al. 2019), the mass of the planet that could carve the
                                                                            inner gap in DG Tau B would be 0.1 MJ .
                                                                                 Alternatively, the observed emission bumps in the DG Tau B
4. Discussion                                                               disk may be due to other mechanisms than rings and gaps
4.1. DG Tau B disk: Evolutionary stage and origin of structure              carved by planets. Indeed, the radial emission profile does not
                                                                            show dips going below the underlying centrally peaked power-
DG Tau B has been traditionally classified as a Class I source              law component, which is unlike what has been observed, for
based on the slope of its near-infrared spectral energy distribu-           example, in the HL Tau disk (Brogan et al. 2015). We might
tion (Luhman et al. 2010). However, Crapsi et al. (2008) showed             therefore be witnessing an earlier stage of millimetric dust
that strongly inclined Class II disks (i ≥ 65◦ ) could be misclassi-        accumulation before planetary and gap formation. Different
fied as Class I with the spectral slope method, and Kruger et al.           mechanisms can lead to the formation of radial structures in
(2011) attribute ice absorptions toward DG Tau B to a thick                 disks. Dust radial trapping and growth due, for example, to snow
edge-on disk. Our ALMA observations show that while DG Tau                  lines (Zhang et al. 2015) as well as the secular gravitational insta-
B’s disk is indeed very large and flared, residual infall onto the          bility (Takahashi & Inutsuka 2016) have been recently invoked
disk is still present at large polar angles θ0 > 70◦ in both lobes          to reproduce the rings in the HL Tau disk. This latter mecha-
of the system (see Sects. 3.1 and 3.2.2). However, by extrapo-              nism could act in the large and likely massive DG Tau B disk.
lating the single-dish fluxes obtained by Mottram et al. (2017)             Nonideal magnetohydrodynamic (MHD) effects and zonal flows
at 450 µm and 850 µm, we find that the extended dust envelope               can also generate radial structures in disks, with lower contrast
around DG Tau B contributes only 300+400  −300 mJy at 1.3 mm, that          at large radii (e.g., in Béthune et al. 2017; Suriano et al. 2019). In
is, at most comparable to the disk flux itself. Following Eq. (1)           any case, our DG Tau B ALMA observations confirm that disk
of Motte & André (2001), we would infer an envelope mass                    substructures can form at an early stage where infall and outflow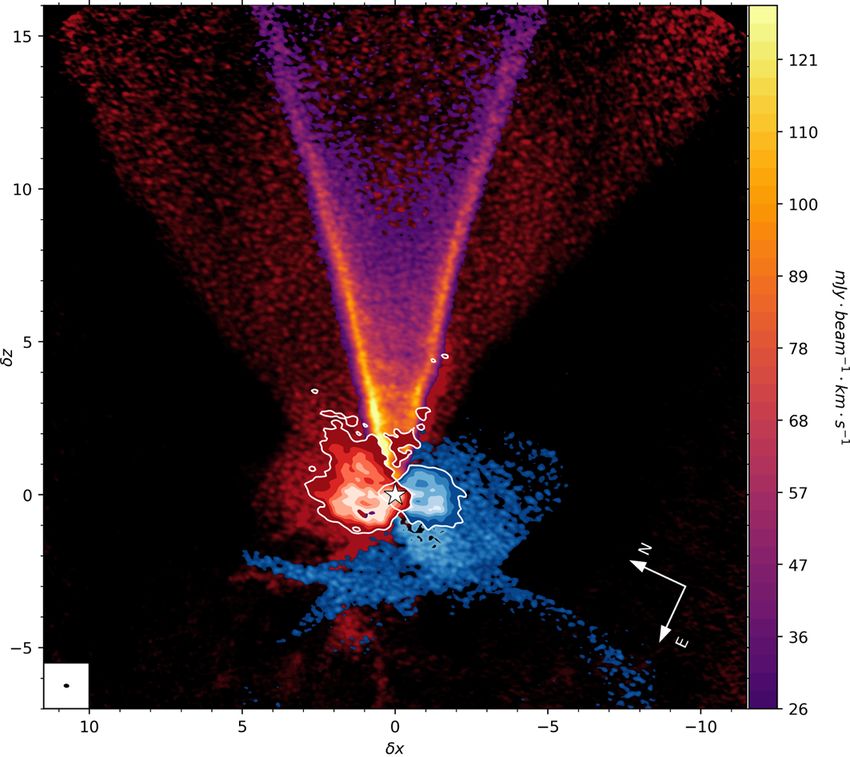
A&A 634, L12 (2020)

spectral energy distribution and scattered light cavities images               reduction presented in this Letter were performed on the GRICAD infrastructure
in DG Tau B at the same time (Gramajo et al. 2010) as well as                  (https://gricad.univ-grenoble-alpes.fr), which is partly supported by
why some Class II sources with active outflows appear to have                  the Equipe@Meso project (reference ANR-10-EQPX-29-01) of the programme
                                                                               Investissements d’Avenir supervised by the Agence Nationale pour la Recherche.
dusty conical “envelopes” above their disks (e.g., RY Tau, Fig. 3              This work was supported by the Programme National de Physique Stellaire
in Takami et al. 2013.)                                                        (PNPS) and the Programme National de Physique et Chimie du Milieu Interstel-
     The parabolic morphology of the slow wide angle flow and                  laire (PCMI) of CNRS/INSU co-funded by CEA and CNES. L. A. Z. acknowl-
its multiple inner loops resemble the structure of slow outflow                edge financial support from DGAPA, UNAM, and CONACyT, México. F. L.
                                                                               acknowledges the support of the Fondecyt program n◦ 3170360.
cavities around younger sources, such as HH46-47 (Zhang et al.
2019). They are interpreted as ambient material swept up by
an episodic wide-angle inner wind. Wind-driven shell models                    References
predict emission maps shifting away from the star as the line-
of-sight velocity increases as observed in this component (see                 Anderson, J. M., Li, Z.-Y., Krasnopolsky, R., & Blandford, R. D. 2003, ApJ, 590,
                                                                                  L107
Fig. 24 in Lee et al. 2000).                                                   Andrews, S. M., Huang, J., Pérez, L. M., et al. 2018, ApJ, 869, L41
     However, the striking conical inner flow anchored at small                Aso, Y., Ohashi, N., Saigo, K., et al. 2015, ApJ, 812, 27
radii ≤10–60 au highly unusual so far. It is reminiscent of the                Bai, X.-N., Ye, J., Goodman, J., & Yuan, F. 2016, ApJ, 818, 152
predictions for the long-term interaction shell between inner jet              Béthune, W., Lesur, G., & Ferreira, J. 2017, A&A, 600, A75
                                                                               Bjerkeli, P., van der Wiel, M. H. D., Harsono, D., Ramsey, J. P., & Jørgensen,
bowshocks and a steady outer disk wind, as recently computed                      J. K. 2016, Nature, 540, 406
by Tabone et al. (2018). The interaction between an outer disk                 Brogan, C. L., Pérez, L. M., Hunter, T. R., et al. 2015, ApJ, 808, L3
wind and an inner wide-angle wind cannot be excluded either,                   Brown, A. G. A., Vallenari, A., Prusti, T., et al. 2018, A&A, 616, A1
but predictions for this scenario do not exist yet.                            Crapsi, A., van Dishoeck, E. F., Hogerheijde, M. R., Pontoppidan, K. M., &
     Alternatively, the constant velocity and mass flux of the inner              Dullemond, C. P. 2008, A&A, 486, 245
                                                                               Frank, A., Ray, T. P., Cabrit, S., et al. 2014, Protostars and Planets VI (Tucson:
conical flow, also seen in HH30 (Louvet et al. 2018), suggest that                University of Arizona Press), 451
it could trace matter directly ejected from the disk. In the case of           Goldsmith, P. F., Heyer, M., Narayanan, G., et al. 2008, ApJ, 680, 428
a cold, steady, axisymmetric MHD disk wind, our derived value                  Gramajo, L. V., Whitney, B. A., Gómez, M., & Robitaille, T. P. 2010, AJ, 139,
of angular momentum and poloidal speed would predict an ejec-                     2504
                                                                               Guilloteau, S., Dutrey, A., Piétu, V., & Boehler, Y. 2011, A&A, 529, A105
tion radius of r0 ≈ 2 au and a magnetic level arm of λ = 1.6, using            Harsono, D., Bjerkeli, P., van der Wiel, M. H. D., et al. 2018, Nat. Astron., 2,
the formulae in Anderson et al. (2003). This model was ruled                      646
out by Zapata et al. (2015) based on the small magnetic lever                  Hartigan, P., Morse, J. A., & Raymond, J. 1994, ApJ, 436, 125
arm λ ' 2 and large outflow mass-flux. However, recent non-                    Kruger, A. J., Richter, M. J., Carr, J. S., et al. 2011, ApJ, 729, 145
ideal MHD simulations of magnetized winds from protoplane-                     Lee, C.-F., Mundy, L. G., Reipurth, B., Ostriker, E. C., & Stone, J. M. 2000, ApJ,
                                                                                  542, 925
tary disks do predict small magnetic lever arms and a mass-flux                Lodato, G., Dipierro, G., Ragusa, E., et al. 2019, MNRAS, 486, 453
of the same order as the accretion rate (Béthune et al. 2017; Bai              Long, F., Pinilla, P., Herczeg, G. J., et al. 2018, ApJ, 869, 17
et al. 2016), as observed here. They also predict an important                 Louvet, F., Dougados, C., Cabrit, S., et al. 2018, A&A, 618, A120
role of thermal gradients in driving the wind. In that case, the               Luhman, K. L., Allen, P. R., Espaillat, C., Hartmann, L., & Calvet, N. 2010,
                                                                                  ApJS, 186, 111
launching radius r0 could be up to 5 au (corresponding to the                  McMullin, J. P., Waters, B., Schiebel, D., Young, W., & Golap, K. 2007, Astron.
minimum λ ≈ 1) .                                                                  Data Anal. Softw. Syst. XVI, 376, 127
     However, we stress that our estimate of angular momen-                    Mitchell, G. F., Sargent, A. I., & Mannings, V. 1997, ApJ, 483, L127
tum is highly uncertain given the complex steep velocity                       Motte, F., & André, P. 2001, A&A, 365, 440
gradients, projection effects, and beam smearing effects. Three-               Mottram, J. C., van Dishoeck, E. F., Kristensen, L. E., et al. 2017, A&A, 600,
                                                                                  A99
dimensional modeling of the observations is requested to con-                  Mundt, R., & Fried, J. W. 1983, ApJ, 274, L83
strain the flow rotation and kinematic structure more accurately               Mundt, R., Ray, T. P., & Raga, A. C. 1991, A&A, 252, 740
as well as to firmly distinguish between the various scenarios.                Najita, J. R., & Bergin, E. A. 2018, ApJ, 864, 168
This is outside the scope of the present Letter and will be the                Padgett, D. L., Brandner, W., Stapelfeldt, K. R., et al. 1999, AJ, 117, 1490
                                                                               Pinte, C., Ménard, F., Duchêne, G., et al. 2018, A&A, 609, A47
subject of a forthcoming paper (de Valon et al., in prep.).                    Podio, L., Eislöffel, J., Melnikov, S., Hodapp, K. W., & Bacciotti, F. 2011, A&A,
     Whatever its origin, we stress that the large mass-flux car-                 527, A13
ried along the inner conical outflow walls, being comparable to                Schmalzl, M., Kainulainen, J., Quanz, S. P., et al. 2010, ApJ, 725, 1327
the inner disk accretion rate, must play a major role in limit-                Sheehan, P. D., & Eisner, J. A. 2018, ApJ, 857, 18
ing the final mass of the star and disk. Thanks to its large disk,             Suriano, S. S., Li, Z.-Y., Krasnopolsky, R., Suzuki, T. K., & Shang, H. 2019,
                                                                                  MNRAS, 484, 107
proximity, and favorable inclination (compared e.g., to HH30),                 Tabone, B., Raga, A., Cabrit, S., & Pineau des Forêts, G. 2018, A&A, 614, A119
DG Tau B is a very promising target to elucidate the disk-                     Takahashi, S. Z., & Inutsuka, S.-I. 2016, AJ, 152, 184
outflow connexion and its impact on disk evolution and planet                  Takami, M., Karr, J. L., Hashimoto, J., et al. 2013, ApJ, 772, 145
formation.                                                                     Terebey, S., Shu, F. H., & Cassen, P. 1984, ApJ, 286, 529
                                                                               Ulrich, R. K. 1976, ApJ, 210, 377
                                                                               van der Marel, N., Dong, R., di Francesco, J., Williams, J., & Tobin, J. 2019,
Acknowledgements. The authors would like to thank the referee, whose com-         ApJ, 872, 112
ments helped improve the quality of the Letter. We acknowledge Ana Lopez-      van Kempen, T. A., van Dishoeck, E. F., Salter, D. M., et al. 2009, A&A, 498,
Sepulcre for crucial help in the data reduction process at the IRAM-Grenoble      167
ALMA ARC node. This Letter makes use of the following ALMA data:               Yen, H.-W., Takakuwa, S., Ohashi, N., et al. 2014, ApJ, 793, 1
ADS/JAO.ALMA#2015.1.01108.S, ADS/JAO.ALMA#2017.1.01605.S. ALMA                 Zapata, L. A., Lizano, S., Rodríguez, L. F., et al. 2015, ApJ, 798, 131
is a partnership of ESO (representing its member states), NSF (USA) and NINS   Zhang, K., Blake, G. A., & Bergin, E. A. 2015, ApJ, 806, L7
(Japan), together with NRC (Canada), MOST and ASIAA (Taiwan), and KASI         Zhang, Y., Arce, H. G., Mardones, D., et al. 2016, ApJ, 832, 158
(Republic of Korea), in cooperation with the Republic of Chile. The Joint      Zhang, Y., Higuchi, A. E., Sakai, N., et al. 2018, ApJ, 864, 76
ALMA Observatory is operated by ESO, AUI/NRAO and NAOJ. Part of the data       Zhang, Y., Arce, H. G., Mardones, D., et al. 2019, ApJ, 883, 1

L12, page 6 of 11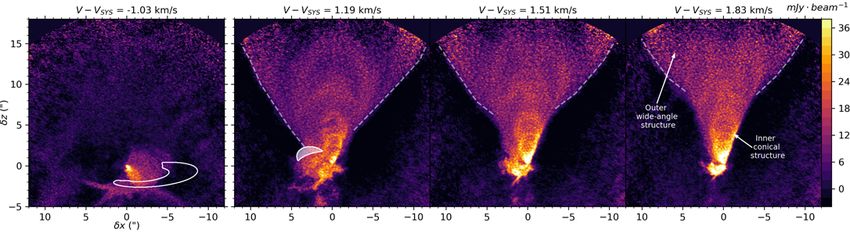
A. de Valon et al.: ALMA observations of DG Tauri B disk and CO outflow

  Appendix A: Model of the radial intensity profile                                 To compare effectively with our observations, we convolved this
                                                                                    profile with a kernel with a full width at half maximum (FWHM)
  To model the radial intensity profile of the continuum emission,                  corresponding to the beam FWHM in that direction. The fitting
  we used the equation of an exponentially tapered power law plus                   is achieved using a nonlinear least squares method. The param-
  two off-centered Gaussians to reproduce the bumps:                                eters of the best fit with their standard deviation errors are listed
              !γ            !β # X                                                  in Table 1 and the model intensity profile without convolution is
                                                (r − Ri )2
                    "                       "              #
            r            r
  I(r) = A       exp −          +    Bi exp −                · (A.1)                shown in Fig. A.1.
           rt            rt       i
                                                   2σi

  Table A.1. Log of observations.

              Cycle Configuration Number of     Date     Number of                    Baseline range   Total on source       Flux         Phase
                                   sessions (YYYY-MM-DD) antennas                          (m)         integration time    calibrator   calibrator
              3         C36-2/3          1           2016-04-23             39          15.1−400           0h48mn         J0238+1636 J0510+1800
              3          C40-5     4 (2 kept) (a) 2016-08-05/15           43/38      15.1−1500/1 600       1h37mn         J0510+1800 J0510+1800
              5          C43-8           3        2017-11-16/18/19       43/44/46       92.2−8500          2h06mn         J0510+1800 J0438+3004

  Notes. (a) Only two sessions were kept due to poor phase calibration.

           20.0

           17.5

           15.0

           12.5
1
mJy beam

           10.0

            7.5

            5.0

            2.5

            0.0
              0.00   0.25   0.50   0.75    1.00     1.25   1.50   1.75     2.00
                                            x (")
  Fig. A.1. Best fit to the radial continuum emission profile before
  convolution by the beam.

                                                                                                                                        L12, page 7 of 11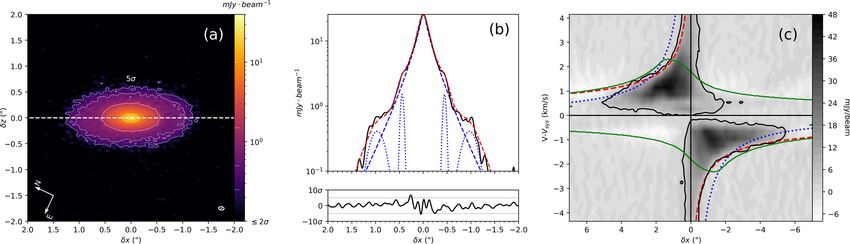
A&A 634, L12 (2020)

Appendix B: CO channel maps

Fig. B.1. 13 CO selected individual channel maps. For each channel map ∆V = 0.3 km s−1 and the central velocity is indicated. The white contours
trace the 3σ limit with σ = 5 mJy beam−1 (or 1.6 K). The white cross in each panel locates the central position of the continuum. The beam
(0.23 00 × 0.3400 at PA = 0.5◦ ) is shown in the first panel.

Fig. B.2. C18 O selected individual channel maps. For each channel map ∆V = 0.3 km s−1 and the central velocity is indicated. The white contours
trace the 3σ limit with σ = 4 mJy beam−1 (or 1.3 K). The white cross in each panel locates the central position of the continuum. The beam
(0.2300 × 0.3400 at PA = 2◦ ) is shown in the first panel.

L12, page 8 of 11
A. de Valon et al.: ALMA observations of DG Tauri B disk and CO outflow

Fig. B.3. 12 CO selected individual channel maps. For each channel map ∆V = 0.32 km s−1 and the central velocity is indicated. Bottom right panel:
averaged map from (V − Vsys ) = 7.54 to (V − Vsys ) = 9.13 km s−1 . The two white dotted lines show the inner and outer cone as defined in Fig. 3.

                                                                                                                                L12, page 9 of 11
A&A 634, L12 (2020)
Appendix C: Estimation of the mass flux
2.2" 2.1 km/s Upper limit
100 (a) 4.2" 100 (b) 3.1 km/s (c) Lower limit
Optically thin
80 80 10 6
M (M /years)
T12CO
T13CO 60 60
40 40 10 7
20 20
0 0 10 8
1 2 3 4 5 2 4 6 8 10 2 4 6 8 10
V - Vsys Z Z
12 13
Fig. C.1. Intensity ratio between CO and CO radially averaged over the cone region: (a) as a function of the velocity on two slices of
width = 0.700 at δz = 2.200 (black) and δz = 4.200 (blue); and (b) as a function of height in the velocity bins (V − Vsys ) = 2.15 km s−1 (blue) and
(V − Vsys ) = 3.1 km s−1 (black). The arrows represent the 5σ lower limit on the ratio when no 13 CO is detected. (c) Resulting mass flux under
different opacity hypothesis assuming optically thin 12 CO (in red with errorbars at 30%), applying opacity correction based on 12 CO/13 CO and
assuming either optically thin emission (lower limit: black solid) or the last detected value (upper limit: black dashed) when no 13 CO is detected
(see text for more details).
We calculated the mass in the conical component assuming LTE lower and upper limits on the mass flux are constant from δz = 200
excitation and by using the method presented in Louvet et al. to δz = 1200 at Ṁ = 1.7−2.9 × 10⁻⁷ M yr−1 (see Fig. C.1c).
(2018). We integrated T mb from (V − Vsys ) = 2.15 to 8 km s−1
in slices of δz = 0.700 inside the region delimited by the outer
cone (see Fig. 3). We chose this velocity range and spatial Appendix D: Rotating infall models
domain to have a decent estimate of the mass without being For an axisymmetric rotating envelope in ballistic infall onto
too contaminated by the wider component at lower velocities. a point mass M, the equation defining one given streamline is
We set the CO excitation temperature to T ex = 50 K, corre- described by only two parameters: rd the outer disk radius and
sponding to the peak T mb in this region. The integrated flux over θ0 the initial infall angle with the rotation axis of the disk (Ulrich
the cone area in the range (V − Vsys ) = 2.15 to 8 km s−1 and 1976). In defining θ, the angle of the streamline with respect to
δz = 200 −1000 is 60 Jy km s−1 , corresponding to a total optically the rotation axis at a given spherical radius R, we get:
thin mass of 1 × 10⁻⁴ M . A similar integrated flux was found
on the SMA data of Zapata et al. (2015) (64 Jy km s−1 ). For a −rd cos θ0 sin2 θ0
twice lower T ex , the mass would be decreased by a factor 1.6. cos θ = + cos θ0 . (D.1)
R
The mass scales linearly with T ex for T ex ≥ 50 K. If we inte-
grated down to (V − Vsys ) = 1 km s−1 , encompassing all red- We can then, with z = r cos θ, describe the shape of the flow
shifted lobe emission, the derived mass would typically increase surface followed by infalling material originating from θ0 . The
by a factor of 1.5, but it would suffer from contamination velocity components at a given point (z, R) = (θ, R) are given by:
from the wider “pedestal” component projected in front of the GM 12 cos θ 2
1
cone. vR = − 1+ (D.2)
Figures C.1a and b show that the intensity ratio of 12 CO to R cos θ0
13
CO increases as a function of the velocity and height in the GM 12 cos θ + cos θ 12
0
outflow. We used the compact and more sensitive 13 CO configu- vθ = (cos θ0 − cos θ) (D.3)
R cos θ0 sin2 θ
ration for more precision on this variation. We added a standard GM 12 sin θ cos θ 2
1
correction factor for the 12 CO optical depth, which was com- vφ =
0
1− · (D.4)
puted for each slice in ∆z and the velocity bin. The observed R sin cos θ0
ratio is always above 10 so that the 13 CO emission is optically
The paper by Ulrich (1976) had a typographical error in the
thin. The correction factor to be applied to the 12 CO brightness
equation of vθ , which was corrected by Terebey et al. (1984) (see
is then given by:
their Eq. (89)).
T 13CO We then consider at each z(R), a ring of streamlines with
F12 = X12,13 , (C.1) azimuth φ from 0 to 2π. We projected their position onto the
T 12CO
plane of the sky and their velocity onto the line of sight, and we
with X12,13 , the abundance ratio set at 65 (Goldsmith et al. 2008). convolved in 3D to produce a synthetic datacube matching the
When no 13 CO is detected, a lower and upper limit to the mass angular and spectral resolutions of our ALMA observations. We
flux are obtained by assuming optically thin 12 CO and by set- show below channel maps predicted by this model for different
ting the intensity ratio to the upper measured value. The derived values of rd and θ0 .
L12, page 10 of 11A. de Valon et al.: ALMA observations of DG Tauri B disk and CO outflow
Fig. D.1. 12 CO selected individual channel maps. For each channel map ∆V = 0.32 km s−1 and the central velocity is indicated. Similarly to Fig. 4,
the white contours trace the model of an infalling shell with rd = 300 au (top), 700 au (bottom), and θ0 = 30◦ , 50◦ , and 70◦ .
L12, page 11 of 11You can also read