BIOSYNTHESIS OF COPPER NANOPARTICLES USING AQUEOUS GUAVA EXTRACT -CHARACTERISATION AND STUDY OF ANTIBACTERIAL EFFECTS
←
→
Page content transcription
If your browser does not render page correctly, please read the page content below
Available Online through
              www.ijpbs.com (or) www.ijpbsonline.com                          IJPBS |Volume 5| Issue 2|APR-JUN|2015|25-43

                                                                                                      Research Article
                                                                                                     Biological Sciences
        BIOSYNTHESIS OF COPPER NANOPARTICLES USING AQUEOUS GUAVA EXTRACT
               –CHARACTERISATION AND STUDY OF ANTIBACTERIAL EFFECTS
            G. Caroling1, M. Nithya Priyadharshini1, E. Vinodhini1, A. Mercy Ranjitham1, P. Shanthi
               1
                   Department of Chemistry, Ethiraj College for Women, Chennai- 600 008, Tamil Nadu, India
                                     *Corresponding Author Email: gcaroling@yahoo.com

       ABSTRACT
       Vegetable mediated synthesis of nanoparticles is a green chemistry approach that connects nanotechnology and
       biotechnology. In the present investigation, we have used a fast, convenient and environment friendly method for
       the synthesis of copper nanoparticles by biologically reducing copper nanoparticles with aqueous extract of psidium
       guajava L (guava) under optimum conditions (pH 10). The formation of copper nanoparticles was indicated by the
       colour change from colourless to brown. Biosynthesized nanoparticles were characterized by UV-VIS, FT-IR, XRD,
       SEM, TEM and EDAX analysis. These biologically synthesized copper nanoparticles were tested for antibacterical
       activity against two human pathogens viz, Escheria coli and staphylococcus aures. The reducing property of aqueous
       extract due to the presence of antioxidant viz, ascorbic acid, polyphenols which is confirmed by quantitative assay.
       KEY WORDS
       Psidium guajava L, FT-IR, XRD, SEM, TEM and EDAX.

       1. INTRODUCTION                                            biosynthesis of nanoparticles is also considered
       Nanoscience (science at 1- 100 nanoscale) is the           to be a bottom up technique, where the
       most promising technology that can be applied              oxidation or reduction is the main reaction that
       almost in all spheres of life, ranging from                occurs during the production of nanoparticles.
       electronics,       pharmaceutical,     defence,            Metal compounds usually reduce into their
       transformations, heat transfer to sports and               respective nanoparticles because of microbial
       aesthetics. Metallic nanoparticles are great               enzymes or the plant phytochemicals with
       interest due to their excellent physical and               antioxidant or reducing properties.
       chemical properties, such as high surface-to-               Although biosynthesis of copper nanoparticles
       volume ratio and heat transfer (thermal                    by plants viz, ginger     (zingiber officinal )[3],
       conductivity) [1].                                         Aspergillus species [4], plant leaf extract of
       The nanoparticles can be synthesized by                    magnolia[5], leaf extract of tridax procumbens
       physical, chemical and biological methods. The             [6], pseudomonas stutzeri isolated from soil [7],
       physical methods are laser ablation method, arc            lantana camara[8]. Copper nanoparticles due to
       discharged method, High energy ball billing                their excellent physical and chemical properties
       method and the chemical vapour deposition                  and low cost of preparation have been of great
       method the chemical methods are co-                        interest. Copper nanoparticles have wide
       precipitation method, sol-gel method, micro                applications    as    heat    transfer     system,
       emulsion method, hydrothermal method, sono                 antimicrobial materials[9,10], super strong
25

       chemical method, microwave method [2]. The                 materials[11-12], sensors[13-15] and catalyst[16-
Page

        International Journal of Pharmacy and Biological Sciences (e-ISSN: 2230-7605)
       G. Caroling*et al                                                                         Int J Pharm Bio Sci
                                              www.ijpbs.com or www.ijpbsonline.com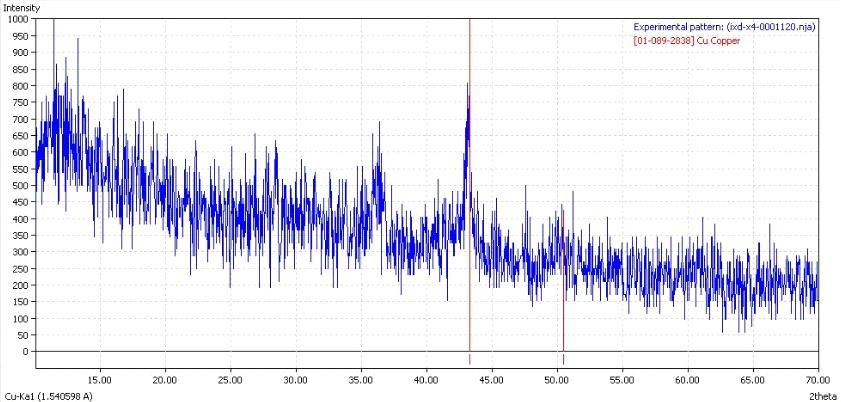
Available Online through
               www.ijpbs.com (or) www.ijpbsonline.com                     IJPBS |Volume 5| Issue 2 |APR-JUN|2015|25-43

       18]. Copper nanoparticles can easily oxidize to         strains employed in this work were produced
       form copper oxide. To protect copper                    from microbial type culture collection center
       nanoparticles from oxidation, they are usually          (MTCCC) technology, Chandigarh, India (E-coli
       encapsulated in organic and inorganic coating           and staphylococcus).
       such as carbon and silica [19, 20]. Cuprous oxide       2.2. Preparation of sample extract
       is p-type semiconductor with a direct band gap            50gm of guava fruit (psidium guajava L) was
       of 2.17eV [21, 22].                                     accurately weighed, thoroughly washed under
       Psidium guajava L , the Indian guava from               running tap water followed by washing it with
       Spanish guayaba is a deciduous tree of the              double deionised water to remove surface
       Myrtales family. It is known for its edible fruit.      impurities. They were crushed using a blender
       Although these fruits are reputed to contain high       and finely macerated. After homogenisation
       amounts of ascorbic acid (vitamin C),                   100ml of double deionised water was added and
       479mg/100g, it also contains polyphenols like           heated over a water bath maintained at 800C for
       flavonoids, ellagic acid and gallic acid. Guavas are    15 minutes. The extract obtained was filtered
       rich in dietary fiber, vitamins A and C, folic acid,    through muslin cloth and then through
       and the dietary minerals, potassium, copper             whatmann No.1 filter paper (pore size 25 µm )
       and manganese. Having a generally broad, low-           and used immediately for the biosynthesis of
       calorie profile of essential nutrients, a single        copper nanoparticles.
       common guava (P. guajava) fruit contains about          2.3. Pharmocognostic evaluation of aqueous
       four times the amount of vitamin C as an orange         extract
       [23].                                                   Fresh extract of the fruit of guava was used for
       Nanoparticles have been intensively studied over        phytochemical screening-Qualitative analysis.
       the last decade due to its characteristic physical,     2.3.1. Phytochemical Screening – Qualitative
       chemical, electronic, electrical, mechanical,           Analysis
       magnetic, thermal, dielectric, optical and               Preliminary phytochemical screening was
       biological properties [24]. The oxides of               carried out for the identification of
       transition metals are an important class of             carbohydrates, flavonoids, steroids, tannins,
       semiconductors, which have applications in              alkaloids, glycosides, saponins, triterpenoids and
       magnetic storage media, solar energy                    phenol       using     standard      phytochemical
       transformation, electronics, gas sensors, and           methods.[32].
       catalysis [25]. Micro emulsion method [26] arc          2.4. Synthesis of copper nanoparticles
       submerged nanoparticles synthesis system [27]            The biosynthesis of copper nanoparticles
       flame based aero sol methods [28] sonochemical          involves four stages Copper sulphate (0.02M)
       [29] hydrothermal [30] and solid state                  was prepared in deionised water and a blue
       techniques [31].                                        solution was obtained. Polyethylene glycol 6000
                                                               (0.01M) was dissolved in water and added to the
       2. MATERIALS AND METHODS                                aqueous solution containing the copper salt with
       2.1. Material: Guava sample for the biosynthesis        vigorous stirring. In this step, the colour of the
       of copper nanoparticles was produced from the           solution changed from blue to white. In the third
       local supermarket. Copper sulphate, sodium              step, guava extract was added to the copper
       hydroxide, PEG 6000 and other reagents used in          sulphate solution containing PEG. The colour of
26

       the study were a analytical grade. The bacterial        the solution remains the same. Finally, 0.1M
Page

       International Journal of Pharmacy and Biological Sciences (e-ISSN: 2230-7605)
       G. Caroling*et al                                                                     Int J Pharm Bio Sci
                                           www.ijpbs.com or www.ijpbsonline.com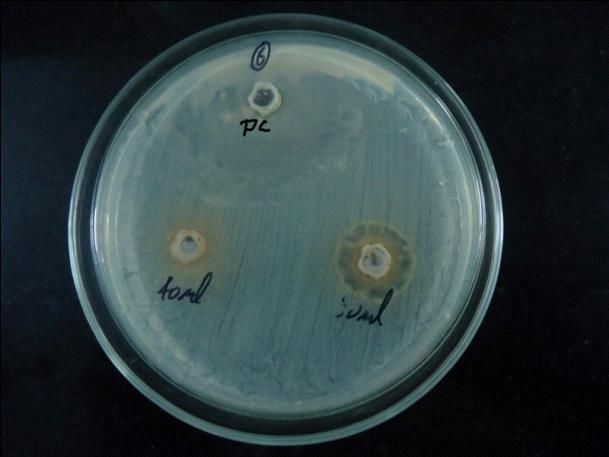
Available Online through
               www.ijpbs.com (or) www.ijpbsonline.com                    IJPBS |Volume 5| Issue 2 |APR-JUN|2015|25-43

       sodium hydroxide was added in drops to the             2.5.4. Biosynthesis of copper nanoparticles at
       solution under continuous rapid stirring. The          different intervals of time
       colour of the aqueous phase changed from white          The synthesis was carried out at pH10 in the
       to green. The appearance of this colour indicates      ratio 1:3(extract:CuSO4) and the time taken for
       that the reduction has started. The formation of       the formation was noted at an noted at an every
       copper nanoparticles is confirmed by the colour        10 minutes and completion of the reaction was
       change from green to brown when it is kept on          monitored by the colour change as well as the
       the water bath under 800C. The formation of            UV- Visible spectrum.
       copper nanoparticles is inferred by visual             2.5.5. Biosyntheis of copper nanoparticles in the
       observation followed b UV-Visible spectrum,            presence of PEG
       FTIR, SEM, XRD and EDAX studies [15].                   Biosynthesis of copper nanoparticles was
       2.5. Fixation of parameters for biosynthesis of        carried at pH 10 in the ratio 1:3 with and without
       copper nanoparticles                                   PEG 6000 and completion of the reaction was
       2.5.1. Biosynthesis of copper nanoparticles            monitored by the colour change as well as by
       using different ratios                                 recording the UV-Visible spectrum.
         The biosynthesis of copper nanoparticles was         2.5.6. Stability of copper nanoparticles
       carried out at different ratio of extract and           The stability of the colloidal aqueous solution of
       copper sulphate (1:1, 1:2, 1:3, 1:4, 1:5) at pH10.     copper nanoparticles was determined at room
       Time taken for the colour change in the reaction       temperature at an interval of 24 hrs for 15days.
       mixture as well as the formation of nanoparticle       2.6. Characterisation of biosynthesized copper
       was monitored by visual inspection and also by         nanoparticle
       UV-Visible spectrophotometer.                          2.6.1. Visual inspection
       2.5.2. Biosynthesis of copper nanoparticles at          The bio-reduction of the aqueous solution of
       different temperatures                                 copper sulphate using guava extract was
        The biosynthesis of copper nanoparticles for          monitored and the appearance of brown colour
       the fixed composition was done at different            indicates the formation of Copper nanoparticles.
       temperatures namely; room temperature and by           2.6.2. pH analysis
       heating in the waterbath at 600C,and 800C . The         The pH of the extract, precursor as well as the
       time taken for visual colour change from green         resulting mixture after addition of PEG 6000 and
       to brown was recorded followed by recording            NaOH was determined using digital pH meter.
       UV-Visible spectrum.                                   2.6.3. UV spectroscopy
       2.5.3. Biosynthesis of copper nanoparticles at          The reduction of copper sulphate to copper was
       different pH                                           monitored by recording UV-Visible spectrum of
        The biosynthesis of copper nanoparticles for 1:3      the reaction mixture after diluting a small aliquot
       ratios of extract and copper sulphate was carried      of the sample with deionised water. The
       out at different pH viz. 6, 8, and 10. The time        measurements are recorded on Shimadzu dual
       taken for colour change as well as the UV- Visible     beam spectrometer (model uv-1650pc) operated
       spectrum for the reaction mixture was                  at resolution of 1nm.
       monitored.                                             2.6.4. FT-IR analysis of bio-mass before and
                                                              after bio-reduction
                                                               FT-IR measurement was carried out for both
27

                                                              the extract and copper nanoparticles to identify
Page

       International Journal of Pharmacy and Biological Sciences (e-ISSN: 2230-7605)
       G. Caroling*et al                                                                    Int J Pharm Bio Sci
                                          www.ijpbs.com or www.ijpbsonline.com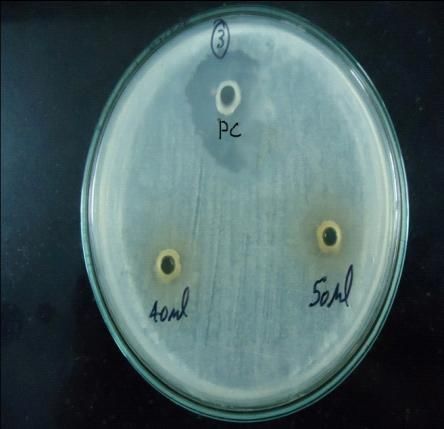
Available Online through
               www.ijpbs.com (or) www.ijpbsonline.com                    IJPBS |Volume 5| Issue 2 |APR-JUN|2015|25-43

       the possible bioactive molecules responsible for       grid was prepared by placing a drop of the
       the reduction of the copper ions and the capping       particle solution and drying under a IR lamp.
       of the copper nanoparticles by the guava extract       2.7.      Pharmocognostic         evaluation     of
       using KBr pellet and the spectrum was recorded         biosynthesized copper nanoparticles
       in the wavelength interval 4000 to 400cm⁻ 1. The       2.7.1 Determination of antibacterial activity
       FT-IR spectrum was also recorded for the solid          Antibacterial activity of the extract was
       copper       nanoparticles      isolated      after    determined on Muller and Hinton Agar (Hi-
       centrifugation.                                        Media Pvt. Ltd .Mumbai) using Kirby-Bauer disk
       2.6.5. X-Ray diffraction studies                       diffusion method [33]. Test pathogens were
        X-ray diffraction (XRD) measurement of the            spread on the test plates- Muller Hinton Agar
       guava reduced copper nanoparticles was carried         (MHA) for bacterial using sterile swabs. Sterile
       out using powder x-ray diffractometer                  wells are made with the help of a sterile cork
       instrument (SEIFERT JSO DEBYEFLEX-2002) in the         borer at aseptic conditions. Samples (1500μg
       angle range of 100-700 operated at a voltage of        and 2000μg) were added to the wells at aseptic
       40kV and a current of 30mA with CuKα radiation         conditions. Stock solutions of the extract were
       in a θ-2θ configuration. The crystallite domain        prepared using DMSO. The test plates were
       size was calculated by using Debye- Scherrer           incubated for 24hrs. The zone of inhibition (in
       formula.                                               mm diameter) were read and taken as the
       2.6.6. Scanning electron microscopy (SEM)              activity of the extract against the test organisms.
        The sample was prepared by placing a drop of
       colloidal solution of copper sulphate on carbon        3. RESULTS AND DISCUSSION
       coated copper grid and subsequently drying in          3.1. Qualitative Pharmocognostic evaluation of
       air, before transferring it to the microscope          extract
       operated at an accelerated voltage of 130kV             The results of qualitative phytochemical
       (Hitachi-S 3400N).                                     analysis of the guava extract are shown in table-
       2.6.7. Energy dispersive x-ray spectroscopy            1 which indicates the presence of secondary
       (EDAX)                                                 metabolites such as carbohydrates, flavonaids,
        The presence of elemental copper was                  alkaloids, steroids, glycosides, tannins, saponins,
       confirmed through EDS. Energy dispersive               phenols and triterpenoids.
       analysis x-ray spectrometer takes advantage of
       the photon nature of the light. In the x-ray range      Table 1: Qualitative phytochemical screening of
       the energy of a single photon is just sufficient to                    fresh guava extract
       produce a measurable pulse x-ray. A                          1     Carbohydrates           +
       semiconductor material is used to detect the x-              2     Flavonaids              +
       ray along with processing electronics to analysis            3     Alkaloid                +
       the spectrum. The EDS observations were carried              4     Steroids                +
       out by instrument coupled with SEM.                          5     Glycosides              +
       2.6.8. Transmission electron microscopy (TEM)                6     Tannins                 _
        TEM techniques was employed to visualise the                7     Saponins                _
       size and shape of copper nanoparticles. The                  8     Triterpenoids           +
       200kV high resolution transmission electron                  9     Phenon                  +
28

       microscope (FEITECNAI F -20)was added. TEM                  Indication of sign (+) present and (-) absent
Page

       International Journal of Pharmacy and Biological Sciences (e-ISSN: 2230-7605)
       G. Caroling*et al                                                                     Int J Pharm Bio Sci
                                          www.ijpbs.com or www.ijpbsonline.com
Available Online through
www.ijpbs.com (or) www.ijpbsonline.com IJPBS |Volume 5| Issue 2 |APR-JUN|2015|25-43
The presence of ascorbic acid, polyphenols and
other phytonutrients present in aqueous guava
extract is mainly responsible for the bio-
reduction process [16]. From the literature it has
been found that the amount of ascorbic acid
(natural vitamin C) present in guava extract was
found to be 479mg of ascorbic acid/100gm of
fruit. Polyphenolic compounds are very
important plant constituents because of the
Fig.1 Formation of copper nanoparticles
scavenging ability of their –OH groups. The
Different parameters were optimized for the
antioxidant property of polyphenolic compounds
biosynthesis of copper nanoparticles viz.,
is mainly due to the redox property which allows
Volume ratio of extract and copper
them to act as reducing agents [23].
sulphate,
3.2. Visual characterisation
Temperature,
The preparation of copper nanoparticles from
In the presence and absence of PEG
guava extract involves a four stage process.
6000 (capping agent),
When the pH of the solution was increased to 10
Different pH,
by the addition of 0.1M sodium hydroxide, the
Effect of time.
colour change of the solution changed from
colourless to green and finally brown on heating 3.3. Ratio of volume of extract: CuSO4: The
in a water bath. The colour change to brown formation of Copper nanoparticle depends on
indicates the reduction of copper sulphate and the volume of extract to CuSO₄ ratio are 4: The
formation of copper nanoparticles. Fig 1 time taken isgiven in (Table-2).
indicates the formation of nanoparticles.
Table 2: Time taken for the formation of copper nanoparticles using different ratio of volume of fresh
aqueous guava extract and aqueous 0.02M CuSO₄ at 800C in the presence of PEG at pH 10.
S.No Ratio (extract: CuSO₄) Time taken for the formation of nanoparticles λmax
1. 1:1 2 Hours 324
2. 1:2 1 Hour 268
3. 1:3 30 Min 294
The UV-Visible spectrum was recorded for the generation of smaller nanoparticle in the
shift in SPR peaks position with variation in the solution. However with further increase in the
amount of precursor salt to extract as shown in precursor ion from 1:2 to 1:3, a red shift was
the Fig 2. observed in SPR from 268 to 294nm. This may be
A blue shift in the wavelength from 324 to due to collision between smaller nanoparticle
268nm was observed with the increase in which leads to particle growth [4]. The inset
amount of precursor salt. This shift can be digital photograph in fig 2 clearly shows the
explained on the basis of increased nucleation formation of copper nanoparticle. Brown color
29
rate due to greater amount of cu2⁺ ions and was noted for the optimum amount of precursor
Page
International Journal of Pharmacy and Biological Sciences (e-ISSN: 2230-7605)
G. Caroling*et al Int J Pharm Bio Sci
www.ijpbs.com or www.ijpbsonline.comAvailable Online through
www.ijpbs.com (or) www.ijpbsonline.com IJPBS |Volume 5| Issue 2 |APR-JUN|2015|25-43
and extract producing greatest number of
copper nanoparticle in aqueous medium.
Fig.2 UV- Visible spectrum of biosynthesized Copper nanoparticle at different ratios
From the table it is also seen that the time taken reaction at 800C favours the biosynthesis of
for the formation of Copper nanoparticle was CuNP using aqueous guava extract.
found to be less for 25ml of the extract and 75ml 3.5. Effect of PEG
of 0.02M CuSO₄ solution (1:3). This ratio was An important feature in the production of the
found to be ideal as the biosynthesized metal nanoparticles is to prevent agglomeration
nanoparticles showed maximum absorption at and oxidation process. The stabilization is
294nm which is in agreement with the values commonly achieved by using surfactants which
reported in the literature. avoid the aggregration by binding to the
3.4. Effect of temperature on biosynthesis of nanoparticle surface. PEG 6000 is frequently
copper nanoparticles used as the stabilizer or capping agent of metal
The effect of temperature on the rate of colloids because of its availability, low cost and
formation of Copper nanoparticle was studied non toxicity. The stabilization of metal colloids
for the 1:3 composition of the extract and CuSO₄ and the shape of nano material depend strongly
solution. The CuNp were formed within 3o mins on PEG. In the present work PEG 6000 was used
at 800C. However, at room temperature and 600C which works as size controller and polymeric
the formation of CuNp were formed after 1 day capping agent because it hinders the nuclei from
and 2 hours respectively and above 800C under aggregation through the polar group which are
boiling condition the solution becomes charred strongly adsorbed at the surface of the CuNp
and no particle formation is seen. Hence, the with the co-ordination bonds. Fig- 4 shows UV-
30
Visible absorbance spectra of CuNp synthesized
Page
International Journal of Pharmacy and Biological Sciences (e-ISSN: 2230-7605)
G. Caroling*et al Int J Pharm Bio Sci
www.ijpbs.com or www.ijpbsonline.comAvailable Online through
www.ijpbs.com (or) www.ijpbsonline.com IJPBS |Volume 5| Issue 2 |APR-JUN|2015|25-43
under identical condition in absence and keeping them from excessive growth and leading
presence of PEG. The spectrum shows a blue to the generation of smaller nanoparticles [34].
shift in the position of SPR from 326-294nm in Formation of CuNp in the presence and absence
the presence of PEG. This indicates that the PEG of PEG 6000 is shown in the Fig 3.
molecule was adsorbed on the CuNp surface
(a) (b)
Fig.3 Formation copper nanoparticle a) In the absence of PEG 6000 for the composition (1:3) and b)
In the presence of PEG 6000 for the composition (1:3) (extract: CuSO4)
Fig. 4 Biosynthesized copper nanoparticle in the presence and absence of PEG.
3.6. Effect of pH ascorbic acid present in the extract induces a
The present work shows that the pH of the reduction in the solution pH which was adjusted
solution has an influence on the progress of bio- back in the range from 6 to 12 with addition of
reduction of Copper sulphate solution. The pH of 0.1M NaOH solution. Fig-7 shows UV-Visible
the guava extract, CuSO₄ and PEG on mixing was absorption spectra for the pH ranging from 6 to
found to be 5.4. The probable kinetic 12. The surface Plasmon absorbance of copper
enhancement could also be conducive to a colloids was obtained for all pH except at PH 6.
reduction in crystallite size because of the This probably indicates very small particles at
31
enhancement of the nucleation rate [34]. The such low pH. The Plasmon resonance is clearly
Page
International Journal of Pharmacy and Biological Sciences (e-ISSN: 2230-7605)
G. Caroling*et al Int J Pharm Bio Sci
www.ijpbs.com or www.ijpbsonline.comAvailable Online through
www.ijpbs.com (or) www.ijpbsonline.com IJPBS |Volume 5| Issue 2 |APR-JUN|2015|25-43
visible for pH 8 to 10 at 308 and 294nm this case, there might be some variation in the
respectively. At pH 12, the peak is still detectable arrangement of the capping molecules around
but much weaker when compared with other the copper particles as a consequence of the
pHs. variation in pH. Thus pH is found to be ideal due
The maximum blue shift in SPR peak around the to the appearance of brown color within 30 mins
maximum value at pH 10 could be attribute to because biosynthesized CuNp showed maximum
the decrease in the particle size [35], but the absorption at 294nm which is in agreement with
exact position of the Plasmon absorption may reported values in the literature [4]. Fig-5 shows
depend on several factors (including particle size, the formation of CuNp at different pH.
shape, solvent type and capping agent) and in
Fig.5 Formation of copper nanoparticle at different pH for the ratio1:3 (extract: CuSO 4).
Table 3: Time taken for formation of CuNp at different pH for ratio 1:3(extract: CuSO₄) in the
presence of PEG 6000.
Absorbance
S.No pH Time taken for the formation of Copper Nanoparticles
λmax(nm)
1. 6 1 day 350
2. 8 4 hours 308
3. 10 30 mins 294
4. 12 45 mins 272
32
Page
International Journal of Pharmacy and Biological Sciences (e-ISSN: 2230-7605)
G. Caroling*et al Int J Pharm Bio Sci
www.ijpbs.com or www.ijpbsonline.comAvailable Online through
www.ijpbs.com (or) www.ijpbsonline.com IJPBS |Volume 5| Issue 2 |APR-JUN|2015|25-43
Fig.6 Formation copper nanoparticles at different pH for the ratio (1:3)
3.7. Effect of reaction time nanoparticle synthesis was carried out under
Time is a very important parameter in optimum condition. In order to clarify the
nanoparticle synthesis. As an empirical rule the reaction process the UV-Visible absorption
availability of a larger number of nuclei at a given spectra was recorded for every 10 mins. The
time induces a decrease in the nanoparticle size evaluation of the UV-Visible spectrum is shown
because smaller metal nuclei grow and consume in Fig 8. Initially there was no characteristic
metal ions at the same time. Copper absorption peak.
Table 4: Formation of Copper nanoparticle at different intervals of time.
S.No Reaction Time of Solution (mins) Colour λmax (nm)
1. Immediately after the addition of NaOH Greenish yellow -
2. 10 Dark green -
3. 20 Pale brown 350
4. 30 Brown 294
5. 40 Brown 277
33
Fig.7 UV-Visible spectrum of biosynthesized copper nanoparticles at different intervals of time.
Page
International Journal of Pharmacy and Biological Sciences (e-ISSN: 2230-7605)
G. Caroling*et al Int J Pharm Bio Sci
www.ijpbs.com or www.ijpbsonline.comAvailable Online through
www.ijpbs.com (or) www.ijpbsonline.com IJPBS |Volume 5| Issue 2 |APR-JUN|2015|25-43
From the table-4and fig-8 it is seen that the 3.8. Stability
CuNp were formed within 30 mins exhibited The stability of nanoparticles dispersion is a key
plasmon resonance at 294nm. For 50 and 60 factor in itsapplication. In order to prevent
mins no clear Plasmon resonance was obtained agglomeration of nanoparticles , several capping
despite a clear absorption in the lower range of agent is added in this media. In this work,
wavelength. It suggests a homogenization ascorbic acid present in the guava extract is used
mechanism, which provides a larger number of as both reducing and capping agent along with
nuclei with time. This could indicate a even the protecting agent viz PEG 6000. The ascorbic
smaller particle size. At this moment the acid and PEG stabilized copper nanoparticles
mechanism associate with this phenomenon is dispersion was centrifuged at 8000 rpm for 15
not clearly understood. Ascorbic acid present in mins. It is seen the residue get settled at the
guava extract is well known to scavenge free bottom of the centrifuge tube. The supernant
radicals thus provides anti-oxidant action during liquid was decanted under ambient conditions
copper nuclei formation. This provides the right and no sign of sedimentation was observed even
condition for subsequent rapid reduction by after 15 days of storage. The UV-Visible
phytonutrients, polyphenols along with ascorbic spectrum for the biosynthesized CuNp using
acid and hence copper nanoparticle formation 25ml of the extract and 75ml of CuSO₄ solution
[34]. was recorded over a period of time for 15 days.
There was no change in UV spectrum.
Fig.8 UV-Visible spectra showing stability of biosynthesized copper nanoparticle
There is no change in the SPR and the λmax was This stability against oxidation is likely
found at 294nm without any change. This attributable to the presence of ascorbic acid and
indicates that the ascorbic acid, PEG 6000 PEG which forms a capping layer at the surface
stabilized copper nanoparticle are highly stable of the particle. From the observation (fig 8), it is
due to the extreme capping effect of both the understood that ascorbic acid plays a key dual
ascorbic acid, PEG 6000. role as reducing agent and capping agent. During
34
particle synthesis Cu ions can coordinately bond
Page
International Journal of Pharmacy and Biological Sciences (e-ISSN: 2230-7605)
G. Caroling*et al Int J Pharm Bio Sci
www.ijpbs.com or www.ijpbsonline.comAvailable Online through
www.ijpbs.com (or) www.ijpbsonline.com IJPBS |Volume 5| Issue 2 |APR-JUN|2015|25-43
with carbon and oxygen present in PEG, so that the UV-Visible absorbance spectroscopy of the
the synthesized CuNp are covered by an synthesized CuNp showed single peak at around
adsorbed layer of PEG [35]. 294nm. The surface Plasmon peak of CuNp has
3.9. Characterisation of biosynthesised been reported to appear at around 570nm.
nanoparticle by spectral methods However, when the particle size is less than 4nm,
3.9.1 UV-Visible studies on copper the distinctive Plasmon peak is known to be
nanoparticles broadened and replaced by a featureless
Nanosized particles exhibit unique optical absorbance, which increases monotonically
properties having an exponential-decay Mie towards higher energies [37-39].
scattering profile with deceasing photon energy In our work, the resulting Cu dispersion did not
[36]. UV-Visible absorbance spectroscopy has show a plasmon peak at around 570nm, but
proved to be a very useful technique for studying displayed a broadened peak at a short
metal nanoparticles because the peak positions wavelength, indicating the presence of very
and shapes are sensitive to particle size. The small separated CuNp . In fig 9 showed the UV-
effect of ascorbic concentration in the extract on Visible spectrum for CuNp for the ratio 1:3 [35].
Fig.9 UV-Visible spectrum for the formation of Copper Nanoparticle under optimum conditions.
3.9.2. Fourier Transform-Infrared (FT-IR) reduction, capping of and efficient stabilization
Characterization of the bio-reduced CuNp.
FT-IR spectroscopy was used to investigate the The FT-IR spectra of the guava extract and the
interactions between different species and synthesized CuNp are shown in Fig 10 a and b.
changes in chemical compositions of the The guava extract displays a number of
mixtures. FT-IR measurements of both the adsorption peaks, reflecting its complex nature.
aqueous guava extract and the synthesized dried Terpenoids from the Psidium guajaya L (guava)
copper nanoparticles were carried out to identify can be identified by the strongest peaks of
the possible bio-molecules responsible for the hydroxyl at 3419 cm-1, α, β- unsaturated ketone
35
band at 1710 cm-1, olefinic band at 1610 cm-1,
Page
International Journal of Pharmacy and Biological Sciences (e-ISSN: 2230-7605)
G. Caroling*et al Int J Pharm Bio Sci
www.ijpbs.com or www.ijpbsonline.comAvailable Online through
www.ijpbs.com (or) www.ijpbsonline.com IJPBS |Volume 5| Issue 2 |APR-JUN|2015|25-43
primary and secondary alcohols functionalities observed in the plants extract get narrower and
bands at 1043 cm-1 as well as the peaks around shifted to higher frequently regions, while those
3000 and 1400 cm-1 attribute to aliphatic C-H at around 3000 and 1400 cm-1 attributable to
stretching and bending modes [40]. aliphatic C-H stretching and bending modes
By comparing the spectrum of copper deceased in intensity and shifted to low
nanoparticles with that of the guava extract, we frequency regions. In addition the
can conclude that the two spectra are similar in disappearances of γC=O stretching vibration of the
their spectral features. There is no question, α, β- unsaturated ketone at 1710 cm-1 confirm
therefore, that the compound on the surface of that the reduction and the stabilization of copper
copper nanoparticles has a very close chemical nanoparticles proceed via these groups which
composition to the guava extract of not identical. confirm that water soluble compounds such as
It was found that many peaks obtained by the terpenoids are present in guava extract has the
guava extract have been repeated in the FT-IR ability to perform dual functions of reduction
spectrum of copper nanoparticles with changes and stabilization of copper nanoparticles. A
in the position as well as the intensity of similar observation has been reported by several
absorption. works [41].
The absorption peaks at 3419, 1604, 1107 and
1053 cm-1 corresponding to OH, C=C and C-O
Fig 10 (a) IR spectrum of aqueous guava
36
Page
International Journal of Pharmacy and Biological Sciences (e-ISSN: 2230-7605)
G. Caroling*et al Int J Pharm Bio Sci
www.ijpbs.com or www.ijpbsonline.comAvailable Online through
www.ijpbs.com (or) www.ijpbsonline.com IJPBS |Volume 5| Issue 2 |APR-JUN|2015|25-43
Fig 10(b) IR spectrum of copper nanoparticles
3.9.3. XRD Where D is the mean grain size, λ is the
XRD patterns taken using powder X-ray wavelength of copper target, β is the FWHM of
diffractometer instrument (SEIFERT JSO the diffraction peaks and θ is the diffraction
DEBYEFLEX 2002) in the angle range 10-700 of angle. Thus XRD is commonly used to determine
the copper nanoparticles at 2θ, scan axis 2:1 sys the chemical composition and crystal structure
is shown in fig 11. A number of Bragg reflections of a material.
corresponding to (111), (200) and (220) sets of XRD pattern was taken for both copper
lattice planes are observed, which can be nanoparticle in the presence and the absence of
indexed to face-centered cubic copper [42]. The PEG 6000 (capping or protecting agent). The fig
peaks match with the Joint Committee of 11 a and b shows copper nanoparticle formation
powder Diffraction Standards (File No. 089- in the presence and absence of PEG 6000. In the
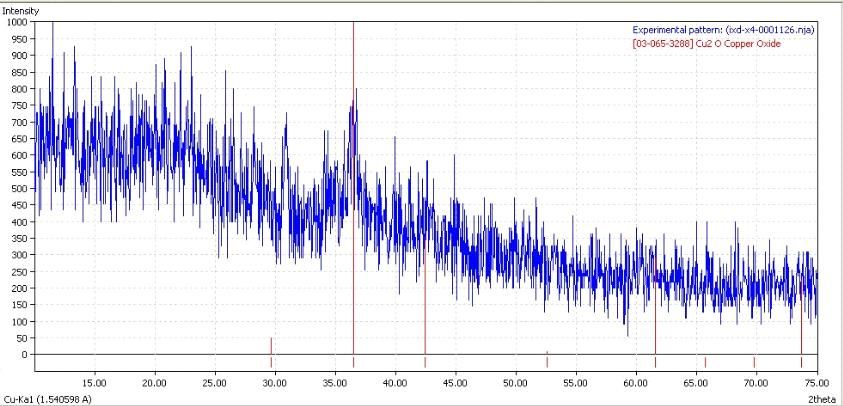
2838), which further proves the formation of absence of PEG 6000 XRD showed that the Cu₂O
crystals of copper nanoparticles. Furthermore, has formed whereas in the presence of capping
the average diameter of the copper or protecting agent ie,PEG 6000 it showed that
nanoparticles is calculated in the range 15-30nm Cu has formed. This clearly proves that PEG 6000
by Scherrer formula using FWHM obtained from plays vital role in the formation of copper
the diffraction peaks: nanoparticles and protects them from oxidation.
D= 0.89λ/βcosθ
Fig.11 (a) XRD spectrum of biosynthesized copper nanoparticle in the presence of PEG 6000
37
Page
International Journal of Pharmacy and Biological Sciences (e-ISSN: 2230-7605)
G. Caroling*et al Int J Pharm Bio Sci
www.ijpbs.com or www.ijpbsonline.comAvailable Online through
www.ijpbs.com (or) www.ijpbsonline.com IJPBS |Volume 5| Issue 2 |APR-JUN|2015|25-43
Fig.11 (b) XRD spectrum of Copper nanoparticle in the absence of PEG 6000
3.9.4. SEM (Scanning electron microscopy) result showed that the diameter of the prepared
Scanning Electron Microscopy provided further nanoparticle was about 15-30nm and the shape
insight into the morphology and size details of is found like flakes as shown in the Fig 12 a and
the copper nanoparticles. The experimental b. Similar phenomenon was reported [43].
Fig 12: SEM image of copper nanoparticles
3.9.5 EDAX copper nanoparticles. Strong signals from the
The EDAX pattern clearly shows that copper copper atoms are observed, while weaker signals
nanoparticle formed by the reduction of copper for C, O, Si, Mg and K atoms were also recorded.
ions using fresh aqueous guava extract are From the EDS signals, it is clear that copper
crystalline in nature (fig 13). The EDAX spectrum nanoparticles reduced by aqueous guava extract
was recorded in the spot-profile mode. The have the weight percentage of elemental copper
optical absorption peak is observed at 8keV, as 75%.
which is typical for the absorption metallic
38
Page
International Journal of Pharmacy and Biological Sciences (e-ISSN: 2230-7605)
G. Caroling*et al Int J Pharm Bio Sci
www.ijpbs.com or www.ijpbsonline.comAvailable Online through
www.ijpbs.com (or) www.ijpbsonline.com IJPBS |Volume 5| Issue 2 |APR-JUN|2015|25-43
Fig.13 EDAX of biosynthesized copper nanoparticles
3.9.6 Transmission electron microscopy (TEM) nanoparticles produced by reduction of cu2+ ions
TEM analysis reveals that the Copper with 2Mm CUSO4 is composed of almost uniform
nanoparticles are predominantly Spherical nanoparticles.
(Fig.14a). The overall morphology of the copper
Fig.14a TEM images of biosynthesised copper nano particle
39
Page
International Journal of Pharmacy and Biological Sciences (e-ISSN: 2230-7605)
G. Caroling*et al Int J Pharm Bio Sci
www.ijpbs.com or www.ijpbsonline.comAvailable Online through
www.ijpbs.com (or) www.ijpbsonline.com IJPBS |Volume 5| Issue 2 |APR-JUN|2015|25-43
Fig.14b Biosynthesised Nanoparticles showing capping ability of aqueous guava extract.
Further the capping ability of guava cu particles are amorphous as can be seen from
nanoparticles was observed (Fig. 14b).Tem the selected area diffraction pattern recorded
image shows selected area electron diffraction from one of the nanoparticles in the aggregate
pattern (SAED) of the copper nanoparticles. The (Fig 14c).
Fig. 14 c selected area electron diffraction pattern (SAED)
3.10 Antimicrobial activity of copper clear zone of inhibition as indicated in the table-
nanoparticles 5 against E.coli and staphylococcus aures. It is
Antimicrobial activity of biosynthesized copper reported that Cu nanoparticles attach to the
nanoparticles was examined out on two surface of the cell membrane, disturbs its
pathogens, such as E.coli (gram –ve) and function and penetrates directly with the
staphylococcus aureus (gram +ve). bacterial outer membrane and release Cu ions.
Biosynthesized copper nanoparticle showed Ciprofloxacin 25μg/ml was used as +ve control.
(a) (b)
Fig.15 Zone of inhibition of green synthesis of CuNps against
(a) E-Coli and (b) Staphylococcus aures.
40
Page
International Journal of Pharmacy and Biological Sciences (e-ISSN: 2230-7605)
G. Caroling*et al Int J Pharm Bio Sci
www.ijpbs.com or www.ijpbsonline.comAvailable Online through
www.ijpbs.com (or) www.ijpbsonline.com IJPBS |Volume 5| Issue 2 |APR-JUN|2015|25-43
Table 5: showing zone of inhibition against bacterial pathogens
Culture name Copper nanoparticle 1500µg 2000µg Pc
E. coli 10 14 24
Staphylococcus aureus - - 22
4. CONCLUSION: [6] K.Gopalakrishnan, C.Ramesh, et al Antibacterial
The present investigation revealed that the fresh activity of cu2o nanoparticles on E.Coli
guava extract is capable of producing copper synthesized from Tridax procubens leaf extract
and surface coating with polyaniline, Digest
nanoparticles that are quiet stable for 15 days at
journal of nanomaterials and Biostructure, Apr-
room temperature without any sign of
Jun 2012;Vol-7: 833-839.
precipitation.
[7] Ratnika Varshney, Seema Bhadauria, et al,
Characterisation of copper nanoparticles
5. ACKNOWLEDGEMENT synthesized by a novel microbiological method.
The authors are thankful to the Instrumentation [8] D.R.Majumder, Bioremidiation: Copper
centre of Ethiraj College for Women nanoparticles from electronic waste,
(Autonomous), Chennai, for recording UV-VIS International Journal of Engineer Science and
and FT-IR spectra. We also thank the University Technology, Oct 2012; vol-4:4380.
of Madras for recording XRD pattern, IIT Madras [9] Y.Wang, M.Chen, F.Zhou and E.ma, nature, 419,
912 (2002)
for SEM and EDAX analysis and Bio Zone Pvt. Ltd.
[10] R.K. Guduru, K.L Murthy, et al, Mater. Sci, Eng. A
463, 14 (2007).
REFERENCES
[11] X. Kang, Z. Mai, et al, Anal. Biochem. 363, 143
[1] Asim Umer, Shahid Naveed, Naveed Ramzan,
(2007).
Muhammad Shahid Rafique, Selection of a
[12] K.B. Male, S.Hrapaic, Anal. Chem. Acta 516,35
suitable method for the synthesis of copper
(2004).
nanoparticles, world publication company, 2021;
[13] Q.Xu, Y.Zhao, et al, Actuators B 114, 379 (2006).
vol-7:1230005-1.
[14] M. L. Kantam, V.s. Jaya, et al, catal.commun.8,
[2] Available at
1963(2007).
http://WWW.aerosols.wustl.edu/aaqrl/Education/..../
[15] S.Vukojevic, O.Trapp, et al, Ange. Chem. Int. Edi
Nanoparticle% 20 synthesis .p...
44, 7879 (2005).
[3] Ipsa subhankari and P.L. Nayak, synthesis of
[16] J.A.Rodriguez, P.Liu, et al, Ange. Chem. Int. Edi
copper nanoparticles using syzygium
46, 1329 (2007).
aromaticium (clove) aqueous extract by using
[17] E.K.Athanassiou, R.N.Grass, et al,
Green Chemistry, World journal of Nanoscience
Nanotechnology, 17, 1668 (2006)
and Technology,2013;2(1):14-17
[18] J.S.Moya, C.Pecharroman, et al,ceram. Soc. 89,
[4] Kantabathi Venkata pavani, Nandigam srujana, et
3043 (2006)
al, Antibacterial activity of Cu20 nanoparticles by
[19] Available at
Aspergillus species, open access journal, 2013;
http://en.Wikipedia.org/wiki/nanoparticle (accessed
vol-2:110-113.
20 oct 2012).
[5] Hyo-Jeoung Lee, Jae Yong Song and Beom Soo
[20] Available at http://en.wikipedia.org/wiki/Robert-
Kim, Biological synthesis of copper nanoparticles
Brown%28 botanist%29 (accessed 20 oct 2012).
using Magnolia kobus leaf extract and their
[21] M.Y.Shen,T.Yokouchi, et al, Physical Review B56
antibacterial activity, Journal of Chemical
(1997) 13066.
Technology and Biotechnology, 8(11), 2013,
[22] Yakui Bai, Tengfei Yang, et al,shape control
41
1971–1977.
mechanism of cuprous oxide nanoparticles in
Page
International Journal of Pharmacy and Biological Sciences (e-ISSN: 2230-7605)
G. Caroling*et al Int J Pharm Bio Sci
www.ijpbs.com or www.ijpbsonline.comAvailable Online through
www.ijpbs.com (or) www.ijpbsonline.com IJPBS |Volume 5| Issue 2 |APR-JUN|2015|25-43
aqueous colloidal solutions, Journal home screening of Psidium Guajava L. Leaf extracts
page:WWW.elsevier.com/locate/power 227 against clinically important Gastrointestinal
(2012):35-42 Pathogens.Ranchi 2012,2(4):524-529.
[23] Available at [33] Baur AW, Kirby WMM, Sherris JC, Turck M,
http://en.Wikipedia.org/wiki/psidium guajava L Antibiotic Susceptibility testing by a
[24] Schmid G (1992) Large Clusters and colloid standardized single disk method. Am J
metals in the embryonic state. Chem., rev 92: Clinpathol. 1996; 45:493-496.
1709-1727. [34] Thi My Dung Dang, Thi Tuyet Thu Le, et al,
[25] Ramgir N, Datta N, et al, Metal oxide nanowires Synthesis and optical properties of copper
for chemiresistive gas sensors: issuses, nanoparticles prepared by a chemical reduction
challenges and prospects.Colloids surf, method, Mar 2011.
Physiocochem Eng Asp. Doi:10.1016/j.colsurfa. [35] Jing Xiong, Ye Wang et al synthesis of highly
2013.02,029. stable dispersions of nanosized copper
[26] Nasser NN, Husein MM (2007) Effect of nanoparticles using L-ascorbic acid, Green
microemulsion variables on copper oxide chem.., 2011, 13 900.
nanoparticle uptake by AOT microemulsions.J [36] S.W.Chen and J.M.Sommers J. Phys.Chem.B,
colloid Interfsci 316:442-450. 2001, 105, 8816-8820.
[27] Kao MJ, LO CH, et al (2007), copper-oxide brake [37] I.Lisiecki and M.P.Pileni,J.Am. Chem.Soc.,
nanofluid manufactured using arc-submerged 1993,115,3887-3896.
nanoparticle synthesis system.J Alloy compd [38] I.Lisiecki and M.P.Pileni,J.Am. Phys.chem. 1995,
434-436: 672-674. 99, 5077-5082.
[28] Chiang CY, Aroh K et al (2012), copper oxide [39] I.Lisiecki and M.P.Pileni, J.Phy.Chem.., 1996, 100,
nanoparticle made by flame spray pyrolysis for 4160-4166.
photo electrochemical water splitting e part 1. [40] Magne Ao, Culioli G, et al (2005), polar a cyclic
Cuo nanoparticle preparation .Int J Hydrogen diterpenoids from Bifurcaria bifurcate.
energy 37:4871-4879. Phytochemistry 66:2316-2323.
[29] Vijayakumar R, Elgamiel R, et al (2001) [41] Y.Abboud, T.Saffaj, et al, Biosynthesis,
sonochemical preparation and characterization characterization and anti bacterial activity of
of nanocrystal-line copper oxide embedded in copper oxide nanoparticles produced using
poly (polyvinyl) and its effect on crystal growth brown alga extract, Spingerlink.com, May 2013.
of copper oxide. Langmuir 17: 1406-1410. [42] Theivasanthi and M.Alagar, X-ray Diffraction
[30] Zhang y,wang s,et al (2006) cuo shuttle like studies of copper nanopowder.
nanocrystals synthesized by oriented [43] Rong Xiao,Nenad miljkovic, et al, Immersion
attachment. J Cryst Growth 291: 196-201. condensation on oil-infused heterogeneous
[31] Wang J, Yang J, et al (2004), Synthesis of copper surfaces for enhanced heat transfer, scientific
oxide nanomaterials and the growth mechanism reports 3, Article no:
of copper oxide nanorods. Mater Des 25:625- 1988/doi:10.1038/srep01988, ISSN (online)
629. 2045-2322 (jun 2013).
[32] Sushmita Choudhury, Latika Sharan, Manoranjan
Prasad sinha Phytochemical and Antibacterial
42
Page
International Journal of Pharmacy and Biological Sciences (e-ISSN: 2230-7605)
G. Caroling*et al Int J Pharm Bio Sci
www.ijpbs.com or www.ijpbsonline.comAvailable Online through
www.ijpbs.com (or) www.ijpbsonline.com IJPBS |Volume 5| Issue 2 |APR-JUN|2015|25-43
*Corresponding Author:
gcaroling@yahoo.com
43
Page
International Journal of Pharmacy and Biological Sciences (e-ISSN: 2230-7605)
G. Caroling*et al Int J Pharm Bio Sci
www.ijpbs.com or www.ijpbsonline.comYou can also read


