Automatic building accessibility diagnosis from point clouds
←
→
Page content transcription
If your browser does not render page correctly, please read the page content below
Automatic building accessibility diagnosis from point
 clouds
 J. Baladoa*, L. Díaz-Vilariñoa,b, P. Ariasa, M. Soilána
 a
 Applied Geotechnologies Group, Dept. Natural Resources and Environmental Engineering, University of Vigo, Campus Lagoas-
 Marcosende, CP 36310 Vigo, Spain

 b
 GIS Technology, OTB Research Institute for the Built Environment, Delft University of Technology, Julianalaan 134, 2628 BL
 Delft, The Netherlands

Abstract

Building accessibility diagnosis is of high interest especially in case of people with reduced mobility.
This paper proposes a methodology for automated detection of inaccessible steps in building façade
entrances from MLS (mobile laser scanner) data. Our approach uses the MLS trajectory to automatically
subdivide urban point clouds into regular stretches. From each stretch, the lower zone of façade is isolated
and selected as region of interest. Points belonging to vertical elements are projected onto a 2D image and
steps are detected and classified as inaccessible areas according to the comparison of geometrical features
such as height jump, proximity to ground and width, with regulation. The methodology has been tested in
four real datasets, which constitute more than 400 meters of different urban scenarios. Results exhibit a
robust performance under urban scenes with a high variability of façade geometry due to the presence of
different entrance types to shops and dwellings. Results have been quantitatively evaluated and they show
global F1 value around 93%. Moreover, the methodology is very fast since 100 m are processed in less
than 2 minutes.

Keywords: building accessibility, building information modelling, indoor-outdoor seamless, 3D data
processing, obstacle detection, point clouds, Mobile Laser Scanning, 3D urban as-built.

 1. Introduction

Due to the increasing availability of 3D point cloud data and acquisition systems, the automated
processing of point clouds has emerged as a research topic of a great interest for communities involved in
the study of the as-built environment. The reconstruction of digital 3D urban environments is useful for
many applications: large scale city modelling for tourism, gaming or visualization purposes [1,2], road
and road markings modelling for road inventory and planning [3,4] or control and construction
monitoring [5,6]. Within the broad set of applications requiring 3D data, there are of special relevance
those applications which used to use 2D data such as path planning and accessibility analysis.

Accessibility to public spaces, including public buildings, is manifested as indispensable by the United
Nations convention on the rights of persons with disabilities [7]. Accessibility is of special interest for
people with reduced mobility (PRM), being included in this group not only wheelchair people, but also

*
 Correspondig autor.
E-mail address: jbalado@uvigo.es (J. Balado), lucia@uvigo.es l.diaz-Vilarino@tudelft.nl (L. Díaz-Vilariño),
parias@uvigo.es (P. Arias), msoilan@uvigo.es (M. Soilán).
people with intellectual or physical disabilities [8]. It is of high importance the fact of ensuring
compliance of the same rights for people with and without reduced mobility [9].

In recent years, PRM’s rights have gained strength and better awareness in the society. Governments are
echoing about this awareness, cities are being reconstructed according to international standards [10] in
order to make them more accessible [11] and legislation is being updated to protect the rights of people
with reduced mobility. These actions are not limited to urban zones, many routes in nature environments
have been adapted for wheelchairs and tourism companies offer activities for disabled people.

As-built environments in which this transformation has not been applied yet, the integration of people
with reduced mobility is promoted with different initiatives. Rashid et al. [12] developed an app for
mobile phones to collect and match obstacles on sidewalks. In this way, wheelchair users can evade them
changing their route. Virtual reality is created to substitute the access to historical and protected
environments that cannot be modified. Within the project PATRAC of European Union, Mancera-
Taboada et al. [13] explained the process of converting an urban historical centre (San Martin’s Church)
from point cloud acquired with a TLS to a digital model that can be virtually visited.

Robotic community also supports solutions to accessibility problems. Non-legged robots have the same
mobility problems that PRM, so many solutions for these robots are applied to people through the
development of novel platforms to help people climbing stairs. One example of this is presented in [14],
in which wheels of a wheelchair were replaced by a self-propelled robot platform, composed of four
triangles with wheels geometrically positioned according to steps to be climbed. If the person does not
have to sit, an erect platform to detect and climb stairs holding a person has been designed by Luo et al.
[15].

In the context of as-built environments, accessibility is usually studied from an indoor [16,17] or from an
outdoor point of view [18]. However, transition zones between indoors and outdoors such as building
entrances along façade lines is of particular relevance. Building entrances give access to both private and
public environments such as shops, offices, residential buildings, etc. Most of existing literature
addressing the reconstruction of urban façade lines focus on extracting the contour of the façade [19] or
its openings, both doors and windows [20–25] while no literature has been found addressing accessibility
to buildings.

The aim of this work is to develop a preliminary automated methodology to analyse building accessibility
from urban point clouds. The approach is based on detecting steps, accessibility barriers, in the lower
zone of facades that correspond with the zone of the building entrances. The methodology departs from
point clouds acquired with a Mobile Laser Scanner (MLS). MLS trajectory is used to segment the point
cloud in stretches, from which a region of interest is isolated by the crossing ground plane with the façade
plane. At last, the steps in entrances are detected from projecting vertical elements in a 2D image and
from comparing specific geometric features with regulations. The methodology is tested in four real
datasets and results are quantitatively evaluated.

This paper is organized as follows. Section 2 collects related work about accessibility in urban
environments, façade processing and MLS trajectory use. Section 3 presents the designed methodology.
Section 4 is devoted to show and discuss the results obtained from applying the methodology to datasets
and Section 5 addresses the main conclusions extracted from the work.
2. Related work

Façade detection and modelling is one of the main research topics when processing 3D point clouds of
urban environments. In the recent years, several papers address this issue. Serna et al. [26] segment
façades in point clouds using raster images and morphological operators. They project the point cloud in
two dimensions and create an image based on the height of the points. Pixels with highest variation are
classified as trees or facades. To differentiate between them, they use height profiles with attributes such
as density, the number of point, etc. This methodology offers a robust façade segmentation under
different conditions of data quality and under the presence of other elements in the environment. A
similar methodology is introduced by Hernández and Marcotegui [27]. They analyse the height profile of
buildings to isolate 3D city blocks. Hammoudi et al. [28] extract façade lines using MLS trajectory and
Probabilistic Hough Transform. A façade line in a street is assumed as a dominant vertical plane in the
point cloud oriented in the direction of MLS trajectory. In addition, they separate street façades in clusters
associated with each building and produce CAD models. Schmittwilken and Plümer [29] reconstruct 3D
façade elements (including doors and stairs) with a methodology based on prior knowledge. They take
photos of objects in the facades and use probability density functions to find through a decision tree the
3D elements in a facade point cloud. The stair detection is based on the repetition of parameters of each
tread and their perpendicular condition to façade. Once objects are detected, their boundaries are
estimated. With this methodology they locate facade elements, estimate dimensions and make an
accessibility diagnosis with high precision.

Accessibility diagnosis in outdoors is treated by Serna and Marcotegui [18]. They detect curbs in gradient
images obtained after rasterizing point clouds. A morphological operator is implemented to complete
curbs when they are affected by occlusions in the point clouds. Thus, they obtain a raster image of the
ground in which curbs are located. Curbs are considered as architectonic barrier to wheelchairs. This
methodology is not applicable to the detection of entrance steps because elevated points of facades would
hide coplanar steps when the raster is applied to create gradient images. Operations in urban
environments such as the already mentioned façade segmentation [26], accessibility analysis [18], and
any operation related to soft mobility are recompiled and proved over a benchmark into the project
TerraMobilita/iQumus [30]. Another way to perform accessibility analysis is based on using a buffer.
Díaz-Vilariño et al. [17] model indoor point clouds to path planning and, with a 3D buffer representing
the dimensions of a person, they plan the shortest route saving obstacles. Instead of buffers, robots can be
equipped with laser to calculate routes and analyse their accessibility in real time. For example, the non-
legged robot platform developed by Zhang et al. [31] use a 2D laser to detect steps. Humanoid robots
need more detailed information about stairs to climb them, so calculate in real time their features (as step
number, height, orientation, depths, etc.) with statistics [32] or range images, region growing and planar
detection [33]. The limitation of the use of buffers and the performance implemented by robots is that
accessibility is locally analysed, that is in areas along their trajectory. Therefore, they do not perform
global analysis of the 3D scene.

With regard to previous approaches (summarized in Table 1), the authors present a methodology to
automatically detect accessibility barriers in building entrances from Mobile Laser Scanning data. There
are not other works that directly treats this theme in a large scale of urban environments. The aim is to
work directly in street point clouds, analysing the façade along it and searching steps in building
entrances without a previous phase of door/entrance detection. MLS trajectory contributes with
information about building and ground distribution and it allows to work directly with street point clouds
in an efficient and fast time processing, focusing the detection only in the low zone of façades and
combining the processing of large urban point clouds with robot approaches.
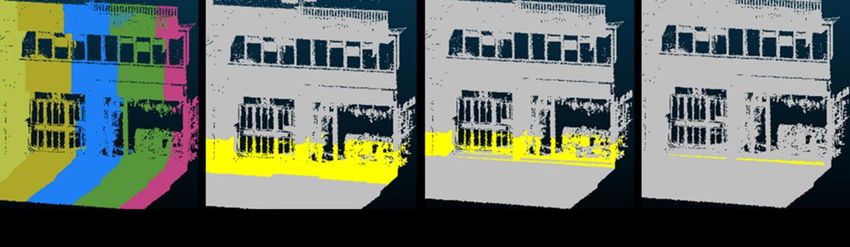
Table 1. Comparative table of the related work summary.

 Indoor / Trajectory Door
 Point cloud Accessibility
 outdoor information detection
 Not
Serna et al. [26] MLS Street Outdoor No No
 necessary
Hernández and
 MLS Street Outdoor No No No
Marcotegui [27]
Hammoudi et al. [28] MLS Street Outdoor Yes (MLS) No No
Schmittwilken and
 TLS Facade Outdoor No Yes Yes (stairs)
Plümer [29]
Serna and Marcotegui
 MLS Street Outdoor No No Yes (curbs)
[18]
 Yes
Díaz-Vilariño et al. [17] TLS Room Indoor Yes (buffer) No
 (obstacles)
 Immediate
 Indoor/ Yes (stairs &
Zhang et al. [31] robot Yes (robot) No
 outdoor obstacles)
 surrounding
 Immediate
 Indoor / Yes (stairs &
Luo et al. [32] robot Yes (robot) No
 outdoor obstacles)
 surrounding
 Immediate
 Indoor / Yes (stairs &
Oßwald et al. [33] robot Yes (robot) No
 outdoor obstacles)
 surrounding
Present work MLS Street Outdoor Yes (MLS) No Yes (steps)

 3. Methodology

The methodology starts by segmenting point cloud in stretches using the trajectory of the MLS. Then, the
region of interest (ROI) is located and isolated from each stretch. Finally, steps are detected in entrances
along the façade line and their accessibility is evaluated. Fig. 1 shows the workflow of the methodology.

 Fig. 1. Workflow of the methodology.

 3.1. Trajectory segmentation

MLS trajectory consists of a set of points recorded by the navigation system of the vehicle [34] that
represents the line along the MLS has been moved during the acquisition. Size of the trajectory input is
much smaller than a street point cloud. For example, for the same scene trajectory can be represented by a
few thousand of points while point cloud is composed millions of points. Therefore, working with
trajectory points is more effective in terms of time and computer resources.
MLS systems are generally mounted in cars or vans. So, trajectory generally corresponds with the road
street along the façade line. In this approach, the authors are using this assumption to segment street point
clouds in regular spaces (similar size) to work directly with in the point cloud without depending on total
longitude of the street [35]. Trajectory also gives information about the tilt of the street.

The first phase in trajectory segmentation consists on dividing trajectory = ( , , ), represented as a
dotted line in Fig. 2.a, at regular intervals searching neighbour points in a distance l (Fig. 2.b). Next,
trajectory is transformed into vectors = ( , , ) (Fig. 2.c) such that ‖ ‖ ≈ and let =
 ( + ) − ( ). At last, the point cloud = ( , , ) is loaded and segmented in = { , … }
perpendicular at the final point to each vector = { :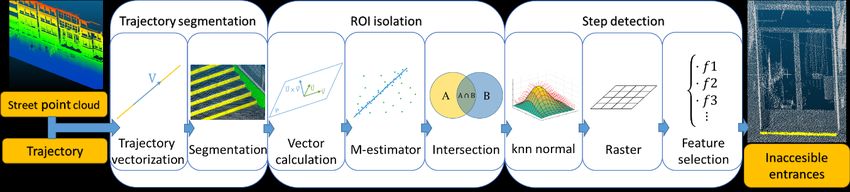
Fig. 3. Street sectional view. Intersection of ground and façade planes forming the ROI.

 Fig. 4. Vectors extracted from MLS trajectory in each stretch. V is obtained from trajectory
 segmentation is defined perpendicular to , and is the cross product between both.

 Fig. 3. In yellow, points belonging to a) ground set, b) façade set, c) ROI.

 3.3. Step detection

The last phase of the methodology consists on analysing building accessibility from detecting steps in the
ROIs of each stretch. Steps are vertical planes, so points belonging to them have horizontal normals with
regard to their neighbours. In this paper, normals are calculated from the closest 25 neighbours searched
with a KNN search; this neighbouring size offers a good solution to prevent noise. The use of a smaller
size (from 5 to 15 number of points) was tested and it reflected an increase of the normal variance caused
of local deformations and rough texture of the elements. The normals = ( , , ) must be
calculated for all points in the ROI and vertical points are selected = { : < . } and rasterised.
By rasterising only vertical points, computing time is saved and points that belonging to horizontal
regions are not wrongly selected on the pixels.
Before raster process, vertical points W are adjusted to the raster grid using a rotation matrix (Eq. 1)
around the Z axis. The rotation adjusts the raster grid in the direction = − ( ⁄− ) of the
façade vector. Raster process consists of transforming 3D geometric information into a 2D image [37].
3D points are projected over a grid (the future image pixels). The pixel size is established in 10cm. Height
jump and mean height of points are saved in each pixel for the step detection into pixels.
cos(αi ) −sin(αi ) 0
Hi = Wi R i = Wi [ sin(αi ) cos(αi ) 0] (1)
0 0 1
Height jump is calculated as the height difference between the points with the maximum and minimum
height in each pixel. This variable is used to select pixels belonging to steps. The minimum and maximum
height jump are defined at Section 4.2. Fig. 6 shows the raster process and the selection of pixels
according to the previous statement.
Fig. 4. Raster process and height jump selection: a) perspective of a ROI; b) height jumps are assigned to
pixels – those pixels belonging to steps are coloured in green-.
Mean height is related to the distance between a step and the ground. Inaccessible entrances have, at least,
one step adjacent to the floor. The condition of ground proximity eliminates points with the same
geometry than steps, but with an elevated position. For this analysis, it is necessary to consider the Z
component of the ground. For each stretch, it is calculated by using the quantile 25 of the height of points
belonging to ground plane in the previous phase (Section 3.2), making it more robust to ground
occlusions or poor density. Only those steps close to the ground are acting as barriers to accessibility. Fig.
7 illustrates the raster process, the selection of pixels belonging to step candidates according to height
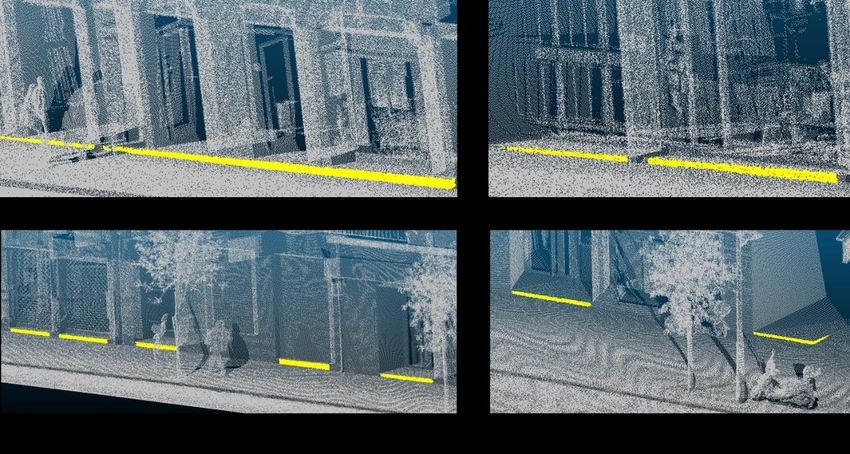
jump and the selection as inaccessible steps those close to ground in a complex entrance.Fig. 5. Raster process, height jump selection taking into account floor proximity. a) perspective view of a ROI; b) height jumps are initially assigned to pixels and floor candidates are coloured in green; c) height jumps are corrected taking into account the proximity to floor – final steps are coloured in green while discarded steps are coloured in red-. At last, the points (into pixels) detected in previous phases must be joined with others forming a step with a minimum width according to the free passage surface of an entrance, that enables a comfortable access to buildings. To verify this, points are grouped by proximity, using the connected component segmentation and forming a mesh with a max distance of 200mm between adjacent points to prevent small occlusions. Then, the width of each group is calculated as the distance between the two most distant points in the plane XY. If the distance is less than the free passage surface, that group is deleted. In this process points belonging to false steps are deleted, for example, feet or advertising posters near of entrances in the ROI. 4. Experiments 4.1. Datasets The methodology was tested in four real case studies. The datasets 1 and 2 (Fig. 8.a and 8.b) are located on Florida Avenue in Vigo and they are straight streets of 75 and 120 meters respectively, with trees on sidewalks and building entrances to shops and dwellings. The dataset 3 (Fig. 8.c) is located on the Pizarro street in Vigo. It is a curved street with a longitude around 150 meters and with the same characteristics that datasets 1 and 2. The dataset 4 (Fig. 8.d) is located in Quiroga-Ballesteros street in Lugo. In this case, it corresponds with a straight pedestrian zone in the historical centre with a longitude around 70 meters. All datasets were acquired using MLS LYNX Mobile Mapper of Optech [38]. Technical specifications of the MLS system are summarized in Table 2.
Fig. 6. Datasets: a) Vigo – Florida 1, b) Vigo – Florida 2, c) Vigo – Pizarro, d) Lugo – Quiroga
 Ballesteros

Table 2. Technical specifications of MLS LYNX Mobile Mapper.

Technical specifications MLS LYNX Mobile Mapper
Measuring principle TOF
Maximum range 200 m (@ ρ20%)
Range precision 8 mm, 1σ
Range accuracy ±10 mm, (1σ)
Laser measurement rate 75–500 kHz
Measurement per laser pulse Up to 4 simultaneous
Scan frequency 80–200 Hz
Laser wavelength 1550 nm (near infrared)
Scanner field of view 360º
Angular resolution 0.001º

Density varies with the laser pulse repetition rate of the scanner, the scan speed (lines per second), the
vehicle´s driving speed and the measurement distance (Puente et al, 2013). Fig. 9 shows the variation of
point density according to distance measurement for an acquisition in which scanners were operated at the
maximum PPR and vehicles were driving at 50km/h. Eq. 2 shows the relation between the previous
parameters. From this equation, and taking into account that acquisition was made from a distance from a
distance between ROI and MLS of 6 meters, a vehicle’s driving speed of 20km/h, the density in the ROI
is 3300 points/ meter2, which corresponds with data density obtained experimentally from datasets.

Fig. 9. Variation of point density according to distance measurement for an acquisition in which scanners
 were operated at the maximum PPR and vehicles were driving at 50km/h. (Puente et al., 2013)

 PPR
D= (2)
 2πrv
 D = density
 PRR = pulse repetition rate
 r = distance from the instrument
 v = speed

 4.2. Results and discussion

A step is defined as a vertical element adjacent to floor with a height jump between a maximum and a
minimum threshold. There is not a common regulation to considerer which is the minimum height jump
to a step, but many countries have similar measures [39]. In this context, a step with 20mm height is
considered inaccessible in France, Germany and Netherlands, while England, Ireland and Scotland are
more restrictive establishing as inaccessible a step with 15mm. On the other side, the maximum height
jump for a step is defined by the ISO-21542 [10] in 150mm. As most of cases buildings are constructed
previously to this regulation, in this work the authors assume the maximum height jump in 200mm
(covering existing buildings) and the minimum in 15mm being in accordance with the most restrictive
regulation. This means that a height jump smaller than 15mm is considered accessible and a height jump
bigger than 200mm is not considered a step. In order to select steps close to the ground and not
baseboards or shop windows, a maximum distance to ground is established in 20 cm. The minimum free
passage surface is a feature commonly addressed in regulations such as ISO-25142. According to it, the
minimum width of an entrance is set in 800mm.

Data quality, and more specifically data density, has an influence in the methodology performance. To
determine which is the minimum point density necessary to ensure a correct detection of 15mm steps (the
more restrictive case), an empirical test has been carried out. A point cloud with a step of dimensions
150mm x 15mm and density of 550 mil points/meter2 has been subsampled until no points were correctly
classified (Fig. 10). Results show a stable success rate until a distance between points of 3.5mm (65 mil
points/meter2). The operation of normal estimation based on KNN search limits the number of points well
classified by vertical regions, used in the posterior raster. In view of the results, the point cloud density in
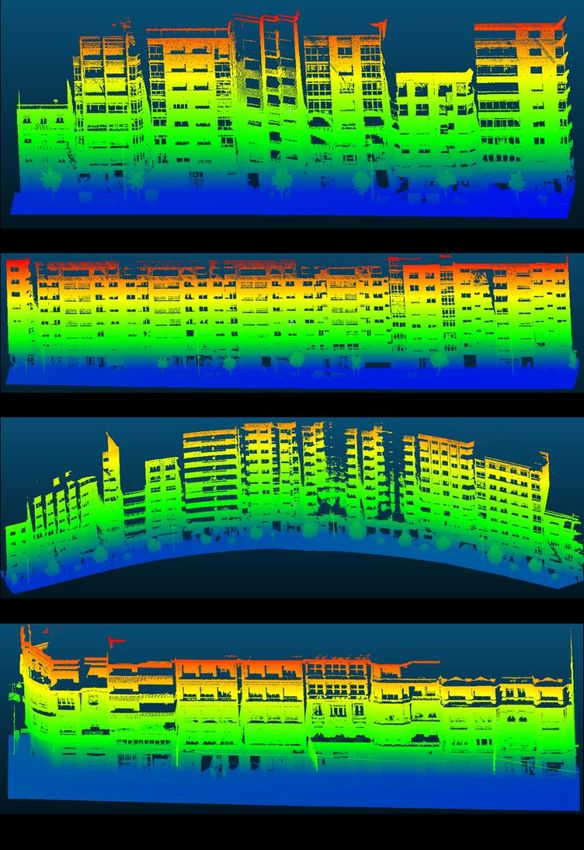
the ROI (3300 points/meter2) is not enough for acquiring the most restrictive steps (15 mm). With this
resolution it is only possible to extract steps with a minimum height jump of 65mm.

 Fig. 10. Comparison between point density and correct point detection.

The Fig. 11 shows a fragment of a street point cloud through the methodology phases. First, in the
trajectory segmentation the street is segmented in stretches (each stretch is in a random colour in Fig.
11.a). Next, the sets of points of ground and façade are intersected forming the ROI (in yellow in Fig.
11.b). The normal of points in the ROI are calculated and the points that belong to vertical regions are (in
yellow in Fig. 11.c) are rasterised and applied connected components to detect the steps (Fig. 11.d).

 Fig. 11. Street point cloud through methodology phases: a) trajectory segmentation, b) ROI isolation, c)
 points belonging to vertical regions, d) step detection

Results are quantified as the number of points belonging to steps that are correctly classified. Each dataset
is processed according to the proposed methodology and results are compared with a reference point
cloud in which steps are manually segmented [40]. The evaluation method is based on precision, recall
and F1 indices [41]. Precision (Eq. 3) represents the relation between TP (true positives) and all positives,
recall (Eq. 4) represents the relation between TP and real step points (true positives and false negatives),
and F1 (Eq. 5) balances precision with recall.

 |TP|
 = (3)
 |TP| + |FP|
 |TP|
 = (4)
 |TP| + |FN|
 x
 1 = 2 x (5)
 +
Results of the quantitative evaluation are shown in Table 3. Precision varies between 89% in datasets 1
and 3 and 99% in datasets 2 and 4. Results are not related with the size of the dataset (datasets 1 and 4 are
shortest than 2 and 3) or the building style (datasets 1 to 3 have modern buildings and dataset 4 has
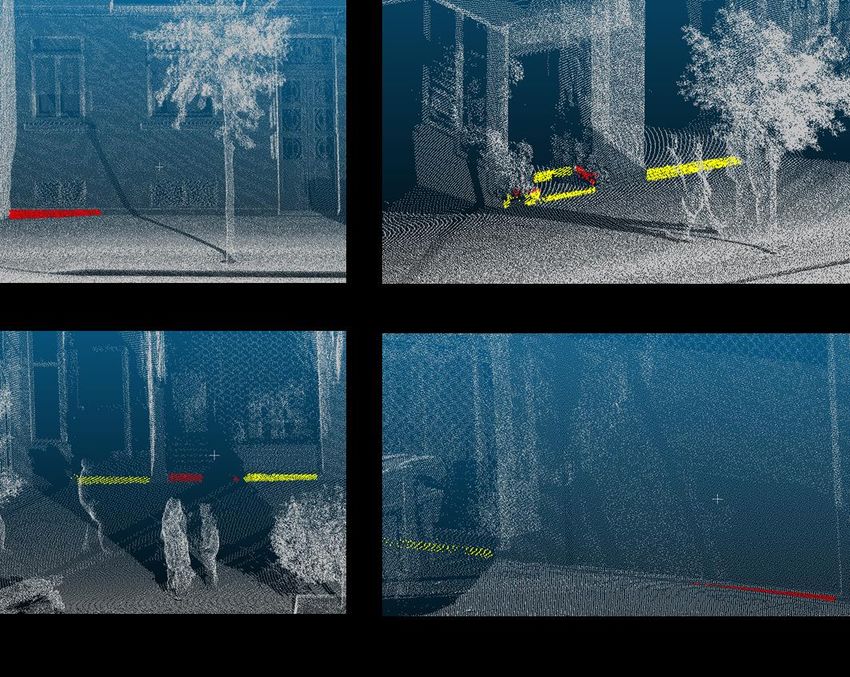
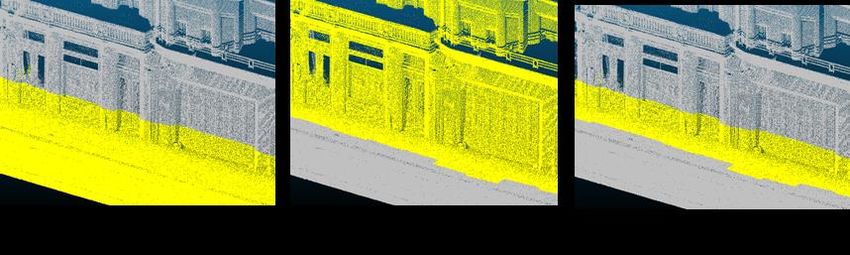
historical buildings and a pedestrian street). Recall index quantifies false negatives, important in largest
streets (datasets 1 to 3), where there are façades zones without any real step, composed mainly by walls
and accessible entrances. Relation between precision and recall indicates that the methodology tends to
over-detection (5%). In summary, the overall success rate (F1) is 93%. The code was run on an Intel Core
i7 CPU 3.40 GHz with 16GB RAM using MATLAB. The most processing time was only 124 seconds in
dataset 2 (120 meters), a very short time enabling its use in large urban point clouds.

Table 3. Results

 street computing
 TP FP FN precision recall F1
 length time
Dataset 1 5940 769 399 88,54% 93,71% 91,05% 75m 65s
Dataset 2 16269 112 2461 99,32% 86,86% 92,67% 120m 124s
Dataset 3 7079 839 1927 89,40% 78,60% 83,66% 150m 101s
Dataset 4 13079 195 123 98,53% 99,07% 98,80% 70m 58s
TOTAL 42367 1915 4910 95,68% 89,61% 92,55% 415m 347s

Results show a good performance under different geometric scenarios. Fig. 12 shows several point clouds
in which the detected steps are coloured in yellow for visibility purposes. In Fig. 12.a, a continuous step
with variable height is correctly detected, the step is higher in the right zone than the left zone of the
figure. Also, the methodology demonstrates good results in inclined streets and steps with small height
(Fig. 12.b). When the entrances have doors or bars closed, steps are detected correctly (Fig. 12.c). In Fig.
12.d, there are not false detection in trees or vehicles because these elements are out of the ROI where
steps are searched.

 Fig. 12. Steps detected correctly

In the four datasets, a low error rate is found. On balance, the errors have not one unique cause. Building
baseboards or showcase bases can be confused with the steps (Fig. 13.a) if they have the same geometry.
Entrances are transition zones, so if there are objects or people on stairs, steps can be incorrectly detected
(Fig. 13.b). When the objects or the people are in front of the steps, they produce occlusions in steps,
breaking their continuity and dimensions (Fig. 13.c). Also, in the cloud always there are zones with local
density variations, if these zones correspond with small steps, they cannot be detected correctly (Fig.
13.d).

 Fig. 13. Steps detected incorrectly

 5. Conclusions

In this paper, an automatic method to detect steps in building entrances and their accessibility is
presented. The methodology begins using the MLS trajectory to subdivide street point cloud in stretches.
In each stretch lower zone of the façade is isolated as ROI, intersecting the ground and the façade planes.
At last, points belonging to vertical elements in each ROI are rasterised and steps are detected based on
the features height jump, proximity to the ground and step width.

The methodology was tested in four real datasets, including a curved street and a street in a historical city
centre, with different types of entrances to dwellings and shops. The 93% of the points belonging to steps
were correctly detected, even steps with complex form and near of closed doors and bars. Precision and
recall indices also demonstrate a robust performance in urban zones, (96% and 90% respectively). The
dimensions of the detected steps in search algorithm can be modified according with regulations of each
country. In the most restrictive case (British regulations), steps with more than 15mm can be detected if
the point cloud has enough density in the low façade zones. According to density of ROI in datasets, steps
can be detected from 65mm of height.

In the light of the state of art, the present work is focused on a theme not covered by the papers compiled
in Section 2. In most works about urban point cloud processing, the elements classified are more generic.
Few papers segment ground in different elements, but they are not focused in building accessibility. With
regard to façade modelling, the elements searched are windows, balconies and doors without detailing if
the doors have steps and analysing façades separately. Unlike, the developed approach is automatic and it
analyses entire streets, detecting steps along façade lines. It is not dependent on the previous detection
and extraction of doors, so it is not necessary colour, searching entrance gaps or a lot of samples to train
an algorithm for machine learning. Also, the methodology uses trajectory information, saving time
computing (with 100 meters of street processed in less than 2 minutes) and it can be used on inclined
streets.

As future work, this methodology can be completed with a ramp detection and different information can
be extracted of ramps and steps and their entrances associated: number and height of steps, ramp
inclination, analysis of regulatory compliance, classify entrances in accessible or inaccessible, etc. This
information may be used to enrich city models and create smart cities. The steps detected with this
method are georeferenced. Combined with a map where shops and number of buildings are registered and
expanded the method with a ramp detection, the methodology may provide if a specific entrance is
accessible or not and extract statistics about number of entrances and inaccessible meters in a street, even
in a city, essential information to PRM.

 6. Acknowledgements

Authors would like to thank to SCI-EYSA for the financial support given through the University Chair in
Smart cities and road safety (Cátedra SCI-EYSA. Smart cities e seguridade vial), to Xunta de Galicia for
the financial support given through human resources grant (ED481B 2016/079-0), to the Ministerio de
Economia y Competitividad -Gobierno de España- (TIN2016-77158-C4-2-R) and to the European Union
–H2020- (ENGINENCY). The statements made herein are solely the responsibility of the authors.

 7. References and Notes

[1] C.A. Vanegas, D.G. Aliaga, B. Benes, Automatic extraction of Manhattan-World building masses
 from 3D laser range scans, IEEE Transactions on Visualization and Computer Graphics. 18
 (2012) 1627–1637. doi:10.1109/TVCG.2012.30.
[2] R. Lakaemper, A.M. Malkawi, Integrating Robot Mapping and Augmented Building Simulation,
 Journal of Computing in Civil Engineering. 23 (2009) 384–390. doi:10.1061/(ASCE)0887-
 3801(2009)23:6(384).
[3] M. Soilán, B. Riveiro, J. Martínez-Sánchez, P. Arias, Automatic road sign inventory using mobile
 mapping systems, International Archives of the Photogrammetry, Remote Sensing and Spatial
 Information Sciences - ISPRS Archives. 41 (2016) 717–723. doi:10.5194/isprsarchives-XLI-B3-
 717-2016.
[4] V. Balali, M. Golparvar-fard, Evaluation of Multiclass Traffic Sign Detection and Classification
 Methods for U . S . Roadway Asset Inventory Management, ASCE Journal of Computing in Civil
 Engineering. 30 (2015) 1–16. doi:10.1061/(ASCE)CP.1943-5487.0000491.
[5] L. Díaz-Vilariño, B. Conde, S. Lagüela, H. Lorenzo, Automatic detection and segmentation of
 columns in as-built buildings from point clouds, Remote Sensing. 7 (2015) 15651–15667.
 doi:10.3390/rs71115651.
[6] H. Son, F. Bosché, C. Kim, As-built data acquisition and its use in production monitoring and
 automated layout of civil infrastructure: A survey, Advanced Engineering Informatics. 29 (2015)
 172–183. doi:10.1016/j.aei.2015.01.009.
[7] UN, Convention on the rights of persons with disabilities, (2007). http://www.un.org/disabilities/.
[8] EC, Regulation (EC) No 1107/2006 of the european parlament and of the council concerning the
 rights of disabled persons and persons with reduced mobility when travelling by air, Official
 Journal of the European Union. 1107 (2006) 1–9.
[9] Parliament of the United Kingdom, Disability discrimination act, In Practice. 18 (1995) 76.
 doi:10.1136/inpract.18.7.345-d.
[10] ISO, ISO-25142 Building construction — Accessibility and usability of the built environment,
 ISO International Organization for Standardization. (2011).
[11] R.A. La Rocca, Soft Mobility and Urban Transformation, TeMaLab Journal of Mobility, Land
 Use and Environment. 3 (2010) 85–90.
[12] O. Rashid, A. Dunbar, S. Fisher, J. Rutherford, Users helping users: User generated content to
 assist wheelchair users in an urban environment, in: ICMB and GMR 2010 - 2010 9th
 International Conference on Mobile Business/2010 9th Global Mobility Roundtable, Athens,
 Greece, 2010: pp. 213–219. doi:10.1109/ICMB-GMR.2010.73.
[13] J. Mancera-Taboada, P. Rodríguez-Gonzálvez, D. González-Aguilera, J. Finat, J. San José, J.J.
 Fernández, J. Martínez, R. Martín, From the point cloud to virtual and augmented reality: digital
 accessibility for disabled people in San Martin’s Church (Segovia) and its surroundings, in: 2011
 International Conference on Computational Science and Its Applications, Santander, Spain, 2011:
 pp. 303–317. doi:10.1007/978-3-642-21887-3.
[14] L.A.M. Riascos, A low cost stair climbing wheelchair, in: 2015 IEEE 24th International
 Symposium on Industrial Electronics, 2015: pp. 627–632.
[15] R.C. Luo, M. Hsiao, T. Lin, Erect Wheel-Legged Stair Climbing Robot for Indoor Service
 Applications, in: 2013 IEEE/RSJ International Conference on Intelligent Robots and Systems
 (IROS), Tokyo, Japan, 2013: pp. 2731–2736.
[16] M. Hashemi, H.A. Karimi, Indoor Spatial Model and Accessibility Index for Emergency
 Evacuation of People with Disabilities, 30 (2010) 1–16. doi:10.1061/(ASCE)CP.1943-
 5487.0000534.
[17] L. Díaz-Vilariño, P. Boguslawski, K. Khoshelham, H. Lorenzo, L. Mahdjoubi, Indoor navigation
 from point clouds: 3D modelling and obstacle detection, The International Archives of the
 Photogrammetry, Remote Sensing and Spatial Information Sciences. XLI-B4 (2016) 275–281.
 doi:10.5194/isprsarchives-XLI-B4-275-2016.
[18] A. Serna, B. Marcotegui, Urban accessibility diagnosis from mobile laser scanning data, ISPRS
 Journal of Photogrammetry and Remote Sensing. 84 (2013) 23–32.
 doi:10.1016/j.isprsjprs.2013.07.001.
[19] H. Aljumaily, D.F. Laefer, D. Cuadra, Big-Data Approach for Three-Dimensional Building
 Extraction from Aerial Laser Scanning, Journal of Computing in Civil Engineering. 30 (2015)
 4015049. doi:10.1061/(ASCE)CP.1943-5487.0000524.
[20] S. Pu, G. Vosselman, Knowledge based reconstruction of building models from terrestrial laser
 scanning data, ISPRS Journal of Photogrammetry and Remote Sensing. 64 (2009) 575–584.
 doi:10.1016/j.isprsjprs.2009.04.001.
[21] W. Nguatem, M. Drauschke, H. Mayer, Localization of windows and doors in 3D point clouds of
 facades, ISPRS Annals of the Photogrammetry, Remote Sensing and Spatial Information
 Sciences. II-3 (2014) 87–94. doi:10.5194/isprsannals-II-3-87-2014.
[22] M. Previtali, L. Barazzetti, R. Brumana, B. Cuca, D. Oreni, F. Roncoroni, M. Scaioni, Automatic
 façade modelling using point cloud data for energy-efficient retrofitting, Applied Geomatics. 6
 (2014) 95–113. doi:10.1007/s12518-014-0129-9.
[23] C. Cabo, S. García Cortés, C. Ordoñez, Mobile Laser Scanner data for automatic surface
 detection based on line arrangement, Automation in Construction. 58 (2015) 28–37.
 doi:10.1016/j.autcon.2015.07.005.
[24] S.M. Vieira, A. Silva, J.M.C. Sousa, J. De Brito, P.L. Gaspar, Modelling the service life of
 rendered facades using fuzzy systems, Automation in Construction. 51 (2015) 1–7.
 doi:10.1016/j.autcon.2014.12.011.
[25] X. Xiong, A. Adan, B. Akinci, D. Huber, Automatic creation of semantically rich 3D building
 models from laser scanner data, Automation in Construction. 31 (2013) 325–337.
 doi:10.1016/j.autcon.2012.10.006.
[26] A. Serna, B. Marcotegui, J. Hernández, Segmentation of Façades from Urban 3D Point Clouds
 Using Geometrical and Morphological Attribute-Based Operators, ISPRS International Journal of
 Geo-Information. 5 (2016). doi:10.3390/ijgi5010006.
[27] J. Hernández, B. Marcotegui, Point Cloud Segmentation towards Urban Ground Modeling, in:
 2009 IEEE Joint Urban Remote Sensing Event, 2009: pp. 1–5.
[28] K. Hammoudi, F. Dornaika, B. Soheilian, N. Paparoditis, Extracting Outlined Planar Clusters of
 Street Facades from 3D Point Clouds, in: 2010 Canadian Conference Computer and Robot
 Vision, 2010: pp. 122–129. doi:10.1109/CRV.2010.23.
[29] J. Schmittwilken, L. Plümer, Model-Based reconstruction and classification of facade parts in 3D
 point clouds, International Archives of the Photogrammetry, Remote Sensing and Spatial
 Information Sciences. 38 (2010) 269–274.
[30] B. Vallet, M. Brédif, A. Serna, B. Marcotegui, N. Paparoditis, TerraMobilita/iQmulus urban point
 cloud analysis benchmark, Computers and Graphics (Pergamon). 49 (2015) 126–133.
 doi:10.1016/j.cag.2015.03.004.
[31] Q. Zhang, S.S. Ge, P.Y. Tao, Autonomous Stair Climbing for Mobile Tracked Robot, in: 2011
IEEE International Symposium on Safety,Security and Rescue Robotics, Kyoto,Japan, 2011: pp.
 92–98.
[32] R.C. Luo, M. Hsiao, C.W. Liu, Multisensor integrated stair recognition and parameters
 measurement system for dynamic stair climbing robots, in: IEEE International Conference on
 Automation Science and Engineering, 2013: pp. 318–323. doi:10.1109/CoASE.2013.6654026.
[33] S. Oßwald, J.S. Gutmann, A. Hornung, M. Bennewitz, From 3D point clouds to climbing stairs:
 A comparison of plane segmentation approaches for humanoids, in: IEEE-RAS International
 Conference on Humanoid Robots, Bled, Slovenia, 2011: pp. 93–98.
 doi:10.1109/Humanoids.2011.6100836.
[34] M. Soilán, B. Riveiro, J. Martínez-Sánchez, P. Arias, Segmentation and classification of road
 markings using MLS data, ISPRS Journal of Photogrammetry and Remote Sensing. 123 (2016)
 94–103. doi:10.1016/j.isprsjprs.2016.11.011.
[35] J. Guo, M.-J. Tsai, J.-Y. Han, Automatic reconstruction of road surface features by using
 terrestrial mobile lidar, Automation in Construction. 58 (2015) 165–175.
 doi:10.1016/j.autcon.2015.07.017.
[36] P.H.S. Torr, A. Zisserman, MLESAC: A New Robust Estimator with Application to Estimating
 Image Geometry, Computer Vision and Image Understanding. 78 (2000) 138–156.
 doi:10.1006/cviu.1999.0832.
[37] B. Riveiro, H. González-Jorge, J. Martínez-Sánchez, L. Díaz-Vilariño, P. Arias, Automatic
 detection of zebra crossings from mobile LiDAR data, Optics and Laser Technology. 70 (2015)
 63–70. doi:10.1016/j.optlastec.2015.01.011.
[38] I. Puente, H. González-Jorge, J. Martínez-Sánchez, P. Arias, Review of mobile mapping and
 surveying technologies, Measurement: Journal of the International Measurement Confederation.
 46 (2013) 2127–2145. doi:10.1016/j.measurement.2013.03.006.
[39] EFL, Accessible housing in different european countries, (2016). http://www.ef-l.eu.
[40] A.V. Vo, L. Truong-Hong, D.F. Laefer, M. Bertolotto, Octree-based region growing for point
 cloud segmentation, ISPRS Journal of Photogrammetry and Remote Sensing. 104 (2015) 88–100.
 doi:10.1016/j.isprsjprs.2015.01.011.
[41] C.D. Manning, P. Raghavan, H. Schutze, An Introduction to Information Retrieval, Cambridge
 University Press. (2009) 569. doi:10.1109/LPT.2009.2020494.
You can also read