An Exploration of Hot-Spots in Locimetric Passwords - arXiv
←
→
Page content transcription
If your browser does not render page correctly, please read the page content below
An Exploration of Hot-Spots in Locimetric Passwords
                                      Antonios Saravanos               Dongnanzi Zheng
                                      New York University             Columbia University
                                      Stavros Zervoudakis              Donatella Delfino
                                      New York University             New York University
                                                      Laura Hynes-Keller
                                                   LHK Communications, LLC

                          Abstract                                 Persuasive Cued Click-Points [6]. Yet, none of these imple-
Locimetric authentication is a form of graphical authentica-       mentations enjoy the level of diffusion as Microsoft’s Picture
tion where users validate their identity by selecting predeter-    Password, which is installed by default on any machine run-
mined points on a predetermined image. Its primary ad-             ning the Windows 8 operating system or higher. In actuality,
vantage over the ubiquitous text-based approach stems from         Picture Password is a combination of two schemes, locimet-
users' superior ability to remember visual information over        ric and drawmetric, with the user empowered to select how
textual information, coupled with the authentication process       much of each method they prefer to use. Thus, the password
being transformed to one requiring recognition (instead of re-     that is created could be fully locimetric, fully drawmetric, or
call). Ideally, these differentiations enable users to create      a combination of both schemes. Drawmetric authentication is
more complex passwords, which theoretically are more se-           a form of graphical authentication which validates users by
cure. Yet, locimetric authentication has one significant weak-     requiring them “to draw a preset outline figure, either on top
ness, hot-spots, that is, areas in an image that users gravitate   of an image or on a grid” [9]. Given the prominence of the
towards and consequently have a higher probability of being        Windows operating system, especially in the desktop market,
selected. This paper investigates whether the hot-spot prob-       insight into the potential weaknesses inherent with locimetric
lem persists with high-resolution images, as well as whether       authentication is valuable. In this paper, we focus on one of
user characteristics and password length play a role. Our find-    these weaknesses: the users’ propensity to select the same
ings confirm the presence of hot-spots in high-resolution im-      point on images to form their passwords, known colloquially
ages, thus influencing the locimetric authentication scheme's      as hot-spots [8] (or sometimes as click-point clustering [23]).
effectiveness. Furthermore, we find that neither user charac-      1.1 Understanding the Hot-Spot Problem
teristics (such as age, gender, and income) nor password
                                                                   The existence of hot-spots was initially speculated by
length radically influence their extent. We conclude by pro-
                                                                   Wiedenbeck et al. [31], who wrote, “logically, it seems that
posing strategies to mitigate the hot-spot phenomenon.
                                                                   many users may be attracted to incongruous or unexpected
1 Introduction                                                     elements in an image”. Indeed, while theoretically, locimetric
Locimetric authentication (also known as click-based authen-       authentication has the potential to be superior to text-based
tication) is a graphical mechanism that verifies users’ identity   authentication, as illustrated by Wiedenbeck et al. [31], if us-
through their selection of a series of predetermined points on     ers only select from specific regions, the effectiveness of the
an image in a particular order. Originally described by            scheme drops.
Blonder [5] in his patent filing (US5559961A), it serves as        Several authors have reported the presence of hot-spots when
the first form of graphical authentication. Over the years, sev-   studying the usability of locimetric authentication.
eral other implementations of the scheme have been devel-          Wiedenbeck et al. [29] investigated using the ClickPoints im-
oped, such as PassPoints [31], Cued Click Points [8], and          plementation relying on images with a resolution of 451 by
                                                                   331 pixels. When their study [29] was conducted in 2005, the
                                                                   resolution could be described as adequate. At the time of this
                                                                   writing, it is considered a particularly low-resolution. To ac-
 .
                                                                   count for backward compatibility, later studies retained the
                                                                   low-resolution specification. This includes other evaluations
                                                                   using PassPoints [30], web-based simulations inspired by
                                                                   PassPoints [24], Java-based simulations inspired by
                                                                   PassPoints [10], and Persuasive Cued Click-Points [7].
This presence of hot-spots on previously studied images used Table 1. Images used for the experiment.
for authentication hypothetically could be attributed to their
Id Image / Title / Reference Sample
low-resolution. Accordingly, increasing the resolution should
Size
then resolve the hot-spot problem. Indeed, as the resolution
1 118
increases, there would be more points for users to click on.
We were able to find one paper that examines high-resolution
images within the context of the Picture Password mecha-
nism. Gao et al. [11] undertook a holistic evaluation of the
usability of Microsoft’s Picture Password. Simulating the
Windows 8 operating system, the authors do not explicitly
state the size of the images that they used, but they do disclose
that they used “a PC with a 19-inch screen and 1024 x 1280
screen resolution”. The authors go on to report the presence
of hot-spots in the three images that they studied. Our re- Home Interior [15]
search builds on Gao et al.’s [11] efforts, focusing exclusively
on the locimetric aspects of Picture Password, looking at a 2 117
greater spectrum of images, to determine if:
(1) Evidence of clustering can be observed with high-
resolution images, thereby influencing the effective-
ness of the scheme.
(2) Increasing the points for passwords (e.g., from 3
points to 5 points) affects the presence of clustering.
(3) User demographics (in particular, gender, age, and
income) are related to the quality of locimetric pass- Vegetables [16]
words that are established.
3 119
2 Methodology
To evaluate the effect that usability plays on the security of
locimetric authentication, a series of web-based experiments
were held. Participants were asked to generate a series of lo-
cimetric passwords using software designed to simulate the
password setup phase to generate a series of locimetric pass-
words based upon preselected images (which can be seen in
Table 1). Participants were asked to create a total of 7 pass- Landscape [17]
words, each comprised of five-points, and then reinput each
password for verification. Participants were required to open 4 117
the locimetric authentication simulator to a resolution of 1280
by 720 pixels (or higher) in order to participate.
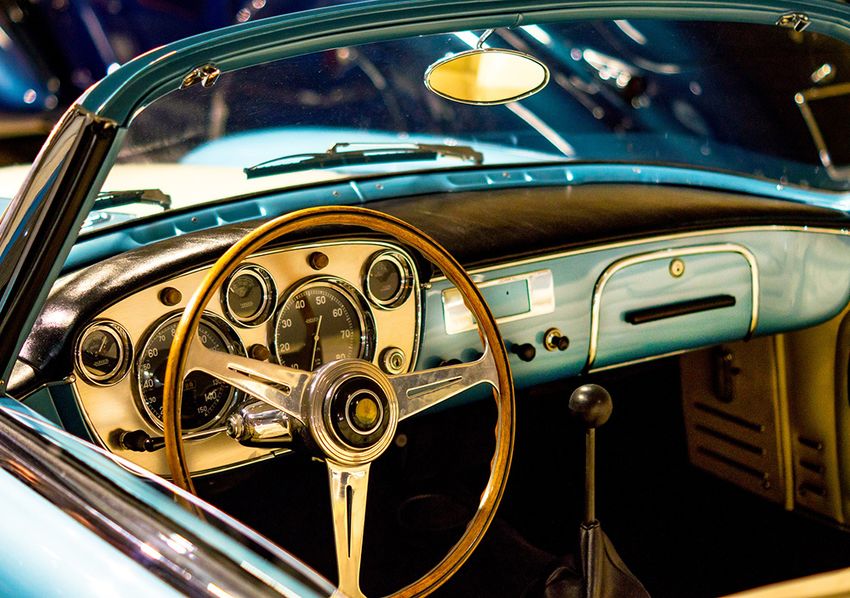
Vehicle [18]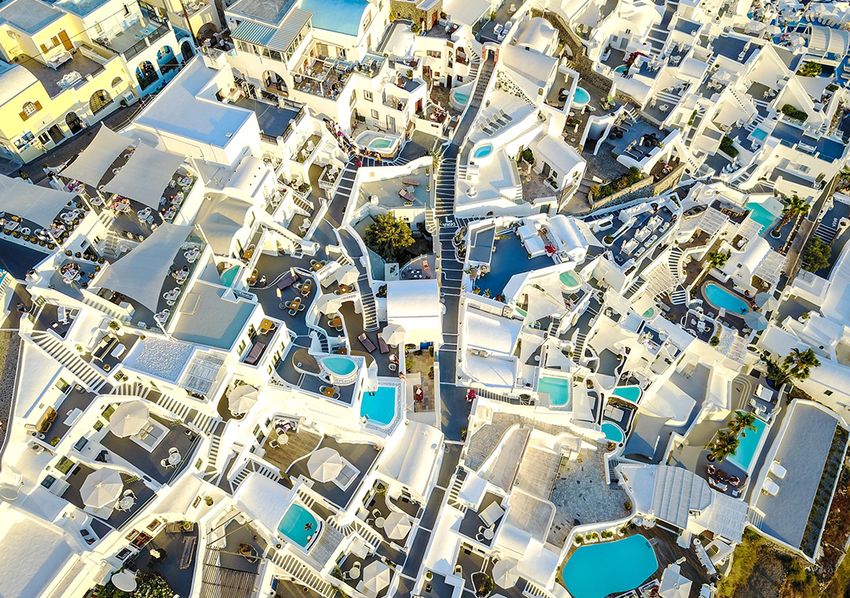
5                                                     116        (70.74%) reporting that they had earned at least an associate
                                                                   degree. In comparison, 24 (19.51%) had some college educa-
                                                                   tion in their backgrounds, but no degree. These characteris-
                                                                   tics are outlined in greater detail in Table 2.

                                                                   Table 2. Participants’ Profile
                                                                     Factor               Category                N        %
                                                                     Gender      Male                             69    56.10%
         Spices [19]                                                             Female                           53    43.09%
                                                                                 Non-Binary                        1     0.81%
  6                                                     118         Income       $10,000 - $19,999                 8     6.50%
                                                                                 $20,000 - $29,999                15    12.20%
                                                                                 $30,000 - $39,999                13    10.57%
                                                                                 $40,000 - $49,999                15    12.20%
                                                                                 $50,000 - $59,999                20    16.26%
                                                                                 $60,000 - $69,999                13    10.57%
                                                                                 $70,000 - $79,999                 7     5.69%
                                                                                 $80,000 - $89,999                 5     4.07%
                                                                                 $90,000 - $99,999                 4     3.25%
                                                                                 $100,000 - $149,999              11     8.94%
         Hot Air Balloons [20]                                                   $150,000 or more                  5     4.07%
                                                                                 Prefer not to answer              1     0.81%
  7                                                     119
                                                                      Age        18-25                            15    12.20%
                                                                                 26-30                            21    17.07%
                                                                                 31-35                            32    26.02%
                                                                                 36-45                            30    24.39%
                                                                                 46-55                            16    13.01%
                                                                                 56 or older                       9     7.32%
                                                                      Race       Asian                           6      4.88%
                                                                                 Black or African American       23     18.70%
                                                                                 Other                           4      3.25%
                                                                                 White                           90     73.17%
         Drawing Tools [21]                                        Education     High school graduate            10     8.13%
                                                                                 Some college - no degree        24     19.51%
                                                                                 Associate's degree              7      5.69%
2.1 Participant Profile and Characteristics                                      Bachelor's degree               62     50.41%
We recruited participants using Amazon Mechanical Turk                           Master's degree                 16     13.01%
(also known as MTurk), which has become quite popular for                        Professional degree             2      1.63%
computing experiments [13]. Indeed, a cursory search of the                      No response                     2      1.63%
term ‘MTurk’ on the Association of Computing Machinery’s
digital library (as of January 1st, 2020) yielded 1,430 records.
                                                                   3 Analysis and Results
Our sample was comprised of a total of 123 participants from
the United States who were all properly compensated, well          The mean number of passwords that were created for each
above the federal minimum wage of $7.25 / hour for partici-        default image was 117.71 (with a standard deviation of 1.11).
pating in the experiment [26]. From these, 69 (56.10%) of          To identify whether clustering was present, we first generated
them identified as male, 53 (43.09%) as female, and 1              scatterplots (see Figure 1) to visualize where each of the pass-
(0.81%) as non-binary. The majority (26.02%) of participants       word points were located on each of the images, using the
were aged between 31 and 35 years, followed by 36 and 45           seaborn visualization package (version 0.11.1) [27]. We then
years (24.39%). Slightly over two-thirds of our participants       proceeded to inspect those scatterplots and found clear evi-
(73.17%) were white. Concerning income, participants re-           dence of clustering. To further support this initial finding, we
ported a wide range, which included values that were less          conducted two tests designed explicitly to identify spatial
than $10,000 to more than $150,000. Most of the participants       randomness. The first was the Clark-Evans test, and the sec-
(61.79%) had an income from $20,000 to $69,999, with 87            ond was the Hopkins-Skellam test. For both tests, we relied
(a)                                                               (b)

(c)                                                               (d)

(e)                                                               (f)

(g)
Figure 1. Scatterplot of points that users selected to form their locimetric password.

on the R language and software environment for statistical            7           0.49463              0.02851
computing (version 4.0.3) [1,3,22] using the spatstat package      Note: For all values, p < 0.01
                                                                   †
[2]. According to Petrere [14], one can interpret the results of     Donnelly edge correction ‡ Monte Carlo simulation
the Clark-Evans test by examining the R index: indeed,
Petrere states that “when R = 0, there is a limit situation of     In addition, we investigated whether users were likely to se-
complete aggregation” and then “when R = 1 the pattern of          lect points with approximately the same x-coordinate (and re-
distribution of individuals is random” [14]. The results for       spectively, y-coordinate) and within a 10-pixel threshold. In
both of the Clark-Evans tests (with and without the Donnelly       other words, participants would pick points within the same
correction) support the conclusion that clustering was present     column or row of the image. We discovered that very few
in all of the high-resolution images tested, as the R values       participants reuse the same points, ranging between 6 to 12,
were all between 0 and 1 and were statistically significant.       depending on the image. However, there was a greater ten-
Similarly, the Hopkins-Skellam Test values were all below 1        dency to pick points within a specific dimension. This result
and statistically significant, again indicating the presence of    was dependent on the image, from 10 users in one instance to
clustering.                                                        95 in another. The results can be seen in Table 5. Further-
                                                                   more, we visualized the links between the different points,
                                                                   which illustrate the path that a representative sample of users
Table 3. Spatial Randomness by Image                               take when setting up their locimetric passwords, in Figure 2.
            Clark-Evans Test Hopkins-Skellam Test
  Image       R          R†         A           A‡
    1      0.43358 0.42580 0.02623           0.02637               Table 5. Number of Users who Repeat Points
    2      0.42951 0.42179 0.01723           0.01557
                                                                    Image x-Dimension        y-Dimension      Both Dimensions
    3      0.38903 0.38210 0.01980           0.02202
                                                                      1        65/118           80/118              6/118
    4      0.37447 0.36773 0.01667           0.01768
                                                                      2        19/117           67/117              6/117
    5      0.52127 0.51186 0.02951           0.02715
                                                                      3        50/119           41/119              7/119
    6      0.35613 0.34975 0.02715           0.02893
                                                                      4        26/117           53/117             12/117
    7      0.51364 0.50449 0.02061           0.02015
                                                                      5        10/116           95/116              6/116
Note: Clustering for 5-points locimetric password.
                                                                      6        29/118           56/118             10/118
For all values, p < 0.01
†                                                                     7        32/119           41/119              6/119
  Donnelly edge correction ‡ Monte Carlo simulation
                                                                   Note: Within 10 pixels.

3.1 Does Length of Password Influence Strength?
                                                                   3.2 Do Demographics Reflect Password Strength?
We also examined whether requiring more points for a lo-
                                                                   We also wanted to ascertain whether demographics (gender,
cimetric password would lead to the reuse of the same
                                                                   age, and income) affect randomness. We applied Clark Evans
point(s) multiple times. To make that determination, we com-
                                                                   (with Donnelly edge correction) and Hopkins-Skellam tests
pared the presence of clustering when passwords used the
                                                                   (with Monte Carlo simulation) amongst different demo-
first three points selected by users as part of their passwords
                                                                   graphic groups. The test results with 5-point passwords as
to when all five points formed their password. Therefore, we
                                                                   compared between males (56.10% of the sample size) and fe-
conclude that increasing the points for passwords from 3-
                                                                   males (43.09%) presented in Table 6 revealed that gender
points to 5-points does not make the randomness stronger. No
                                                                   doesn’t affect randomness. The test results with 5 point pass-
clear pattern to provide evidence that would indicate reuse
                                                                   words between people in the age group over 35 (44.72%) and
was found.
                                                                   those in the age group of 35 (55.28%) and below, shown in
                                                                   Table 7, revealed that age doesn’t affect randomness. The test
                                                                   results with 5-point passwords between people with an in-
Table 4. Clustering for 3-Point Locimetric Passwords
                                                                   come larger than and equal to $50K (52.85%) and people
 Image    Clark-Evans Test      Hopkins-Skellam Test               with smaller than $50K (46.34%), shown in Table 8, revealed
                 R†                      A‡                        that income doesn’t affect randomness.
    1         0.42127                 0.02924
    2         0.41877                 0.02774
    3         0.41407                 0.04008
    4         0.36013                 0.01779
    5         0.50530                 0.03257
    6         0.36154                 0.03581
(a)                                                            (b)

(c)                                                            (d)

(e)                                                            (f)

(g)
Figure 2. Sample paths of users’ password selected points, superimposed.
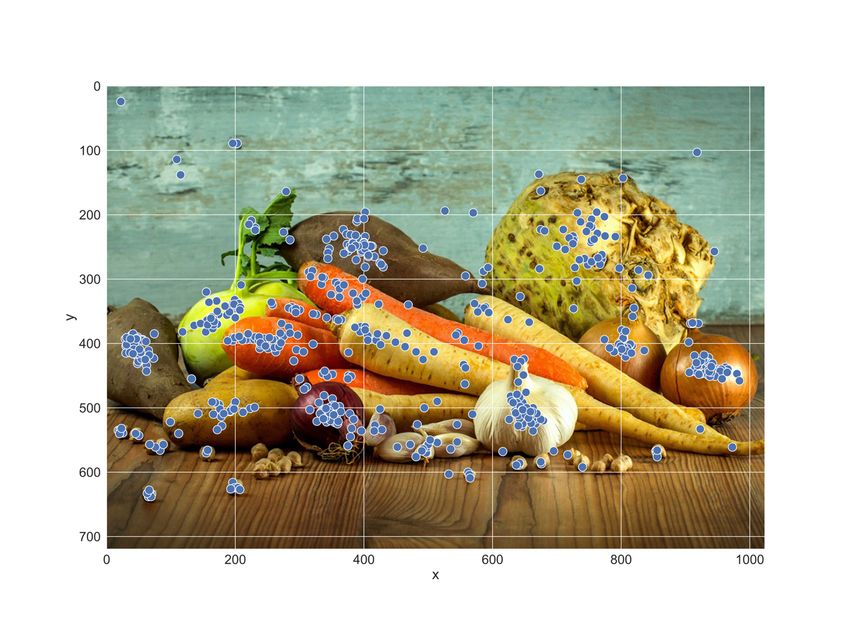
Table 6. Clustering with Respect to Gender                          4 Discussion and Conclusions
                     Male                       Female              The locimetric scheme is presented as an alternative to tradi-
             Clark-      Hopkins-        Clark-      Hopkins-       tional forms of authentication (i.e., the ubiquitous text-based
             Evans       Skellam         Evans        Skellam       approach). Its advantage stems from users’ superior ability to
              Test          Test          Test          Test        work with visual information (over textual information, see
  Image        R†            A‡            R†            A‡         picture superiority effect [28]). Moreover, the locimetric
    1       0.44549      0.04509        0.47393       0.04884       scheme is lighter in terms of cognitive demands on users, as
    2       0.38146      0.02206        0.47604       0.02068       it transforms the authentication process from one of recall to
    3       0.41286      0.04011        0.46859       0.05453       one of recognition. Theoretically, these advantages should
    4       0.36848      0.03348        0.41173       0.03792       empower users to generate stronger passwords. However,
    5       0.52598      0.04007        0.45563       0.03808       one well-known weakness of the scheme is that users are at-
    6       0.31102      0.03071        0.38364       0.02510       tracted to hot-spots. These are regions in images that users
    7       0.55421      0.04618        0.50748       0.04367       are drawn to and, therefore, more likely to contain user pass-
Note: As only one participant reported a gender of non-bi-          word points, lowering the effective password space. In this
nary, we did not have sufficient data to evaluate the possibil-     paper, we examined whether the presence of hot-spots per-
ity of clustering for that specific category. For all values, p <   sists with high-resolution images, building on the work of
0.01                                                                Gao et al. [11]. Additionally, we studied whether user char-
†
  Donnelly edge correction ‡ Monte Carlo simulation                 acteristics (i.e., age, income, and gender), as well as the
                                                                    length of the password, influence the existence of hot-spots.
Table 7. Clustering with Respect to Age                             Our findings reveal that hot-spots are present even in high-
                    35                     resolution images irrespective of the length of the locimetric
             Clark-     Hopkins-    Clark-     Hopkins-             password. Of particular interest was the realization that im-
             Evans      Skellam     Evans       Skellam             age content appeared to influence the level of clustering. We
              Test        Test       Test         Test              speculate this is a consequence of users trying to form pass-
  Image        R†          A‡         R†           A‡               words by clicking particular objects or colors within each im-
    1      0.43146      0.03391    0.47517      0.05385             age that they find to be eye-catching and would hence be eas-
    2      0.42910      0.02650    0.45899      0.03256             ier to remember. For example, Images 4 (vehicle) and 7
    3      0.41125      0.03940    0.35985      0.02882             (drawing tools) have less clustering, therefore were better
    4      0.35954      0.02098    0.37828      0.04030             suited for use with locimetric authentication. We speculate
    5      0.49269      0.03429    0.51534      0.04928             that this is a consequence of there being a plethora of similar
    6      0.37370      0.06929    0.36986      0.05180             objects in Image 5 (spices), which are distributed more
    7      0.53087      0.03718    0.54044      0.04532             evenly throughout the image. Thus, it provides multiple areas
Note: For all values, p < 0.01                                      for users to find and mark placement. With respect to Image
†
  Donnelly edge correction ‡ Monte Carlo simulation                 7 (drawing tools), there are again a great number of similar
                                                                    objects in the image for users to select. Additionally, there are
Table 8. Clustering with Respect to Income                          several varying colors in close proximity to each other. This
                                                                    is in contrast, for example, to Image 4 (vehicle), where there
                    =50k
                                                                    are a limited number of large objects (e.g., the wheel and in-
            Clark-      Hopkins-    Clark-     Hopkins-
                                                                    strument board) without any particular colors (e.g., mostly
             Evans       Skellam    Evans       Skellam
              Test         Test      Test         Test              blue with a bit of chrome) that stand out. Thus, the majority
  Image        R†           A‡        R†           A‡               of users focus their attention on those (limited) objects where
    1      0.46363       0.05326   0.43471      0.03153             the clustering occurs. Another example of a poor image
    2      0.43403       0.03141   0.41517      0.01536             choice for use with locimetric authentication is that of Image
    3      0.42185       0.04741   0.36020      0.02401             3 (landscape), where even though there are no specific ob-
    4      0.41166       0.03711   0.37291      0.03150             jects that explicitly stand out from each other, there are a lim-
    5      0.55946       0.06000   0.50922      0.05535             ited number of eye-catching colors (e.g., blue and yellow),
    6      0.31172       0.01907   0.38351      0.04824             which attract the users and are the source of the clustering.
    7      0.51595       0.02800   0.53149      0.04127             This opens up the possibility that certain images might be bet-
Note: For all values, p < 0.01                                      ter suited for users to create stronger locimetric passwords,
†
  Donnelly edge correction ‡ Monte Carlo simulation                 and this question should be examined in future research.
                                                                    For the purpose of better understanding where user attention
                                                                    is concentrated while selecting points on a given image, we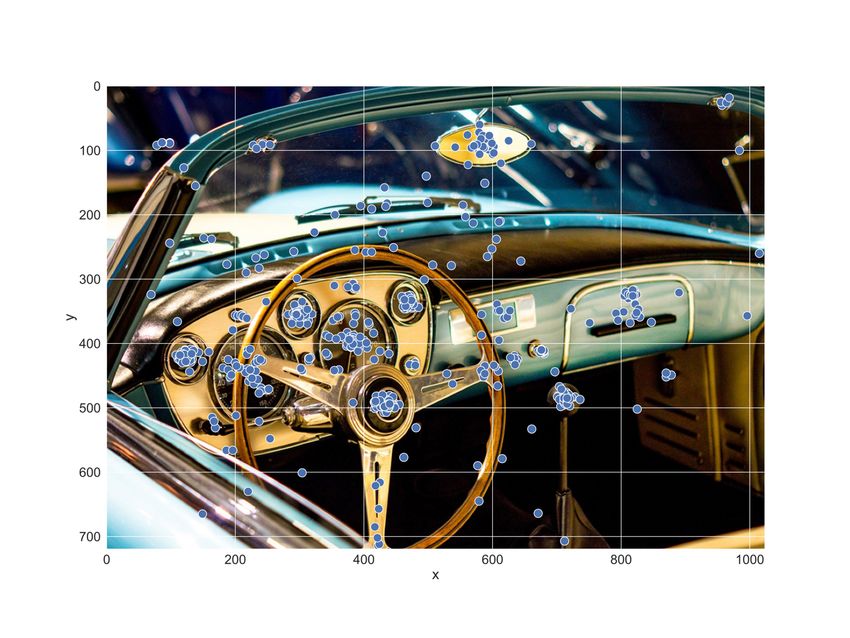
computed the attention probability for all pixels in that image.   which individuals interact with images. Begley’s [4] work
This was done using bivariate distributions coupled with the       highlights those differences, “westerners pay attention to the
utilization of kernel density estimation, a non-parametric         focal object, while Asians attend more broadly— to the over-
model that combines clustering and density estimators (spe-        all surroundings and to the relations between the object and
cifically, Gaussian Mixture models) for each point (i.e.,          the field.” Consequently, future studies may be directed to-
pixel) on the respective image. This approach creates layers       wards investigating diverse cultural approaches to the crea-
that contain similar probability values, which indicate that a     tion of locimetric passwords and whether any cultural differ-
user will select specific pixel areas for their password, given    ences influence the effectiveness of the scheme with respect
all points previously selected by the users in our study. Fur-     to system entry and security.
thermore, it combines the probability distributions, centered
                                                                   Furthermore, we sought to determine whether user character-
at the pixels with the highest probabilities, and creates planes
                                                                   istics (i.e., age, income, and gender) influence the formation
of similar probabilities using smoothing techniques. Corre-
                                                                   of the hot-spots that were observed. The benefit of finding
sponding probabilities, ranging from higher to lower, are rep-
                                                                   such a pattern would inform the allocation of resources (such
resented by colors and visible in the respective legends,
                                                                   as training) exclusively to those users. However, no such a
which are illustrated in Figure 3 as overlayed heatmaps. This
                                                                   relationship was found; irrespectively, users generally appear
is a relative measure and the values are based on the total
                                                                   to gravitate towards hot-spots equally. Of course, we would
number of observations for each specific sample.
                                                                   be remiss not to recognize that as technology advances and
We can make the following three observations. First, in all        resolutions continue to increase, at some point the hot-spot
images, for the most part, users are more likely to select         problem may dissipate on its own. In the short term, however,
points away from the edges, rather than focusing on higher         increasing image size to solve the hot-spot problem is not a
saliency points (i.e., the main focus areas of the image (i.e.,    solution.
the points of interest or principal points of focus). Second, as
                                                                   There are several practical implications that result from our
the images that we used had non-singular focus areas, we ob-
                                                                   work. From the user and system administrator perspective,
served multiple cluster centers, which hint at varying visual
                                                                   the presence of hot-spots, even in high-resolution images, ne-
‘tastes’ by different individuals. This indicates that such im-
                                                                   cessitates that the issue be addressed. To overcome the hot-
ages may result in stronger locimetric passwords and, there-
                                                                   spot phenomenon we propose user training, an idea that is not
fore, should be preferred by systems that employ this authen-
                                                                   in itself a novel within the field of security [12,25,32]. There
tication technique. Third, areas in an image that are of the
                                                                   are many forms of training; we suggest three forms as exem-
same color and contain no objects have the lowest probability
                                                                   plars:
of being selected. This is expected, as those points would be
harder to remember, a conclusion that is confirmed by the               1.   Training users through guidelines on how to select
scatterplots (see Figure 1).                                                 images to use for their passwords which would be
                                                                             better suited for this scheme because they naturally
Our observations hint at the importance of enforcing what
                                                                             lead to fewer hot-spots. For example, images with
would be considered as ‘strong image’ passwords, which
                                                                             a plethora of objects and colors, as they offer mul-
could serve as a basis for system security aimed at the pre-
                                                                             tiple focal points instead of a singular focus.
vention of unauthorized system entry and cybersecurity
breach. Strong images can be classified as those that are high-         2.   Training users through guidelines on how to avoid
resolution, employ multiple focal points, have a large number                selecting popular points which are within hot-spot
of edges, utilize multiple color schemes and have various ob-                areas, but instead selecting password points outside
jects throughout the image (for instance, there are no large                 of those areas.
sections with blue skies, sea, or an object with the same color
                                                                        3.   A simulator with a strength meter offering users the
occupying a large section of the image). Further studies are
                                                                             opportunity to practice the creation of locimetric
required to quantify the minimum requirements that a high-
                                                                             passwords through trial and error.
resolution image needs to have in order to be accepted as a
‘strong image’ for use by the authenticator program. This be-      These approaches should lead to stronger locimetric pass-
comes especially important for a system that allows users to       words and minimize the hot-spot phenomenon. Should the
upload their images and then select points for password cre-       hot-spot problem be overcome, the locimetric scheme has
ation.                                                             considerable potential to serve as a viable alternative to tra-
                                                                   ditional forms of authentication.
Another area that should be explored is that of culture, as our
study focused exclusively on the United States. Certainly, it
is a consideration to be taken into account, as it has been
demonstrated that cultural differences influence the way by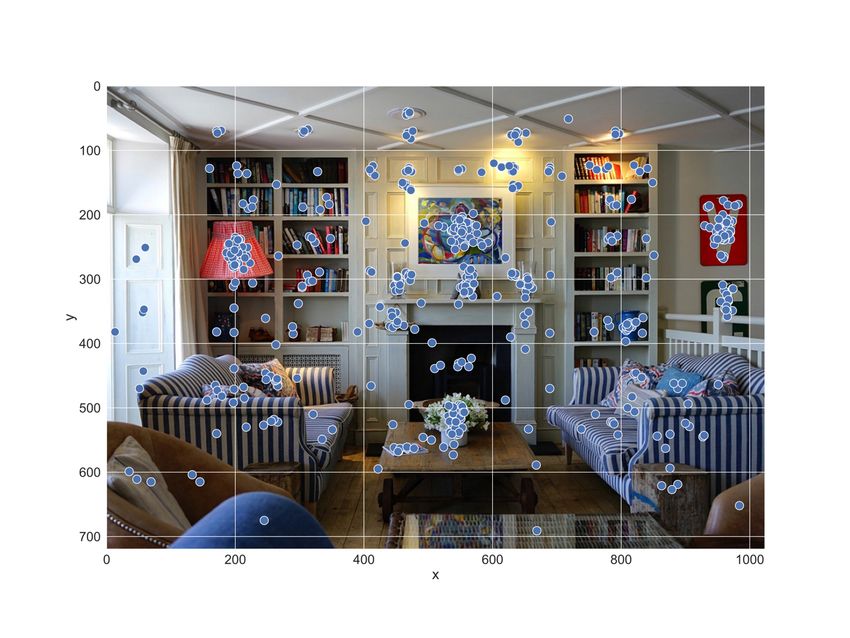
(a)                                                           (b)

(c)                                                           (d)

(e)                                                            (f)

(g)
Figure 3. Heatmaps indicating areas with similar probability for user passwords.
5 References                                                         '07, Pittsburg, PA. ACM Inc., New York, NY. 20–28.
[1] Adrian Baddeley, Ege Rubak, and Rolf Turner. 2015.               DOI: 10.1145/1280680.1280684
     Spatial Point Patterns: Methodology and Applications       [11] Haichang Gao, Wei Jia, Ning Liu, and Kaisheng Li.
     with R. Chapman and Hall / CRC Press, London. Re-               2013. The Hot-Spots Problem in Windows 8 Graphical
     trieved February 14, 2021 from                                  Password Scheme. In Proceedings of the 5th Interna-
     http://www.crcpress.com/Spatial-Point-Patterns-Meth-            tional Symposium: Cyberspace Safety and Security
     odology-and-Applications-with-R/Baddeley-Rubak-                 (CSS 2013), November 13-15, 2013, Zhangjiajie,
     Turner/9781482210200/                                           China. Springer International Publishing, Cham, Swit-
[2] Adrian Baddeley and Rolf Turner. 2005. Spatstat: An R            zerland. 349–362. DOI: 10.1007/978-3-319-03584-
     package for analyzing spatial point patterns. Journal of        0_26
     Statistical Software 12, 6 (January 2005), 1–42.           [12] Ding-Long Huang, Pei-Luen Patrick Rau, and Gavriel
[3] Adrian Baddeley, Rolf Turner, Jorge Mateu, and An-               Salvendy. 2007. A survey of factors influencing peo-
     drew Bevan. 2013. Hybrids of Gibbs point process                ple’s perception of information security. In Proceed-
     models and their implementation. Journal of Statistical         ings of the 12th International Conference on Human-
     Software 55, 11 (November 2013), 1–43. DOI:                     Computer Interaction: Applications and Services (HCI
     10.18637/jss.v055.i11                                           INTERNATIONAL 2007), July 22-27, 2007, Beijing,
[4] Sharon Begley. 2003. East Versus West: One Sees Big              China. Springer-Verlag Berlin Heidelberg, Berlin, Ger-
     Picture, Other Is Focused. The Wall Street Journal. Re-         many, 906–915. DOI: 10.1007/978-3-540-73111-
     trieved February 22, 2021 from                                  5_100
     https://www.wsj.com/articles/SB104881491132002400          [13] Gabriele Paolacci, Jesse Chandler, and Panagiotis Ipei-
[5] Greg E. Blonder. 1996. Graphical password.                       rotis. 2010. Running experiments on Amazon Mechani-
[6] Sonia Chiasson, Alain Forget, Robert Biddle, and Paul            cal Turk. Judgment and Decision Making 5, 5 (2010),
     C. Van Oorschot. 2008. Influencing users towards bet-           411–419.
     ter passwords: Persuasive Cued Click-Points. In Pro-       [14] Miguel Petrere. 1985. The variance of the index (R) of
     ceedings of the 22nd British HCI Group Annual Con-              aggregation of Clark and Evans. Oecologia 68, 1 (De-
     ference on People and Computers: Culture, Creativity,           cember 1985), 158–159. DOI: 10.1007/BF00379489
     Interaction - Volume 1 (BCS-HCI ’08), September 1-5,       [15] Pixabay. Home Interior Room House Furniture. Re-
     2008, Liverpool, United Kingdom. BCS Learning &                 trieved February 2, 2021 from https://pixabay.com/pho-
     Development Ltd., Swindon, United Kingdom. 121–                 tos/home-interior-room-house-furniture-1438305/
     130. DOI: 10.5555/1531514.1531531                          [16] Pixabay. Vegetables Carrots Garlic Celery. Retrieved
[7] Sonia Chiasson, Elizabeth Stobert, Alain Forget, Rob-            February 2, 2021 from https://pixabay.com/photos/veg-
     ert Biddle, and Paul C. Van Oorschot. 2012. Persuasive          etables-carrots-garlic-celery-1212845/
     Cued Click-Points: Design, implementation, and evalu-      [17] Pixabay. Santorini City Greece Tourism. Retrieved
     ation of a knowledge-based authentication mechanism.            February 2, 2021 from https://pixabay.com/photos/san-
     IEEE Transactions on Dependable and Secure Compu-               torini-city-greece-tourism-4044972/
     ting 9, 2 (March 2012), 222–235. DOI:                      [18] Pixabay. Car Vehicle Motor Transport. Retrieved Feb-
     10.1109/TDSC.2011.55                                            ruary 2, 2021 from https://pixabay.com/photos/car-ve-
[8] Sonia Chiasson, Paul C. Van Oorschot, and Robert                 hicle-motor-transport-3046424/
     Biddle. 2007. Graphical password authentication using      [19] Pixabay. Mat Spices. Retrieved February 2, 2021 from
     Cued Click Points. In Proceedings of the 12th Euro-             https://pixabay.com/photos/mat-spices-3251064/
     pean Conference on Research in Computer Security           [20] Pixabay. Hot Air Balloons Adventure Balloons. Re-
     (ESORICS 2007), September 24-26, 2007, Dresden,                 trieved February 2, 2021 from https://pixabay.com/pho-
     Germany. Springer-Verlag Berlin Heidelberg, Berlin,             tos/hot-air-balloons-adventure-balloons-1867279/
     Germany. 359–374. DOI: 10.1007/978-3-540-74835-            [21] Pixabay. Brush Chalk Color Atelier Paint. Retrieved
     9_24                                                            February 2, 2021 from https://pixabay.com/pho-
[9] Antonella De Angeli, Lynne Coventry, Graham John-                tos/brush-chalk-color-atelier-paint-2927793/
     son, and Karen Renaud. 2005. Is a picture really worth     [22] R Core Team. 2013. A language and environment for
     a thousand words? Exploring the feasibility of graph-           statistical computing. R Foundation for Statistical
     ical authentication systems. International Journal of           Computing, Vienna, Austria. Retrieved from
     Human-Computer Studies 63, 1–2 (2005), 128–152.                 http://www.R-project.org/
     DOI: 10.1016/j.ijhcs.2005.04.020                           [23] Elizabeth Stobert, Alain Forget, Sonia Chiasson, Paul
[10] Ahmet Emir Dirik, Nasir Memon, and Jean-Camille                 C. van Oorschot, and Robert Biddle. 2010. Exploring
     Birget. 2007. Modeling user choice in the PassPoints            usability effects of increasing security in click-based
     graphical password scheme. In Proceedings of the 3rd            graphical passwords. In Proceedings of the 26th An-
     Symposium on Usable Privacy and Security (SOUPS                 nual Computer Security Applications Conference
                                                                     (ACSAC '10), December 6–10, 2010, Austin, Texas.
ACM Inc., New York, NY, 79–88. DOI: [32] M. Yıldırım and I. Mackie. 2019. Encouraging users to
10.1145/1920261.1920273 improve password security and memorability. Interna-
[24] Julie Thorpe and Paul C. Van Oorschot. 2007. Human- tional Journal of Information Security 18, 6 (December
seeded attacks and exploiting hot-spots in graphical 2019), 741–759. DOI: 10.1007/s10207-019-00429-y
passwords. In Proceedings of the 16th USENIX Secu-
rity Symposium (USENIX SECURITY '07), August 6-
10, 2007, Boston, Massachusetts. USENIX, Berkeley,
California. 103–118. Retrieved October 21, 2020 from
https://www.usenix.org/leg-
acy/events/sec07/tech/full_papers/thorpe/thorpe_html/
[25] Blase Ur, Patrick Gage Kelley, Saranga Komanduri,
Joel Lee, Michael Maass, Michelle L. Mazurek, Timo-
thy Passaro, Richard Shay, Timothy Vidas, and Lujo
Bauer. 2012. How does your password measure up?
The effect of strength meters on password creation. In
Proceedings of the 21st USENIX Security Symposium
(SECURITY '12), August 6 - 10, 2012, Bellevue, Wash-
ington. USENIX, Berkeley, California, 65–80. Re-
trieved October 21, 2020 from https://www.use-
nix.org/system/files/conference/usenixsecu-
rity12/sec12-final209.pdf
[26] U.S. Department of Labor. 2021. Changes in Basic
Minimum Wages in Non-Farm Employment Under
State Law: Selected Years 1968 to 2020. Retrieved
February 22, 2021 from https://www.dol.gov/agen-
cies/whd/state/minimum-wage/history
[27] Michael Waskom. 2020. waskom2020seaborn. Zenodo.
Retrieved from https://doi.org/10.5281/zenodo.592845
[28] Andrew J.O. Whitehouse, Murray T. Maybery, and
Kevin Durkin. 2006. The development of the picture-
superiority effect. British Journal of Developmental
Psychology 24, 4 (2006), 767–773. DOI:
10.1348/026151005X74153
[29] Susan Wiedenbeck, Jim Waters, Jean-Camille Birget,
Alex Brodskiy, and Nasir Memon. 2005. Authentica-
tion using graphical passwords: Basic results. In Pro-
ceedings of the 11th International Conference on Hu-
man-Computer Interaction (HCI INTERNATIONAL
'05), July 22-27, 2005, Las Vegas, Nevada. Retrieved
January 26, 2021 from http://www.jim-
waters.info/pubs/Graphical-Password-Basic-Results-
2005.pdf
[30] Susan Wiedenbeck, Jim Waters, Jean-Camille Birget,
Alex Brodskiy, and Nasir Memon. 2005. Authentica-
tion using graphical passwords: Effects of tolerance
and image choice. Proceedings of the 1st Symposium
on Usable Privacy and Security (SOUPS '05), July 6-8,
2005, Pittsburgh, Pennsylvania. ACM Inc., New York,
NY, 1–12. DOI: 10.1145/1073001.1073002
[31] Susan Wiedenbeck, Jim Waters, Jean-Camille Birget,
Alex Brodskiy, and Nasir Memon. 2005. PassPoints:
Design and longitudinal evaluation of a graphical pass-
word system. International Journal of Human-Com-
puter Studies 63, 1 (July 2005), 102–127. DOI:
10.1016/j.ijhcs.2005.04.010You can also read