An evaluation of the stereoscopic capabilities of CORONA declassified spy satellite image data
←
→
Page content transcription
If your browser does not render page correctly, please read the page content below
An evaluation of the stereoscopic capabilities of CORONA declassified spy
 satellite image data

 Nikolaos Galiatsatos, Daniel N. M. Donoghue(1), and Graham Philip(2)

 (1)
       University of Durham, Department of Geography, South Road, Durham DH1 3LE, UK
 E-mail: nikolaos.galiatsatos@durham.ac.uk and danny.donoghue@durham.ac.uk
 (2)
       University of Durham, Department of Archaeology, South Road, Durham, DH1 3LE, UK
 E-mail: graham.philip@durham.ac.uk

 Keywords: CORONA, IKONOS, declassified imagery, photogrammetry, remote sensing, archaeology, DEM, Syria

 ABSTRACT: In 1995, a large database of American satellite imagery with worldwide coverage acquired between
 1960 and 1972 was declassified. This was the CORONA program imagery and it has proved useful for many
 applications where image data is difficult to obtain or where historic data is needed. CORONA was the first satellite
 mission to provide stereoscopic coverage from space and it has already been demonstrated that it is possible to
 generate digital elevation models (DEMs) from it. The purpose of this paper is to show examples of the quality of
 elevation data that can be obtained from CORONA stereopairs and to consider the importance of image
 characteristics (optics, films and filters) which changed with almost every mission and are not widely discussed in the
 literature. The panoramic geometry of the CORONA cameras is not easily processed by most photogrammetric
 software packages. The translation of the film data to digital format is also a possible source of error. This research
 explores the issues surrounding image pre-processing and DEM extraction, and it compares and contrasts the results
 with other sources of elevation information. The paper also describes problems that are very typical when working in
 developing countries and it provides a methodology for producing acceptable topographic results.

1       INTRODUCTION

The first space satellite to provide stereoscopic coverage was CORONA mission 9031 from 27th of February 1962. The
KH-4 design provided along-track stereopairs with a ground resolution of 8 m. The CORONA program continued to
provide along-track stereoscopic coverage until 1972, with the designs KH-4A and KH-4B.
This paper discusses the derivation of elevation data from CORONA KH-4B satellite imagery, and assesses the
accuracy and resolution of the derived DEM. Erdas OrthoBASE Pro software was used for the triangulation and DEM
extraction.
The same software was used by Altmaier & Kany (2002) but in a mountainous landscape in southern Morocco, with
DGPS-measured GCPs (Ground Control Points). This contrasts with the relatively flat area of the Homs area in Syria
discussed in this paper, where DGPS (Differential Global Positioning System) measurements of "hard points"
(simultaneously considered as “sensitive points” by security) could not be applied because of security restrictions.
Schmidt et al. (2001a) created a DEM from CORONA imagery with the use of VirtuoZo software, again in the same
South Morocco area. The accuracy was close to that reported by Altmaier & Kany (2002). Since they cooperated in
other papers [Goossens et al. (2001), Schmidt et al. (2001b)], it can be assumed that the GCPs were derived from the
same DGPS measurements (Goossens 2004). None of the above published papers discussed the digitising process in
any depth.

2       DATA

Although several books about CORONA have been published, e.g. Ruffner (1995), Peebles (1997), McDonald (1997),
Day et al. (1998), and Madden (1996), all of them focus on the history of CORONA project, and give very little
information on photogrammetry problems.
Galiatsatos (2004) demonstrated that no mission was precisely the same as another, and no camera was the same as
another. The experiments with cameras, films, filters, slits, lenses and other parts of the satellite systems were
continuous. Information taken from declassified CORONA documents such as NRO (1970a) and NRO (1970b) allowed
acquisition of the specific satellite system design for the imagery used in this paper (Table 1). There are still some
unanswered details, such as whether the alternate or the prime filter was used for the particular frames, or whether the
film is the main one or was spliced-in for the particular frames. Such details may be included in the mission reports in
NRO library, but are probably not of vital importance for most applications.

Table 1 – The particular design of the satellite system for the imagery of the project.
                  Mission            Cameras           Frame No.               Date              Petzval              Film     Filters$
                   1108                Aft             42,43,44,45          17/12/1969           Type III             3404      25/25
                   1110               Fwd               07,08,09            28/05/1970           Type II            3404/14*   21/23A
                   1110                Aft              13,14,15            28/05/1970           Type III           3404/14*   23A/25
                   1111                Aft                01,02             31/07/1970           Type III             3414     25/25¥
$
Prime/Alternate. The most likely filter for the images in the project is the prime. There is uncertainty.
*
3414 film was spliced-in. There is uncertainty if the film of the project was 3404 or 3414. Most probably it was 3404.
¥
The alternate filter was glass filter 0.007 inch for increase of 0.001 inch in focus.

From Table 1, it is apparent that the two cameras of mission 1110 have a different generation lens, the forward camera
has a second generation and the aft camera a third generation petzval lens. This has an impact on the film resolution.
According to NRO (1970a), the performance nadir prediction of the second generation lens is 130 lp/mm and the third
generation lens is 155 lp/mm (for a 2.44 msec exposure time, 3404 film type, 2:1 contrast, field angle 0°, and 152 km
altitude).
For mission 1110, the overall image quality is less than that provided by previous KH-4B missions (Peebles, 1997).
Leachtenauer et al. (1997) describe an experiment that tested a sample of CORONA data with both commercial and
prototype scanners. They found that the images could be digitised with no loss of information content, but to do so
required using a very small digitising spot, which took substantial time and produced large digital files.
Thom (2002) shows that the smaller the step of scan, the better will be the precision and the spatial resolution, but there
may also be loss of radiometric precision. In practical applications, the impact of radiometric quality on the geometric
precision is not easy to evaluate. Generally, weakly contrasted details can be separated when attention has been given to
the radiometric quality. Figure 1 shows the implications of this issue for a scene of high contrast. Furthermore, it
demonstrates that when the images are scanned with insufficient care for the radiometric resolution this may result in a
loss of detail for applications where contrast is important.

Figure 1 - Difference in scanning between attention in radiometry detail (a) and attention to geometric precision with high
contrast (b).
This research project used the photogrammetric scanner Vexcel VX4000, and all images were scanned at the optimal
7.5 µm (about 3400 dpi) optical resolution, with attention to radiometric detail.
Tappan et al. (2000) preferred to photointerpret CORONA straight from the film without any digitizing. This is a
rigorous approach but it inhibits the GIS potential of data integration. Bindschadler & Vornberger (1998) scanned the
film to a satisfactory scale for their application, while Palmer (2002) preferred to create prints of larger scale and then
scan the prints on a flatbed scanner. Palmer’s approach is simple but effective and demonstrates that for certain
applications complex data pre-processing may not be necessary.
Figure 2 - CORONA cameras and coverage along with images of a unit grid on the ground obtained with a pair of convergent panoramic cameras in flight (from Slama et al., 1980). There are several approaches for the correction of the CORONA data distortions (figure 2). Sohn et al. (2004), Schenk et al. (2003), and Shin (2003) identify rigorous and other approaches for processing CORONA photography. Panoramic photography was an innovative and fashionable method developed for aerial survey in the 1950s-70s, but it is little used today. The best source of information about these cameras is from publications such as Slama et al. (1980) which describe the concepts and the correction of the image data. Note that some of the authors in Slama et al. (1980) were involved in the CORONA program. Other important publications are Case (1967) and Devereaux (1973). From the above publications, the most important point is that if there is sufficient ground control then the ephemeris data are not required (Ondrejka, 2000; Slama et al., 1980). 3 STUDY AREA A study area located in the Orontes valley between the cities of Homs and Hama is chosen to illustrate the potential of the CORONA imagery. It extends south of Homs covering a total area of approximately 700 km2; the area is relatively flat, without intense relief; and has an altitudinal range of approximately 400-600 m. The land use is primarily agricultural with small settlements and a lake. This area was chosen for several reasons. First, it is an area with great potential for identifying archaeological sites because it has not been fully explored. In western Syria there has been little acknowledgement of the complexity and sheer diversity of ancient Syrian landscapes, within which the archaeological sites are simply one element. Height data can
greatly assist the process of interpreting potential sites from imagery either directly as in the case of tells1 or
indirectly by providing landscape context. This research was part of a Syrian-British co-operative project
organized by the University of Durham and the Directorate General of Antiquities and Museums (DGAM) to
study the Settlement and Landscape Development in the Homs Region (Philip et al., 2002). One of the aims of
the project is to explore the capability of CORONA imagery in comparison to existing topographic mapping
(which is 1:25,000 scale) because the application requires the detection of subtle features such as tells, walls,
and river terraces. The study also provides a test of a methodology that could be developed and applied
through many parts of the world where archaeological resource is currently very poorly documented.

4    METHODS

The cameras used on CORONA missions produced panoramic satellite stereo images that were intended to assist
manual photo interpretation. Unlike modern satellite stereo image data, it is difficult to obtain the parameters needed to
perform a rigorous analysis of digital data to extract height information. It is ironic that the areas of the world where
CORONA data is most useful are also the places where it is difficult to obtain accurate ground control points (GCPs)
and up to date topographic maps or aerial photos. In areas like the Middle East it is either forbidden or difficult to take
measurements to create GCPs and military survey organisations will not provide coordinates, or accurate and
comprehensive maps to use as a basemap. For these reasons the following approach was followed.
IKONOS is a satellite sensor with an imaging system free of significant non-linearities (Fraser et al., 2002a). Table 2
shows the geometric properties of IKONOS Panchromatic (1 m spatial resolution) Geo product images acquired over
the study area in March 2002. By registering CORONA to the IKONOS Geo product imagery, the CORONA geometry
distortions are significantly reduced. Beck et al. (in press) show a methodology to improve the accuracy of CORONA
geo-location at a local scale. There is also a need to generate height information for GCPs, something that is not
included in the IKONOS Panchromatic 1 m resolution imagery. For this, the 1:25,000 Russian military maps were
registered to IKONOS, and after registration the heights were sampled from the contour lines. This assumes that the
contour lines were produced accurately.

Table 2 – Directions and angles of CORONA and IKONOS imagery of the project
                IKONOS                Scan azimuth    Scan direction        Collection azimuth          Collection elevation
                  756                   179.97°          Reverse                 38.3713°                    67.22347°
                  757                   359.96°         Forward                  67.8092°                    76.36649°
                CORONA               Camera looking   Scan direction*        Orbit inclination           Sensor elevation
                 009fwd                Backward       Anticlockwise                 83°                      74.77°
                  015aft                Forward         Clockwise                   83°                      74.77°
*
Looking from behind the satellite.

Initially, the panoramic camera model in the Socet Set™ software package was used to establish the geometric
relationship between the stereo pairs. However, the best results using the rigorous approach of the available sensor
modelling gave a uniform error of around 160 pixels to all points of one image and about 20 pixels to all points in the
other image. In particular, the total RMSe was about 20m in each direction but the specific residuals were more than
1,000 m. The reasons for this error are unknown. It is possible the error comes from the panoramic camera parameters
many of which are not known precisely because of the declassification process. The values of some of the parameters
such as orientation angles can play an important role in the analysis. Unfortunately, the algorithms of the panoramic
model used by Socet Set are not known, thus it was not possible to understand or explain the source of our large errors.
After personal communication with Pournelle and Hunt (2002) who tried all available models (even SocetSet), it seems
that the available panoramic film models, like those for frame cameras, presume boundaries on altitude and incidence
angles that cannot work for orbital satellite platforms. Thus, the models presume a trapezoidal reprojection, which is not
the case with CORONA.
ERDAS OrthoBase Pro is a module included in the ERDAS Imagine software. Like Socet Set, it includes
sensor modelling to establish the internal characteristics associated with a specific camera or sensor with its
main purpose being the orthorectification of the imagery. However, ERDAS has no panoramic camera model
and so the only option is to use the non-metric camera model. In the non-metric camera model, the minimum
requirements are an approximate focal length and the scanning resolution used to digitise the film. The
coordinate system is defined according to the GCPs. The most difficult task was to allocate common points
between the IKONOS imagery and the CORONA imagery because of the 30 year time difference and
1
  One of the main sites of archaeological interest in the area is the tell. It looks like a small hill and stands out nicely on the flat
landscape.
physical changes to the landscape. It was also difficult to find common points between the maps and the
IKONOS imagery. The first step was registration of CORONA to IKONOS and maps to IKONOS with the
use of the Geometric Correction tool of ERDAS Imagine; thus identifying the GCPs. The height information
was derived from the maps, using simultaneous display of the three data sources (maps, CORONA,
IKONOS).
Afterwards, it was straightforward to put the same points in the CORONA imagery and create a first approximation of
the geometric relationship between the image and the ground. The next step was the automatic tie point creation, which
produced excellent results. A summary of the results is presented in Table 3.
Table 3 - Summary of the stereopairs evaluation
007-013 008-014 009-015
No of tie points/GCPs 14/11 21/11 0/13
Minimum, maximum error -7.243 m, 5.715 m -10.846 m, 10.506 m -7.622 m, 3.816 m
Mean error, mean absolute error -0.864 m, 2.766 m -0.732 m, 3.624 m -1.726 m, 2.905 m
RMS error, LE90, NIMA LE90 3.377, 5.476, ± 3.189 4.461, 6.188, ± 4.280 3.830, 7.014, ± 4.109
General mass point quality 71.81% Vs 28.19% 70.42% Vs 29.58% 67.03% Vs 32.97%
5 AUTOMATIC DEM EXTRACTION
ERDAS OrthoBase Pro automatically creates a DEM in three steps. First, it applies a digital image matching for DEM
mass point collection. With the use of Förstner interest operator (Förstner and Gülch, 1987), it identifies a series of
feature points such as road intersections or centres of circular features on each image (left and right) of the pair. The
cross-correlation coefficients are calculated for each matching feature point, and the points with the higher correlation
(0.8-1.0) are chosen as a matching pair. In other words, it utilises feature-based matching technique, but it is also
looking at the topological and geometrical relations among the features. The parameters of the digital image matching
can be customised according to each user’s needs. Among the parameters, the search window size, the correlation
window size and the correlation coefficient limit have the most influence.
The second step is the ground point coordinate determination. From the first step, a set of points is chosen in the left and
right images. With the use of the space forward intersection technique, the ground coordinates of the points are
computed to produce the mass points, which are then used as a basis for the third step, the DEM construction.
Before beginning DEM extraction, some common parameters were applied to all stereopairs. A trim frame of 2.5 % is
applied to all overlaps. The trimming occurs after the mass points are extracted and before the DEM generation. Thus,
the DEM is clipped to remove less accurate edges. The correlation area is reduced by a 5 % frame, thus preventing the
extraction of erroneous mass points that may be present at the edges of the images. The reduction occurs before the
mass points extraction.
The DEM image file pixel size was chosen to be 17 m to enable a minimum interest operator size2. The contour line
spacing was chosen to be 10 m. Because of problems caused in the DEM extraction, all clouds and their shadows were
excluded from the extraction, and they appear as black “islands” in the DEM. The extraction strategy was chosen to be
flat areas3 strategy with adaptive change applied.
6 ASSESSMENT AND DISCUSSION
During September 2002 Bridgland et al.(2003) used DGPS points to measure river terrace features. They established
their points with the use of a base GPS of known coordinates and a “rover” GPS. Because these points were not taken
from ‘sensitive’ areas (crossroads, bridges, etc.), the Syrian authorities allowed their use. For the same reason, it is
impossible to identify these points precisely on the imagery. However, it was possible to detect these points from their
Easting and Northing coordinates, and then compare their height with the height information taken from the CORONA
data stereopair. The correlation was r = 0.9954 and the spatial distribution showed no systematic error or offset.
Polidori (2002) points out that it is difficult to assess the accuracy and quality of a DEM in a quantitative way but
suggests that the following criteria / questions are important (i) are the number of reference points good enough for the
validation of the DEM extraction?; (ii) what errors may be associated with the reference points?; (iii) what level of
accuracy is required for the application?; and are data of sufficient quality available to validate the results?
In this study the number of reference points obtained was the best possible under the circumstances. Raw IKONOS Geo
product imagery was used as a horizontal reference; the contour lines of the maps were used as a height reference.
Because of the difference in time and information content between the historical CORONA and modern IKONOS
2
The methodology of the software for the DEM extraction requires a DEM cell size equal or higher to the maximal correlation
window size, whose side has size of 7 pixels. Thus, the DEM cell size could not be less than 7 pixels size.
3
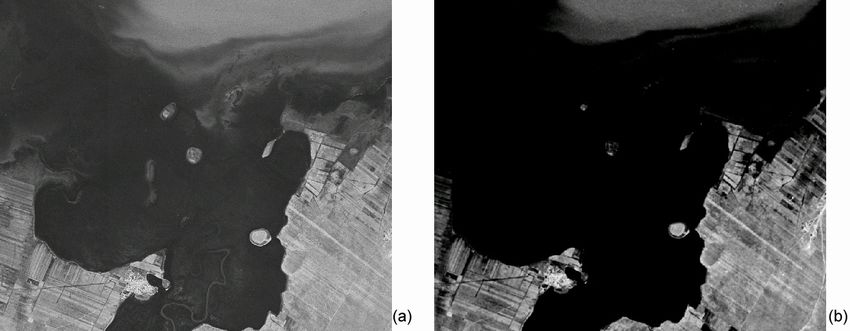
In flat areas strategy, the search size is 7 x 3 pixels, which is adequate because of the absence of errors caused by high relief.imagery, it was very difficult to define common identifiable points. This is a practical limitation of the method and its impact will vary from place to place depending on the degree of land cover change. To address Polidori’s question, the maps were registered to the IKONOS Geo product and so there is a horizontal error included in the height data. The difference in the scan mode (see table 2) may incorporate extra errors. It should be also noted that in the case of the 008-014 stereopair, some of the reference points were sampled from the registered-to- IKONOS CORONA imagery, because of the lack of adequate control for the triangulation process. Therefore, any geometric registration errors will be transferred to the DEM extraction. Perhaps this explains the magnitude of error in this stereopair in comparison with the other two (see table 3), even though this pair used more reference points than the other two stereopairs. The third question explores the issue of the precision of the DEM and its appropriateness for the given application. In this case archaeologists are aware of upstanding monuments such as tells and natural landscape features such as river terraces of known height. It is important to know if such features could be identified on automatically extracted DEMs. Figure 3 demonstrates the limitations in scale of the automatically extracted DEM. Archaeological features such as tells are not easily identifiable, while landscape features such as river channels can be distinguished. Figure 3 - Identification of archaeological features (left) and detection of river channels (right) The last question explores the availability of independent height information that can be used to validate the results. Most published papers adopt a statistical approach for describing the quality of the DEM. This usually takes the form of statistics such as RMSE, mean error and absolute error which only relate to a few measured control points. Some authors are more rigorous and use independent control points. In this study we did not have the luxury of large numbers on ground control points and so reporting accuracy in this way (see table 3) may be very misleading because of the small number of reference points and the hidden errors. Fortunately, the DGPS points can be used as independent checkpoints, and these provide a helpful validation of the results even if these data are limited in this study. An alternative approach is to compare the DEM with height information that has been derived from an alternative method such as photo interpreted contour lines and Shuttle Radar Topography Mission (SRTM) data. For the comparison of the SRTM and CORONA DEMs, the ERDAS Imagine utility ‘change detection’ was used (or ‘image differencing’). This utility reads the pixel values from two images which are assigned as ‘before image’ and ‘after image’, and produces a third image from their subtraction in the formula: Before image – After image = Final image. The final image gets the smaller pixel size (in our case, the CORONA DEM, 17m) and its boundaries are defined by the use of AOI (Area Of Interest) layer. The SRTM DEM was assigned the ‘after image’ character, and the CORONA DEM the ‘before image’. In table 4, the minus differences mean higher SRTM pixel values, while the plus differences show higher CORONA pixel values. The results show large differences at the edges (maximum-minimum) of the points’ distribution. However, this applies to a very small number of points and this can be seen from the statistic of the percentage of pixels within one standard deviation of the mean DEM altitude. The mode of the distribution shows less than a metre difference, and the mean altitudinal differences for the three DEMs are 3.30, 2.24 and 1.30 metres respectively. This shows a very good fit between the SRTM-3 and the CORONA DEMs. Some caveats were noticed in SRTM-3 DEM of the Homs area. A few areas were blank of data, and where the river has steep banks (north part of 007013 stereopair) the height values were anomalous.
Table 4 - Statistics of the differences of CORONA DEM – SRTM-3
            Statistics                             007013-SRTM           008014-SRTM           009015-SRTM
            Maximum (m)                                128.57                89.43                 92.39
            Minimum (m)                               -125.97               -93.27                -50.74
            Mean (m)                                     3.30                2.24                  1.30
            Median (m)                                  1.98                 1.32                  -0.59
            Mode (most frequently occurring)            -0.70                0.34                  -0.47
            Standard Deviation                           8.98                 7.97                 5.03
            Pixels in one standard deviation          81.36%                71.94%                77.37%
            Total overlap number of pixels           1125898               1064586               1269917

An interesting approach is to map the spatial behaviour of the errors. Horizontally, this can be illustrated with a display
of the GCPs fit error and its direction. Vertically, this can be illustrated with comparisons through overlap of the
resulting DEM with other DEMs or independent check points. The spatial behaviour of the errors may not give any
quantitative evaluation, but proves to be very useful qualitative guide to accuracy.

7    CONCLUSIONS

The research has demonstrated that it is important to be aware of CORONA image characteristics which might impact
on photogrammetry. No two CORONA missions were the same and in many missions with stereoscopic capability, the
two camera systems (aft and forward) were not the same.
If scanned with care, the CORONA image quality provides high levels of detail on ground features. The scanning
should be done using a photogrammetric scanner for best geometric and radiometric results. The geometric precision of
the scanning should be done in balance with the radiometric precision if the user wishes to get the most from the
imagery. Also, the scanner should be sufficiently calibrated and the scanning parameters should be kept the same
between image pairs. However, the detail and process of digitising of CORONA imagery depends on the application.
When the preprocessing is done with care and there is understanding of the data, then three-dimensional information
can be extracted from CORONA imagery using only a small number of GCPs. If good quality map data are not
available, the horizontal location of GCPs can be obtained from IKONOS Geo product satellite imagery. In this study,
height information was derived from maps, although points fixed from a Differential GPS can also be used and may
even improve the accuracy of the model.
The methods described here were not expected to yield excellent results because of the limited amount of ground
control that was available. However, the CORONA DEM data compares well with other sources of height data which
suggest that the data are useful. Results show that the methodology is robust and so it would be interesting to test the
approach in other areas where ground control is difficult to obtain. Satellite ephemeris and attitude data, and specialist
panoramic image processing software, all of which are difficult to obtain, are not in fact necessary.

8    ACKNOWLEDGEMENTS

Nikolaos Galiatsatos gratefully acknowledges the support of his respective funding body- the Hellenic State Scholarship
Foundation, speciality T1327.06, contract 368. Many thanks to Bob Taft of Leica for providing the panoramic model
for Socet Set, to Dr John Mills of Newcastle University for use of Socet Set in his laboratory, to The Council for British
Research in the Levant and the Research Committee of the University of Durham for financial and logistical support.
Particular thanks are due to Prof. Sultan Muhesen and Dr. Abd el-Razzaq Muath, Directors General of Antiquities and
Museums (DGAM) in Damascus and their staff who have helped the project in numerous ways. Local support has been
provided by Mr Farid Jabour and Ms Maryam Bshesh of the Homs office of the DGAM.

9    REFERENCES

Altmaier, A., and Kany, C. (2002), Digital surface model generation from CORONA satellite images, ISPRS Journal of
photogrammetry and remote sensing, vol. 56, No. 4, pp. 221-235.
Beck, A.R., Philip, G., Donoghue, D.N.M., and Galiatsatos, N., (in press), Geo-locating declassified CORONA satellite
photography for archaeological surveys and cultural resource management applications: an interim paper, Workshop on
aerial archaeology and remote sensing, Siena, Italy.
Bindschadler, R., and Vornberger, P., (1998), Changes in the west Antarctic ice sheet since 1963 from declassified
satellite photography, Science, vol.279, 30th January, pp.689-692.
Bridgland, D.R., Philip, G., Westaway, R., and White, M., (2003), A long Quaternary terrace sequence in the Orontes
river valley, Syria: a record of uplift and of human occupation, Current Science, vol.84, No.8, pp.1080-1089.
Case, J.B., (1967), The analytical reduction of panoramic and strip photography, Photogrammetria, p.127-141. Day D.A., Longson J.M., and Latell B. (eds.) (1998), Eye in the sky – The story of CORONA spy satellites, Smithsonian Institution Press, Washington and London. Deveraux, Jr. A.B., (1973), Investigations into the feasibility of employing a hypothetical panoramic-frame camera system in aerial triangulation, PhD submitted in the Geodesy department of The Ohio State University. Förstner, W., and Gülch, E., (1987), A fast operator for detection and precise location of distinct points, corners and centers of circular features, Intercommision conference on fast processing of photogrammetric data, Interlaken, Switzerland, pp.281-305. Fraser, C.S., Hanley, H.B., and Yamakawa, T., (2002a), Three-dimensional geopositioning accuracy of IKONOS imagery, Photogrammetric record, vol. 17, No. 99, pp. 465-479. Galiatsatos, N., (2004), Assessment of the CORONA series of satellite imagery for landscape archaeology: a case study from Orontes valley, Syria. Dissertation for the degree of Doctor of Philosophy, University of Durham, United Kingdom. Goossens, R., Schmidt, M., Altmaier, A., Benoit, F., and Menz, G., (2001), Extraction of Digital Elevation Models and ortho-images from CORONA KH4B data, Proceedings of ISPRS Workshop: High resolution mapping from space, Hannover, Germany. Goossens, R., (2004), personal communication. Madden, F.J., (1996), The CORONA camera system: Itek's contribution to world stability, self-published. Leachtenauer, J.C., Daniel K., and Vogl, P.T. (1997), Digitising Corona Imagery: Quality vs. Cost. In McDonald, Robert A., (ed.) (1997), Corona Between the Sun and the Earth The First NRO Reconnaissance Eye in Space, American Society for Photogrammetry and Remote Sensing, Bethesda, MD McDonald, R.A., (ed.), (1997) CORONA Between the Sun and the Earth The First NRO Reconnaissance Eye in Space, American Society for Photogrammetry and Remote Sensing, Bethesda, MD. National Reconnaissance Office (NRO), (1970a), CORONA technical information volume 1, National Photographic Interpretation Centre, December 1970. National Reconnaissance Office (NRO), (1970b), CORONA technical information volume 2, National Photographic Interpretation Centre, December 1970. Ondrejka, R., (2000), personal communication. Palmer, R., (2002), A poor man’s use of CORONA images for archaeological survey in Armenia, Proceedings of the conference: Space applications for heritage conservation, Strasbourg, France. Peebles, C., (1997) The CORONA project: America’s first spy satellites, Naval Institute Press, Annapolis, Maryland. Philip, G., Jabour, F., Beck, A., Bshesh, M., Grove, J., Kirk A., and Millard, A., (2002), Settlement and landscape development in the Homs region, Syria: research questions, preliminary results 1999-2000 and future potential. Levant, 34, pp.1-23. Polidori, L., (2002), DSM quality: Internal and external validation, in: Kasser, M. and Egels, Y., (eds.), Digital Photogrammetry, Taylor and Francis: London and New York. Pournelle, J., and Hunt, L., (2002), personal communication. Ruffner, K. (ed.), (1995), CORONA: America’s First Satellite Program, Center for the Study of Intelligence, Government Printing Office, Washington D.C. Schenk, T, Csathó, B., and Shin, S.W., (2003), Rigorous panoramic camera model for DISP imagery, Proceedings of the ISPRS Workshop “High resolution mapping from space”, Hannover, Germany. Schmidt, M., Goossens, R., and Menz, G. (2001a), Processing techniques for CORONA satellite images in order to generate high-resolution digital elevation models (DEM), In: Begni, G., (ed.), Observing our environment from space: New solutions for a new millennium, Lisse, The Netherlands, pp. 191-196. Schmidt, M., Goossens, R., Menz, G., Altmaier, A., and Devriendt, D., (2001b), The use of CORONA satellite images for generating a high-resolution digital elevation model, Proceedings of the 2001 IGRASS Symposium, Sydney. Shin, S.W., (2003), Rigorous model of panoramic cameras. Dissertation presented in partial fulfilment of the requirements for the degree Doctor of Philosophy. Department of civil and environmental engineering and geodetic science, Ohio State University, 104 p. Slama, C.C., Theurer, C., and Henriksen, S.W., (eds.) (1980), Manual of Photogrammetry, American Society of Photogrammetry. Sohn, H.G., Kim, G., Yom, J., (2004), Mathematical modelling of historical reconnaissance CORONA KH-4B imagery, The photogrammetric record, vol.19, issue 105, pp. 51-66. Tappan, G.G., Hadj, A., Wood, E.C., and Lietzow, R.W., (2000), Use of Argon, Corona and Landsat imagery to assess 30 years of land resource changes in west-central Senegal, Photogrammetric engineering and remote sensing, vol.66, No.6, pp.727-735. Thom, C., (2002), Relations between radiometric and geometric precision in digital imagery, in: Kasser, M. and Egels, Y., (eds.), Digital Photogrammetry, Taylor and Francis: London and New York.
You can also read