New Passive Acoustic Monitoring in Monterey Bay National Marine Sanctuary
←
→
Page content transcription
If your browser does not render page correctly, please read the page content below
New Passive Acoustic Monitoring in Monterey Bay
             National Marine Sanctuary
                   Exploring natural and anthropogenic sounds in a deep soundscape

  J. Ryan, D. Cline, C. Dawe, P. McGill, Y. Zhang                                       A. DeVogelaere
            MBARI, Moss Landing, CA, USA                                         MBNMS, Monterey, CA, USA

                J. Joseph, T. Margolina                                                   A. Stimpert
                NPS, Monterey, CA, USA                                         MLML, Moss Landing, CA, USA

                 M. Caillat, M. Fischer                                                    B. Southall
             San Jose; Santa Clara, CA, USA                                       UCSC, Santa Cruz, CA, USA

    Abstract—Understanding the marine soundscape is of
growing importance to the National Marine Sanctuaries. In the                            I. INTRODUCTION
center of Monterey Bay National Marine Sanctuary, a new                Understanding the soundscape, as well as the impacts of
Passive Acoustic Monitoring (PAM) project has begun. Using         human generated noise on natural acoustic habitat and
the power and communications infrastructure of the Monterey        populations, is growing in importance in both terrestrial and
Accelerated Research System (MARS) cabled observatory, we
                                                                   aquatic systems. As environments for which federal agencies
deployed a broadband, digital, omnidirectional hydrophone on
Smooth Ridge, near the MARS node (36°42.75’N, 122°11.21’W;
                                                                   are charged with stewardship, National Parks and Marine
depth 891 m). The system has been recording almost                 Sanctuaries are important foci for informing management
continuously since 28 July 2015. Natural biological sound          through soundscape monitoring and research [1-3]. In marine
(biophony) dominated long-term spectral average results at         environments, noise concerns include both acute and chronic
frequencies below 50 Hz, showing seasonal patterns in baleen       effects [3,4]. While acute noise sources have received
whale vocalizations. Prevalence of blue whale vocalizations        attention due to dramatic impacts on marine mammals
during August through October 2015 was succeeded by                observed in some regions, chronic noise is increasingly being
prevalence of fin whale vocalizations during November 2015         recognized as a global issue that must be addressed regionally
through January 2016. Diel variations (stronger signal at night)   through ecosystem based management [3]. Chronic noise can
were evident for both species. In the high-frequency range,        persistently and progressively degrade acoustic habitat, thereby
beaked whale clicks have been detected and represent a focus for   interfering with essential life activities of animals who rely on
advancing automated detection and classification methods.          sound for communication, navigation and foraging.
Biophonic richness in this soundscape was also indicated by
human-expert analysis results for a one-week period, during            Because marine biophony, geophony and anthrophony
which biological sound events were detected 86% of the time.       (soundscape components catagorized as in [5]) span a vast
Examination of natural physical sound (geophony) has included      frequency range, effective soundscape research requires
rainfall and the relationship between wind speed and ambient       recording at a high sample rate across a broad frequency range.
sound. The first 10 months of data showed that sound levels at 2   Data storage and power requirements can limit stand-alone
kHz followed Wenz curve predictions for wind speeds above 5        hydrophone deployments, reducing duration or requiring
m/s. Examination of human-made sound (anthrophony) has             discontinuous time-series collected in duty cycles. The
included noise from vessel traffic and explosions detonated        communications and power infrastructure of cabled
underwater during fishery operations. This new PAM project is      observatories can bypass these constraints, enable more
providing extensive information on biophony, geophony, and         effective recording of marine soundscapes, and allow real-time
anthrophony in this deep soundscape, information that is           observation. In this project, we employ the Monterey
essential to understanding and managing acoustic habitat of the    Acclerated Research System (MARS) cabled observatory,
Sanctuary.
                                                                   which extends from the coast of central Monterey Bay,
   Keywords—passive acoustic monitoring; hydrophone; cabled
                                                                   California, offshore to the continental slope (Fig. 1).
observatory; marine mammals; marine noise; Monterey Bay                The MARS site, in the heart of Monterey Bay National
National Marine Sanctuary                                          Marine Sanctuary (MBNMS, Fig. 1) was expected to be an
                                                                   effective location for soundscape research. It was anticipated
                                                                   that this deep environent would be less impacted by sound
                                                                   sources typical of shallower environments, including

      978-1-5090-1537-5/16/$31.00 ©2016 IEEE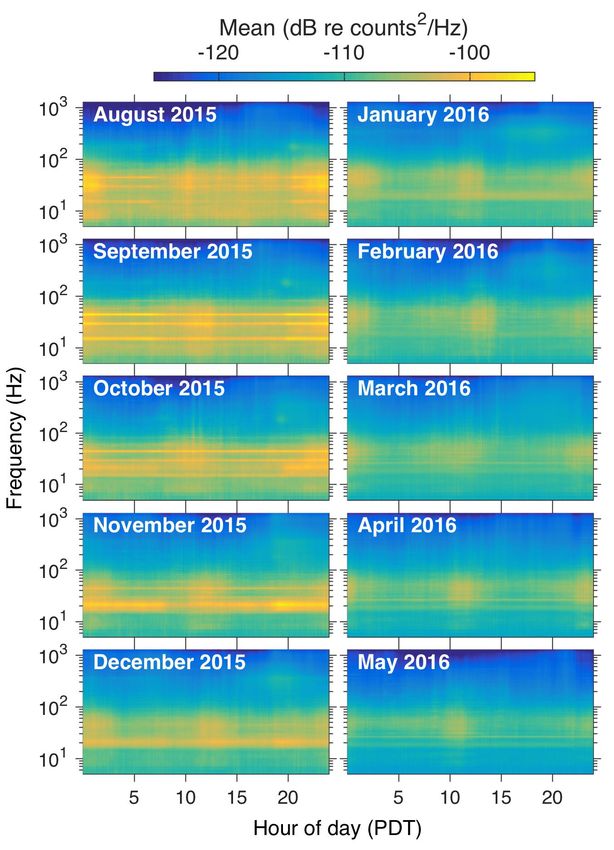
California coast [6-8] and is adjacent to blue whale foraging
                                                                                habitat along the continental shelfbreak, where dense krill
                                                                                swarms form [9]. MARS was also considered to be a
                                                                                potentially good location from which to acoustically study one
                                                                                of the more enigmatic marine mammals, beaked whales.
                                                                                These odontocetes live in small groups, are deep divers, and
                                                                                have a relatively low visual profile during surfacing, thus
                                                                                making them difficult to study using visual surveys [10-12].
                                                                                Hydrophones in deep water (840 m) off Point Sur, at the
                                                                                southern end of Monterey Bay, recorded beaked whales in each
                                                                                of four deployments between August 2008 and August 2010.
                                                                                These recordings also indicated the value of continuity, as the
                                                                                most frequent detections of beaked whales occurred in the
                                                                                deployment having the highest percentage of recording time
                                                                                (50% duty cycle of 5 minutes on/off). In this deployment about
                                                                                1/3 of the total days contained at least one bout of beaked
                                                                                whale vocalization [13]. The whales’ deep-water foraging, and
                                                                                the short range over which their high-frequency clicks can
                                                                                travel (< 4 km) motivate research employing continuous
                                                                                recording in deep water, as the MARS infrastructure provides.
                                                                                    It is a formative time for ocean noise policy. In June 2016
                                                                                NOAA released a draft Ocean Noise Strategy Roadmap
                                                                                intended to inform and coordinate agency-wide action in
                                                                                marine soundscape management [3,4]. The roadmap identifies
                                                                                the National Marine Sanctuaries as key assets to achieve the
                                                                                ecological goals of acoustic habitat protection. Located in the
                                                                                central MBNMS, this new passive acoustic monitoring project
                                                                                aims to better understand the biophony, geophony, and
                                                                                anthrophony of a deep-water protected environment, to explore
                                                                                relationships between biophony and ecosystem variation over
                                                                                time scales ranging from episodic (upwelling) to interannual
                                                                                (El Niño – Southern Oscillation), and to examine the
                                                                                intersection of biophony and anthrophony toward informing
                                                                                management of acoustic habitat.

                                                                                                       II. METHODS

                                                                                A. Data Acquisition
                                                                                    Soundscape recording employs an Ocean Sonics icListen
                                                                                HF, a broadband, digital, omnidirectional hydrophone with a
                                                                                bandwidth of 10 Hz to 200 kHz. It has sampled almost
                                                                                continously at 256 kHz since deployment on 28 July 2015.
                                                                                Data are streamed directly to the Ocean Sonics Lucy software
                                                                                for shore-side recording. Delayed detection of network
                                                                                problems occasionally caused recording outages lasting from
                                                                                hours to days, however improvements to the recording
                                                                                infrastructure reduced outages as the time-series progressed.

Fig. 1. Passive acoustic monitoring in Monterey Bay National Marine             B. Data Analysis
Sanctuary. (a) Sanctuary boundaries are in green; the red line shows the path
of the MARS cable, with the terminal node on Smooth Ridge (36°42’45’’ N,
                                                                                    To examine the first ten months of recordings (August
122°11’13’’W, 891 m depth). The white lines show the western and eastern        2015 through May 2016), we computed power spectral density
boundaries of commercial ship traffic lanes in the Monterey Bay region. (b)     estimates using the Long-Term Spectral Average (LTSA)
Hydrophone deployment on 28 July 2015, following connection to the MARS         method in Triton (cetus.ucsd.edu/technologies_Software.html),
node and spooling 70 m of extension cable. The hydrophone is affixed to the     adapted for efficient execution in a HTCondor pool of
top of the tripod, approximately one meter above the seafloor.                  computers [14]. These computations were parameterized for
recreational boat traffic, snapping shrimp, and surf break.                     three frequency ranges, appropriate for vocalizations from
MARS is also well placed relative to the migration paths of                     different species (Table I). Daily LTSA results were bin
species that move equatorward and poleward along the                            averaged to monthly means resolved at 15s resolution through
                                                                                the day, essentially describing sound energy variation through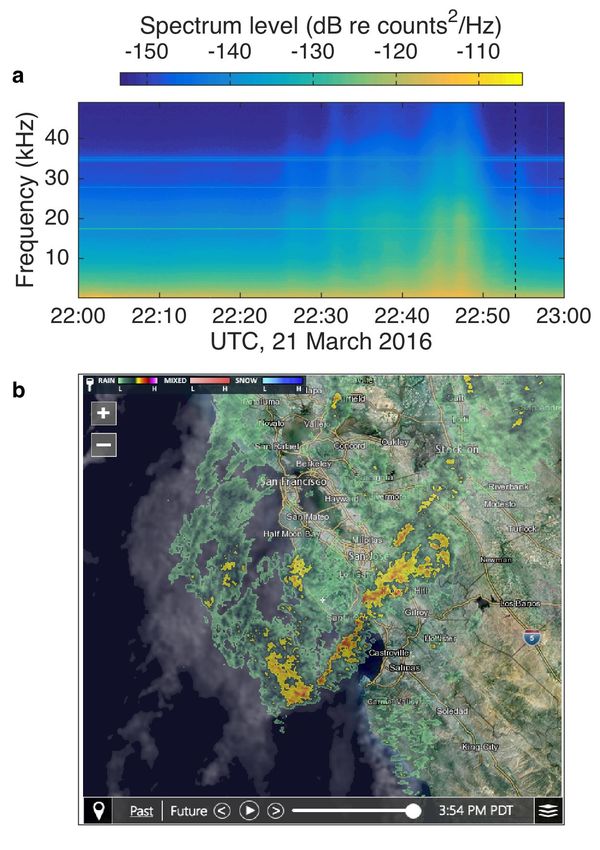
an average day during each month. We present results for the            example results from all three LTSA computations (Table I)
low-frequency range to illustrate seasonal and diel variations in       were subset to non-overlapping frequency ranges and
blue and fin whale vocalizations.                                       combined to produce a spectrogram spanning the full
                                                                        frequency range (0 to 128 kHz). To characterize noise
         TABLE I.        LTSA PARAMETERIZATION FOR TRITON
                                                                        originating from the offshore shipping lanes (Fig. 1), we
                                                                        examined recordings from 30 – 31 December 2015, when the
                                     Signal frequency range             largest container vessel to dock in a US port, the CMA CGM
       Parameter
                              low             mid              high     Benjamin Franklin, first transited along the west coast between
  Frequency range (Hz)    0 to 1,280       0 to 6,400    0 to 128,000
                                                                        the ports of LA and Oakland, passing by Monterey Bay. To
                                                                        characterize noise from a fishery explosion, an example was
  Frequency bin (Hz)           1              10               100      selected from early in the recording period (3 August 2015),
                 -1
  Sample rate (s )           2,560          12,800            256,000   and its signal was represented as waveform and spectrogram.

  Samples per FFT            2,560           1,280             2,560
                                                                                                  III. RESULTS
  Time bin (s)                 5               5                5           The results are organized as follows. In section A, an
                                                            beaked,     overview of low-frequency (0–1 kHz) variability is presented
                                           humpback       sperm, and    using the first 10 months of recordings. In section B, biophony
                          blue and fin
  Target species                           and minke         killer
                            whales
                                             whales         whales;     is examined using low-frequency LTSA results and human-
                                                           dolphins     expert analyses of the full frequency range that can be analyzed
                                                                        from the recordings (0–128 kHz). In section C, geophony is
                                                                        examined for the cases of long-term variation in wind and
    To examine biophony in detail during a one week period,             short-term variation due to a rain squall. In section D,
recordings from 25 – 31 October 2015 were analyzed                      anthrophony is examined for the cases of near and far vessel
interactively using the PAMGUARD software [15,16],                      traffic, and fishery explosions.
including detectors for clicks, whistles and moans [17,18].
Analyses were separated into frequency ranges above and                 A. Overview of low-frequency LTSA results
below 500 Hz. For the low frequency band, original 256 kHz
data were decimated to 1 kHz, and baleen whale vocalizations                Monthly LTSA results reveal modulation of the soundscape
were detected by visual inspection of LTSA plots generated by           on seasonal and diel time scales (Fig. 2). Most of the
PAMGUARD (not Triton results described above for the long-              variations occur below 100 Hz. The most energetic features
term analyses). For the high-frequency band, which includes             are bands of high power spectral density at specific
toothed whale and delphinid vocalizations, detector modules             frequencies, for example three dominant frequency bands
for clicks and whistles were applied to original 256 kHz data,          (centered at 15, 29 and 44 Hz) during August through October
and automated results were checked by visual inspection. Start          2015, transitioning to one dominant band (centered at 21 Hz)
and end times of all detections were recorded, and species              during November – December 2015. Diel variations are also
identification was attempted manually based on waveform and             indicated in these bands. For example, the 44 Hz band during
spectrogram plots. For unidentified detections, if the signal was       September exhibited 6% variation about the daily mean, and
too faint to distinguish from ambient noise, the detection was          the 21 Hz band during November exhibited 8% variation about
not used. Summary of results was based on defining                      the daily mean. These signals are of biological origin and
vocalization events as the presence of marine mammal                    illustrate the dominance of biophony in this low frequency
vocalizations with less than 10 minutes between detections,             range. They are examined in relation to species’ vocalizations
and then quantifying the percentage of the total time containing        in the next section. A second feature evident in all months is
vocalization events.                                                    the occurrence of clouds of enhanced sound energy near
                                                                        midnight and midday, largely within the frequency range of 10
    Examination of geophony focused on wind and rain. To                to 100 Hz. The clouds are broader in frequency range than the
examine sound variation due to wind, power spectral density at          bands and do not persist throughout the day as the narrower
2 kHz was extracted from the mid-frequency range LTSA                   bands do. There is some indication of seasonal modulation in
results (Table I) and compared to wind speed measured at                the timing of the midday cloud, becoming later during winter
NDBC station 46042, located 25 km WNW of MARS                           (Fig. 2). The origin of these features has not yet been
(36°47'29" N 122°27'6" W).           Hourly wind data were              examined.
interpolated to the 5-second time reference of LTSA results, so
that the influence of transient sounds on this relationship would       B. Biophony
be evident.      Observational results were compared with
theoretical predications using values extracted from Wenz                   The relatively high-energy bands in the LTSA results (Fig.
curves [19,20] computed for a range of wind speeds.                     2) correspond with vocalizations of baleen whales. The three
                                                                        bands that were most energetic during August through October
   Examination of anthrophony focused on two common noise               2015 were centered at 15, 29 and 44 Hz (Fig. 2). Averaging
sources, vessel traffic and fishery explosions. To characterize         across these months and the full daily cycle clearly defines
noise from a typical vessel transit near the hydrophone, an             these peaks (Fig. 3a), which are caused by blue whale
example was selected from early in the recording period (3              vocalizations (B calls) and associated harmonics (Fig. 3b).
August 2015), based on examination of LTSA plots. For this              Additionally, a more subtle peak centered at 80 Hz is indicative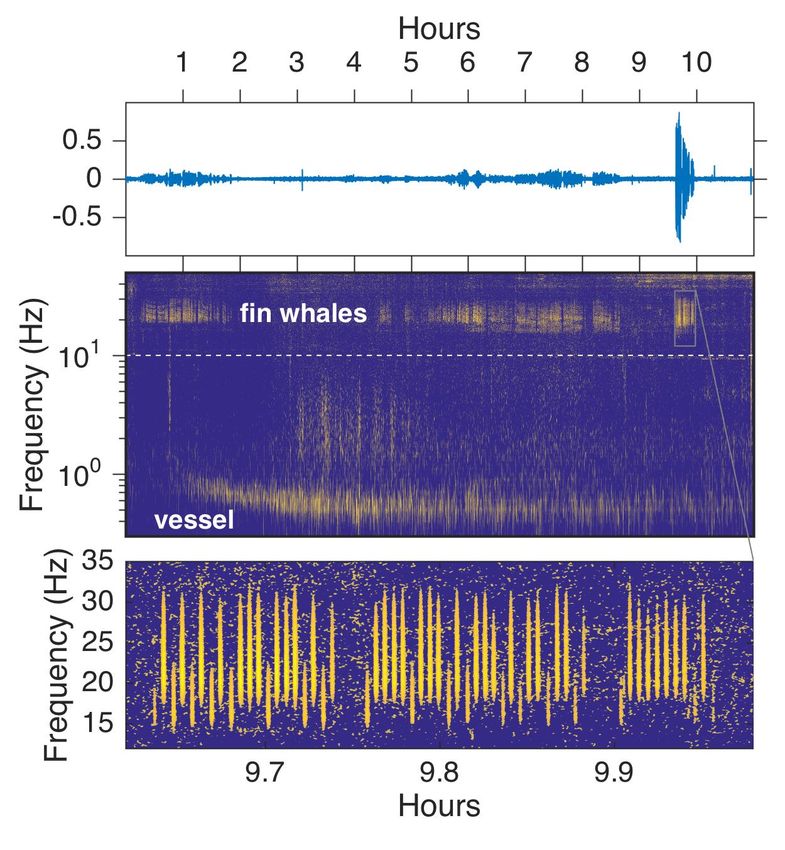
whistles, with an average event length of 2.71 hours. Nine
events were longer than 5 hours, and two were longer than 10
hours with continuous clicking and/or whistling.
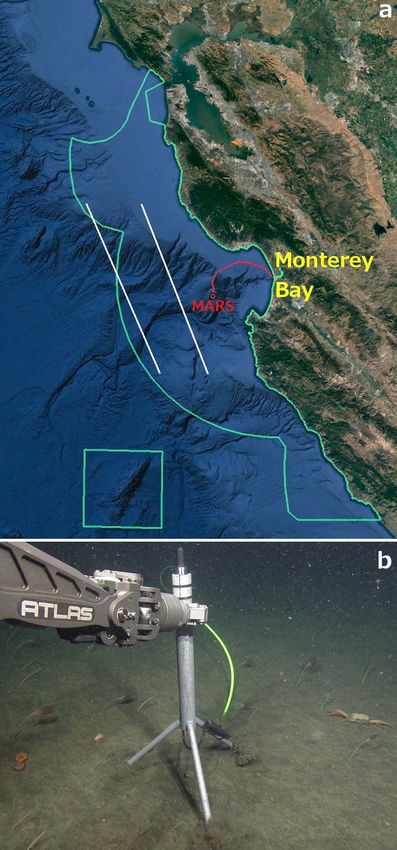
At the high-frequency end of biophony are a great variety
of odontocetes clicks. As described in the introduction, beaked
whales are of particular interest, and reliable identification of
their clicks is essential. An example of a beaked whale click is
shown in Fig. 4, exhibiting peak energy centered at ~ 32 kHz,
a duration of ~ 0.3 milliseconds, and 18 zero crossings.
Beyond the challenges of positive identification inherent in the
biological signal (variation in click attributes within a species,
overlap of click attributes among odontocetes, variations in
Fig. 2. Mean daily soundscape variations from low-frequency LTSA power
spectral density (Table I) for the first 10 months of hydrophone data.
of another type of blue whale vocalization (A calls, Figure 3a).
The band that was most energetic during November 2015
through January 2016 was centered at 21 Hz (Fig. 2).
Averaging across these months and the full daily cycle clearly
defines this peak (Fig. 3a), which is caused by fin whale
vocalizations (Fig. 3c). While seasonal variation in the
dominant baleen whale vocalization frequencies is pronounced,
temporal overlap is also clear – evident as the blue whale peaks
at 29 and 44 Hz coincident with the fin whale peak at 21 Hz in
the November 2015 through January 2016 mean (Fig. 3a and
corresponding LTSA results in Fig. 2).
Over the 7-day period analyzed by a human expert,
vocalization events occupied 86% of the 168 hours (Table II).
The percentage of time for which low frequency vocalization
events were detected (79%) was greater than that for high
frequency (55%). The majority of the low frequency Fig. 3. Biophony: seasonal change in low-frequency vocalization energy.
(a) Seasonal averaged LTSA spectra, computed from selected months of
detections were of blue whales (B calls), fin whales and LTSA results (Figure 2). Months were grouped (legend) based on
humpback whales, often vocalizing concurrently. With clicks similarity of dominant patterns. (b) Example waveform and spectrogram
and whistles, it is more difficult to identify the species plots of blue whale vocalizations (B calls and harmonics) causing the
vocalizing. However the detection of clicks and whistles August – October peaks at 15, 29 and 44 Hz. (c) Example waveform and
indicates the animal was relatively near the hydrophone spectrogram plots of fin whale vocalizations causing the November –
January peak at 21 Hz. MARS recordings in (b) and (c) were low-pass
because their high-frequency energy cannot travel far; for
filtered with a 100 Hz cutoff and normalized for representing the
example delphinid clicks travel 1–2 km [21-23]. Two events waveform and spectrogram. Dashed lines in the spectrograms of (b) and
of beaked whale clicks were identified. The 92.18 hours of (c) correspond with those defined in (a).
high-frequency detections came from 34 events of clicks and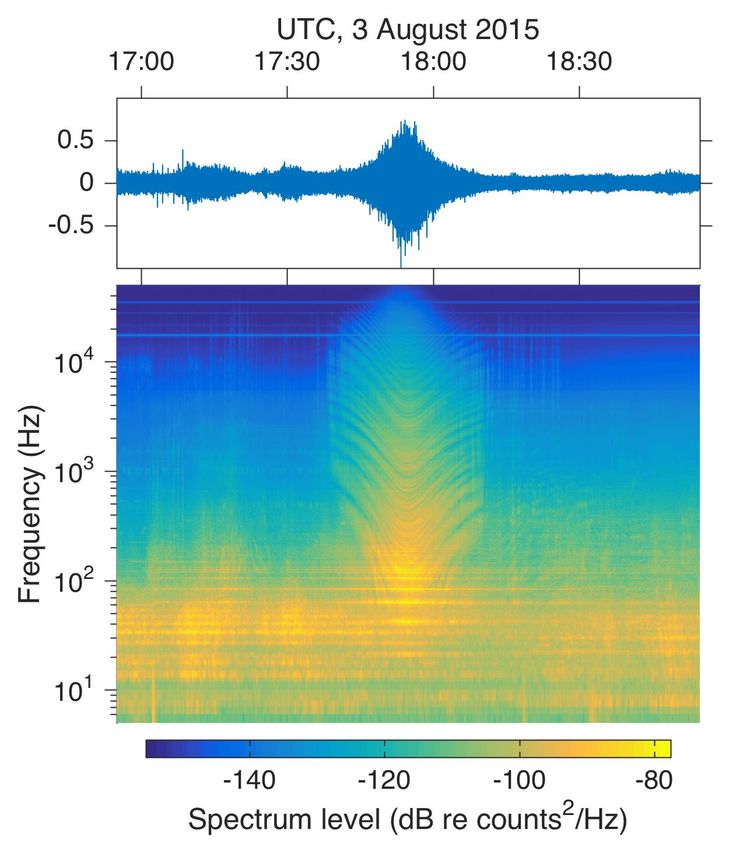
signal due to variations in distance and orientation of the                  physical phenomena is also shown by the passage of a rain
source relative to the hydrophone), analysis is complicated by               squall over the MARS site (Fig. 6). Passage of a squall was
high-frequency noise originating from the MARS node (Fig.                    suggested by observations of the real-time spectrogram on 21
4). We cannot yet definitively identify the species associated               March 2016, as rising broadband signal below ~ 50 kHz, and
with this click, however its attributes are consistent with prior            brief (~ 2 minute) periods of maximum signal (Fig. 6a, maxima
identifications of beaked whale clicks in recordings from deep               between 22:40 and 22:50). Examination of weather radar
water off Point Sur [11,13]. Methods development is presently                showed that a squall had recently passed over the hydrophone
underway, including reducing influence of MARS noise, and                    during its eastward movement (Fig. 6b; image time indicated in
comparison of detectors developed for PAMGUARD with                          Fig. 6a).
emerging wavelet-based detection and classification.

         TABLE II.         BIOPHONY DURING 25 – 31 OCTOBER 2015
               Frequency range               Detections
                    (Hz)                 (hours, % of total)
             0 – 128,000                    144.25, 86%

             0 – 500                        132.17, 79%

             500 – 128,000                  92.18, 55%

C. Geophony
    The first 10 months of LTSA results for the mid-frequency
range (Table I) show a clear relationship to wind speed (Fig.
5). Power spectral density at 2 kHz followed Wenz curve
predictions for wind speeds above ~ 5 m/s. The narrowing
envelope of sound levels toward higher wind speeds is
determined by an increasing sound level minimum, and it
indicates the increasing influence of wind-driven processes as a
sound source. Under the umbrella of surface roughness, the                   Fig. 5. Geophony: wind influenced sound. Relationship between wind speed
processes by which wind generates sound include wave                         measured at NDBC Station 46042 (36°47'29" N 122°27'6" W, 25 km WNW
breaking (whitecaps), cavitation, flow noise, and generation of              of MARS) and 2 kHz sound levels quantified by LTSA power spectral density
                                                                             of MARS hydrophone data. Contours are log10 (number of observations). The
an interacting wave spectrum by wind turbulence at the air-sea               thick gray line is the Wenz curve estimate at 2 kHz.
interface [20]. Below wind speeds of ~ 5 m/s, other sources of
sound dominate, including local transient sound sources and
distant shipping noise, and the Wenz curve is not predictive                    Both of these sources of geophony originate at the surface
(Fig. 5).                                                                    and tend to travel more vertically and direct path [20]. Thus, in
                                                                             contrast to seismic sources of geophony, they represent more
    The sensitivity of deep-water acoustic signals to surface                specifically the local soundscape.

                                                                             D. Anthrophony
                                                                                 Sounds of local vessel transits and operations of vessel
                                                                             machinery are clearly discernible in listening to the MARS
                                                                             recordings. A typical local vessel transit shows a number of
                                                                             features (Fig. 7): (1) The sound impacts a large frequency
                                                                             range (~ 20 Hz to 50 kHz). (2) The sound begins in mid range
                                                                             (~ 500 Hz to 15 kHz) and spreads to higher and lower
                                                                             frequencies as the vessel approaches the hydrophone. (3)
                                                                             Departure mirrors approach, and the affected frequency range
                                                                             correspondingly narrows. The broadband energy suggests a
                                                                             smaller vessel, and fishery explosions detected this same day
                                                                             suggest that this example transit may represent a fishing vessel,
                                                                             however we cannot specifically match this sound to vessel
                                                                             type. The example, selected at random, suggests a quieter
                                                                             background after the vessel transit than before (Fig. 7). The
Fig. 4. Biophony: example of a beaked whale click detected on 28 October     many examples of local vessel transits will allow us to examine
2015, within a period of increased beaked whale click detections. (a)
Waveform represented as normalized amplitude. (b) Spectrogram computed
                                                                             and statistically evaluate this suggested pattern.
with nfft = 85, overlap = 95, and Hanning window; represented as relative
spectral level. The continuous signal centered near 50 kHz is due to noise
from the MARS power system.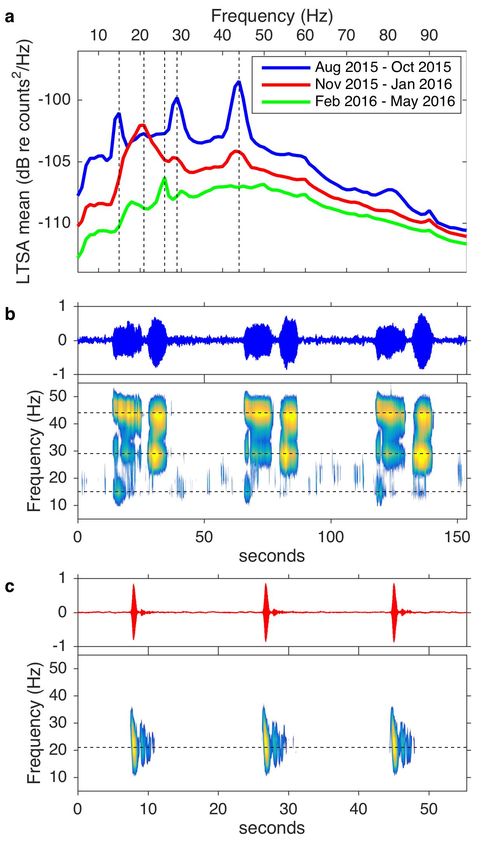
Fig. 7. Anthrophony: a typical boat transit detected by the hydrophone,
                                                                              represented as normalized waveform (top) and LTSA power spectral density
                                                                              (bottom).

                                                                              deployment of the hydrophone and were later confirmed to be
                                                                              explosions detonated underwater during squid fishery
Fig. 6. Geophony: acoustic detection of a rain squall. (a) LTSA during one
hour on 21 March 2016. (b) Weather radar image shows the squall line
                                                                              operations (A. Meyer Loebbecke and S. Baumann-Pickering,
having passed over of the MARS location (image time indicated by the dashed   Scripps Institution of Oceanography, personal communication).
line in (a). The squall moved west to east.                                   The intention of these detonations is to deter interference in
                                                                              fishing operations by curious and hungry pinnipeds (seals, sea
                                                                              lions). The sudden nature of the sound is pronounced in both
    Distant noise originating from the offshore shipping lanes                the waveform and spectrogram representations (Fig. 9). The
(Fig. 1) is also of interest. Massive container vessels recently              intensity is accurately represented relative to background in the
built have the potential to reduce noise from commercial                      waveform plot of the unfiltered recording. During the hour
shipping operations, by reducing the number of ships required                 from which this example was taken, beginning at 11:00 on 3
to transport goods, and by design for quieter operation. The                  August 2015 (UTC), nine such explosions were detected.
CMA CGM Benjamin Franklin is the largest container vessel                     Temporal variations in the occurrence of explosions are being
to dock in a US port, and its maiden voyage along the US west                 examined with the first six months of recordings (A. Meyer
coast occurred as the ship transited between the ports of LA                  Loebbecke and S. Baumann-Pickering, Scripps).
and Oakland on 30 – 31 December 2015. This transit passed
by the MARS hydrophone, and its very low frequency sound                                      IV. SUMMARY AND DISCUSSION
(< 1 Hz) was detected (Fig. 8). This frequency is below the
lower limit of the hydrophone’s bandwidth (10 Hz), however                        In the vast and largely dark ocean, sound is an essential
diminished response at lower frequencies is recorded.                         dimension of life, used by animals in diverse ways to navigate,
Production of sound at these low frequencies is consistent with               communicate, and forage. Sound is thus also an essential
the size and rotation rate of the vessel propeller as it transited at         dimension of ocean stewardship. As environments in which
approximately half of its maximum speed [24]. Ecologically,                   stewardship efforts are focused, the National Marine
the striking feature of this recording is that the vessel noise was           Sanctuaries are ideal places in which to further our scientific
well below the frequency range of fin whale vocalizations (Fig.               knowledge of soundscapes, as a basis for informed
8), presumably minimizing direct interference with animal                     management. Toward this purpose, the recent deployment of a
communication.                                                                hydrophone on a cabled observatory in the heart of Monterey
                                                                              Bay National Marine Sanctuary represents a unique and
   The final example of anthrophony is a fishery explosion.                   effective scientific resource. The continuity of this data stream
These distinct sounds were noticed shortly following                          supports more complete examination of the soundscape than is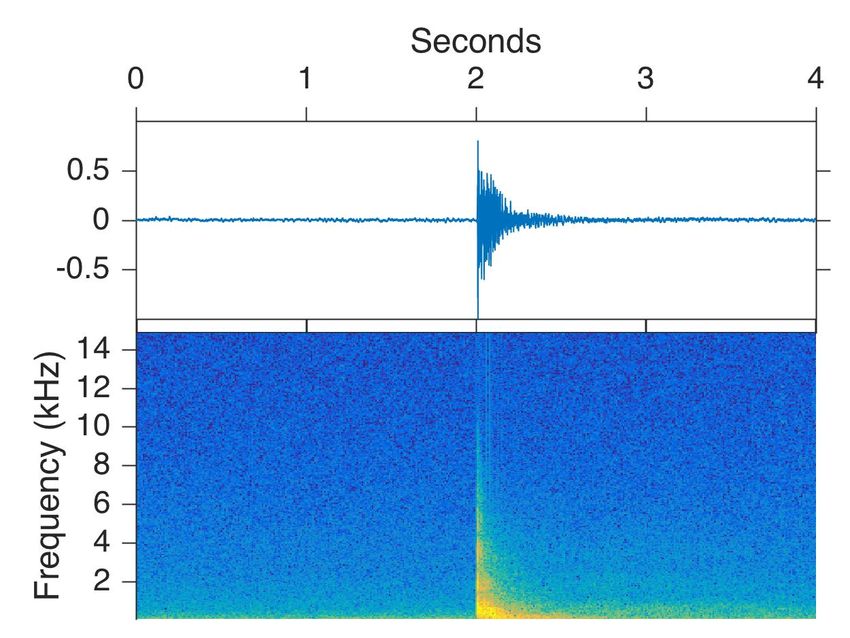
dimensions of anthrophony, such as vessel noise from near to
                                                                                  far sources and explosives detonated underwater. The complex
                                                                                  intersections of anthrophony and marine life are very
                                                                                  important to understand and manage.

                                                                                  Fig. 9. Anthrophony: acoustic detection of a fishery explosion (‘seal bomb’),
                                                                                  represented as waveform (top) and the log of power spectral density (bottom).
Fig. 8. Anthrophony: acoustic detection of distant shipping noise, specifically
from the largest container vessel to dock in a US port, the CMA CGM
Benjamin Franklin. The vessel transited offshore of the MARS hydrophone                                      ACKNOWLEDGMENT
(Figure 1) during its first passage between the Ports of Los Angeles and
Oakland. The start time of this recording is 30 December 2015 23:00 PST.          This project was supported by the Monterey Bay Aquarium
Shown are waveform (top), the log of power spectral density (middle), and a       Research Institute, through a grant from the David and Lucile
zoom on the period of most active fin whale vocalization (bottom, domain
delineated by the box in the middle panel). In the middle panel, the dashed
                                                                                  Packard Foundation. The National Science Foundation funded
line marks the low end of the range for the hydrophone’s bandwidth                installation and maintenance of the MARS cabled observatory
specification.                                                                    through awards 0739828 and 1114794. We thank David
                                                                                  French and Ken Heller of the MARS Operations team for the
possible from stand-alone deployments. Real-time data flow to
                                                                                  hydrophone deployment efforts.
shore introduces possibilities for event detection and response,
for not only biological research, but also marine operations.                                                    REFERENCES
For example, acoustic signals from a malfunctioning system
                                                                                  [1]   B. Southall, J. Berkson, D. Bowen, R. Brake, et al., “Addressing the
moored on the bottom of Monterey Canyon were detected in                                effects of human-generated sound on marine life: an integrated research
February 2016, and this motivated deployment of an                                      plan for US federal agencies,” Interagency Task Force on
autonomous surface glider to communicate with the system                                Anthropogenic Sound and the Marine Environment of the Joint
and remotely diagnose and repair the problem. For more                                  Subcommittee on Ocean Science and Technology, Washington, DC,
                                                                                        2009.
effective biological research, real-time knowledge of variations
in vocalizations can be used to detect periods of enhanced                        [2]   D. Mennitt, K. Sherrill, and K. Fristrup K, “A geospatial model of
                                                                                        ambient sound pressure levels in the contiguous United States,” J Acoust
animal activity, which can in turn motivate complementary                               Soc Am, vol. 135, pp. 2746−2764, 2014.
research and monitoring efforts such as visual surveys and                        [3]   L. Hatch, C. Wahle, J. Gedamke, J. Harrison, B. Laws, S. Moore, J.
tagging.                                                                                Stadler, and S. Van Parijs, “Can you hear me here? Managing acoustic
                                                                                        habitat in US waters,” Endangered Species Research, vol. 30, pp. 171-
    Research results from this new source of passive acoustic                           186, 2016.
monitoring reveal great complexity within this deep-water                         [4]   NOAA, “Ocean Noise Strategy Roadmap Draft,” online:
marine soundscape. The sensitivity of passive acoustic sensing,                         http://cetsound.noaa.gov/road-map, accessed June 15, 2016.
and therefore its great utility, were emphasized by the clear                     [5]   B. Pijanowski, L. Villanueva-Rivera, S. Dumyahn, A. Farina, B. Krause,
signals of wind and rain originating from processes occurring                           B. Napoletano, S. Gage, and Nadia Pieretti, “Soundscape Ecology: The
at the ocean surface, 900 m above the hydrophone. Seasonal                              Science of Sound in the Landscape,” BioScience, vol. 61, pp. 203-216,
variation was evident in the dominant sources of biophony                               2011.
during the fall to winter transition – from blue whales to fin                    [6]   B. Mate, B. Lagerquist, and J. Calambokidis, “Movements of north
                                                                                        pacific blue whales during the feeding season off southern california and
whales – and these sources of biophony dominated mean                                   their southern fall migration,” Mar Mamm Sci, vol. 15, pp. 1246-57,
patterns in the soundscape at low frequencies. The richness of                          1999.
biophony was further represented by expert analysis of a single                   [7]   D. Rugh, K. Shelden, and A. Schulman-Janiger, “Timing of the gray
week of data, in which sound events from marine mammals                                 whale southbound migration,” J Cetacean Res Manage, vol. 3, pp. 31-
occupied 86% of the time. The recordings also reveal                                    39, 2001.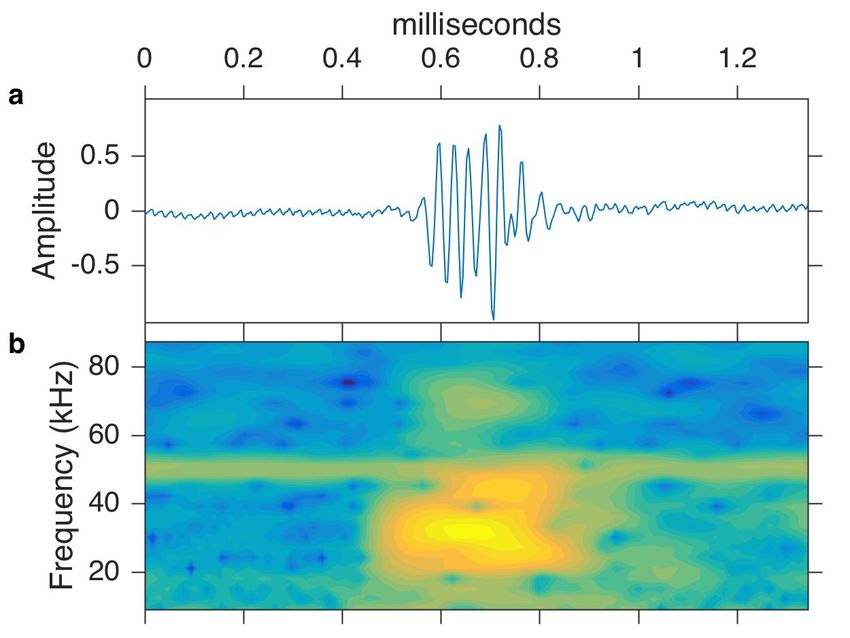
[8]    J. Calambokidis, G. Steiger, K. Rasmussen, J. Urban, K. Balcomb, P. De     [17] D. Gillespie and M. Caillat, “Statistical Classification of Odontocete
       Guevara, M. Salinas, J. Jacobsen, C. Baker, L. Herman, et al.,                  Clicks,” Canadian Acoustics, vol. 36, pp. 20-26, 2008.
       “Migratory destinations of humpback whales that feed off California,       [18] D. Gillespie, M. Caillat, J. Gordon, and P. White, “Automatic detection
       Oregon and Washington,” Mar Ecol Prog Ser, vol. 192, pp. 295-304,               and classification of odontocete whistles,” J. Acoust. Soc. Am., vol. 134,
       2000.                                                                           pp. 2427-2437, 2013.
[9]    D. Croll, B. Marinovic, S. Benson, F. Chavez, N. Black, R. Ternullo,       [19] G. Wenz, “Acoustic ambient noise in the ocean: spectra and sources,” J.
       and B. Tershy, “From wind to whales: Trophic links in a coastal                 Acoust. Soc. Am., vol. 34, pp. 1936-1956, 1962.
       upwelling system,” Mar Ecol Prog Ser, vol. 289, pp. 117-30, 2005.
                                                                                  [20] R. Urich, “Principles of Underwater Sound,” McGraw-Hill, Inc., 1983.
[10]   M. Johnson, P. Madsen, W. Zimmer, N. de Soto, and P. Tyack, “Beaked
       whales echolocate on prey,” Proc R Soc Lond , Ser B: Biol Sci, vol. 271,   [21] P. Madsen, I. Kerr, and R. Payne, “Echolocation Clicks of Two Free-
       pp. 383-386, 2004.                                                              Ranging, Oceanic Delphinids with Different Food Preferences: False
                                                                                       Killer Whales Pseudorca Crassidens and Risso’s Dolphins Grampus
[11]   S. Baumann-Pickering, M. Roch, R. Brownell, A. Simonis, M.                      Griseus,” J Exp Biol, vol. 207, pp. 1811–23, 2004.
       McDonald, A. Solsona-Berga, E. Oleson, S. Wiggins, J. Hildebrand,
                                                                                  [22] L. Kyhn, J. Tougaard, L. Thomas, L. Duve, J. Stenback, M. Amundin,
       “Spatio-temporal patterns of beaked whale echolocation signals in the
       north Pacific,” PLoS ONE, vol. 9.1, e86072, 2014.                               G. Desportes, and J. Teilmann, “From Echolocation Clicks to Animal
                                                                                       density—Acoustic Sampling of Harbor Porpoises with Static
[12]   A. Stimpert, S. DeRuiter, B. Southall, D. Moretti, E. Falcone, J.               Dataloggers,” The Journal of the Acoustical Society of America, vol.
       Goldbogen, A. Friedlaender, G. Schorr, and J. Calambokidis, “Acoustic           131, pp. 550–560, 2012
       and foraging behavior of a Baird's beaked whale, Berardius bairdii,
                                                                                  [23] H. Nuuttila, L. Thomas, J. Hiddink, R. Meier, J. Turner, J. Bennell, N.
       exposed to simulated sonar,” Nature 4 : 7031, 2014. DOI:
       10.1038/srep07031.                                                              Tregenza, and P. Evans, “Acoustic Detection Probability of Bottlenose
                                                                                       Dolphins, Tursiops Truncatus, with Static Acoustic Dataloggers in
[13]   Margolina, T., “High frequency acoustic recording package data                  Cardigan Bay, Wales,” The Journal of the Acoustical Society of
       summary report PS06, January 30, 2009 -- April 30, 2009,” Naval                 America, vol. 134, pp. 2596–2609, 2013.
       Postgraduate         School       Technical       Report,       online:
       http://hdl.handle.net/10945/718                                            [24] M. Fischer, “Observations Concerning The Recordings Made Of the
                                                                                       First Transit of Monterey Bay, California, By The Vessel CMA CGM
[14]   Condor High Throughput Computing, The University of Wisconsin,                  Benjamin       Franklin,”     online:    www.researchgate.net,       DOI:
       Madison, online: http://www.cs.wisc.edu/condor/.                                10.13140/RG.2.1.1746.5365.
[15]   D. Gillespie, D. Mellinger, J. Gordon, D. McLaren, P. Redmond, R.
       McHugh, P. Trinder, X. Deng, and A. Thode, “PAMGUARD:
       Semiautomated, open source software for real‐time acoustic detection
       and localization of cetaceans,” J. Acoust. Soc. Am., vol. 125, 2547,
       2009.
[16]   Online: www.pamguard.org
You can also read