GINGERINO Analysis of 90 days operation of the gyroscope
←
→
Page content transcription
If your browser does not render page correctly, please read the page content below
Analysis of 90 days operation of the gyroscope
                                                                              GINGERINO
                                                  J Belfi1 , N Beverini1,2 , G. Carelli1,2 , A. Di Virgilio1 , U. Giacomelli*1,2 , E. Maccioni1,2 ,
                                                                        A. Simonelli1,3 , F. Stefani1,2 , and G. Terreni1
arXiv:1804.02569v1 [physics.ins-det] 7 Apr 2018

                                                                                  1 INFN
                                                                                       Sezione di Pisa, Pisa, Italy
                                                                                     2 University
                                                                                              of Pisa, Pisa, Italy
                                                                       3 Ludwig-Maximilians-University, Munich, Germany
                                                                                 * umberto.giacomelli@pi.infn.it

                                                                                               April 10, 2018

                                                                                                   Abstract

                                                         GINGERINO is a square ring-laser prototype, which has been built to investigate the
                                                         level of noise inside the Gran Sasso underground laboratory. It is meant for fundamental
                                                         physics, but it provides suitable data for geophysics and seismology. Since May 2017 it is
                                                         continuously acquiring data. The analysis of the first 90 days shows that the duty cycle √ is
                                                         higher than 95%, and the quantum shot noise limit is of the order of 10−10 (rad/s)/ Hz.
                                                         It is located in a seismically active area, and it recorded part of the of central Italy earth-
                                                         quakes. Its high sensitivity in the frequency band of fraction of Hz makes it suitable for
                                                         seismology studies. The main purpose of the present analysis is to investigate the long
                                                         term response of the apparatus. Simple and fast routines to eliminate the disturbances
                                                         coming from the laser have been developed. The Allan deviation of the raw data reaches
                                                         10−7 after about 106 s of integration time, while the processed data shows an improve-
                                                         ment of one order of magnitude. Disturbances at the daily time scale are present in the
                                                         processed data and the expected signal induced by polar motion and solid Earth tide is
                                                         covered by those disturbances.

                                                  1     Introduction
                                                  Ring Laser Gyroscopes (RLG) [16] are, at present, the most precise sensors of absolute angu-
                                                  lar velocity for an Earth based apparatus. They are based on the Sagnac effect [12] arising
                                                  from a rigidly rotating ring laser cavity. They are essential in estimating rotation rates relative
                                                  to the local inertial frame in many contexts ranging from inertial guidance to angular metrol-
                                                  ogy, from geodesy to geophysics. The Gross Ring “G”at the Wettzell Geodetic Observatory
                                                  has obtained a resolution on the Earth rotation rate of about 15 × 10−14 rad/s with 4 hours of
                                                  integration time (3 × 10⁻⁹ in relative units) [21, 14]. Such an unprecedented sensitivity shows
                                                  that this class of instruments is even suitable to probe the spatio-temporal structure of the
                                                  local gravity field. Earth rotation is precisely calculated by the International Earth Rotation
                                                  Service (IERS) through Very Long Baseline Interferometers (VLBI)1 . VLBI has demonstrated
                                                      1 www.iers.org

                                                                                                       1
highly accurate and stable determinations of the universal time, in large part because its
very precise observations of quasars provide access to a nearly inertial celestial reference
frame. However, this can be obtained only in post-analysis, after a cumbersome procedure
and very heavy computation. On the contrary, RLG data are directly linked to the instan-
taneous Earth rotational motion that can be continuously monitored. A good agreement
between VLBI and G has been achieved by measuring and comparing the low frequency
annual Chandler-Wobble effect, a free oscillation of the Earth [15]. G is a single square ring
laser and cannot discriminate among tilts and rotation. An improvement in sensitivity and
a full 3-dimensional ring laser system would allow to integrate efficiently the data produced
by VLBI and also to measure the Lense-Thirring effect. GINGER (Gyroscopes IN GEneral
Relativity) will aim at measuring the gravito-magnetic (Lense-Thirring) effect of the rotating
Earth by means of an array of high sensitivity and accuracy ring lasers [20, 7]. In the weak-
field approximation of Einstein equation, the Sagnac frequency f S , seen by a RLG located
in a laboratory on the Earth surface, with co-latitude θ, and with the axis contained in the
meridian plane at an angle ψ with respect to the zenith, can be written as [7]:
GME GIE
f S = SΩ E [cos (θ + ψ) − 2 2
sin θ sin ψ + 2 3 (2 cos θ cos ψ + sin θ sin ψ)] (1)
c RE c RE
where S is the geometric scale factor for the RLG, G the Newton gravitational constant,
Ω E = 7.29 × 10⁻⁵ rad/s the Earth instantaneous angular rotation velocity, ME the Earth
mass, c is the light velocity in vacuum, R E the Earth mean radius, and IE the Earth moment
of inertia. The first term corresponds to the standard Sagnac signal. The second one, known
as geodetic or De Sitter precession, is produced by the motion of the laboratory in the curved
space-time around the Earth. The third one, known as Lense-Thirring precession (LT), is
produced by the rotating mass of the Earth and it is proportional to the Earth angular mo-
mentum [20, 5]. The last two terms are both relativistic and smaller than the classical Sagnac
effect by a factor of 10−8 ÷ 10−9 , that is of the order of magnitude of the ratio between R E
and the Schwarzschild radius of the Earth 2GME /c2 . These effects should be observed as
a difference between the rotation rate observed by the array of RLGs in the rotating frame
of the laboratory, and the length of the day determined in the "fixed stars" inertial frame by
IERS. Registering a perturbation that amounts to 1 part in a billion of the Earth rotational
rate, requires an unprecedented sensitivity of the apparatus. An array of at least three ring
lasers would allow to measure the Earth angular velocity and, having at disposal the time
series of the daily estimate of Earth rotation vector from the IERS Service, it would be pos-
sible to isolate the Lense-Thirring contribution. Moreover, as it has been discussed in recent
papers [7], the environmental noises pose a severe limitation, if the apparatus is located on
the Earth surface. An underground location, far from disturbances as hydrology, temper-
ature and atmospheric pressure changes, is essential for this challenging experiment, and
LNGS (Laboratori Nazionali del GranSasso, the underground Italian national institute of
nuclear physics, INFN) offers a suitable location. LNGS underground laboratory exhibits a
very high natural thermal stability and, being deep underground, it is not affected by top soil
disturbances. In order to quantify the advantages of the underground location, a square ring
laser apparatus called GINGERINO has been installed inside LNGS [3]. This installation is
a prototype on the path to GINGER and to RLG fundamental physics apparatus, but at the
same time provides unique information for geophysics. It has been already shown that the
resolution of GINGERINO is of the order of 0.1nrad/s with an integration time of 1 second
[3]. At present for Earth based apparatus, this level of sensitivity can be obtained by optical
gyroscopes only. Compared to G, the sensitivity of GINGERINO is about a factor 50 worse,
2nevertheless the present paper shows an important achievement, since it is the first evidence
that continuous data taking with high duty cycle and high sensitivity can be obtained with
ring lasers based on hetero-lithic mechanical structure, as GINGERINO and ROMY (RO-
tational Motion seismologY)2 . It is well accepted that future effort must be focused on the
realisation of arrays of ring lasers, ROMY being the first example, and that the monolithic
structure used for G cannot be expanded to form and array. Any tiny change of the geom-
etry of the hetero-lithic ring lasers affects the response of the instrument. Typically mode
jumps between two laser modes occur producing spikes in the output. The presence of those
spikes makes the raw data unsuitable to be stored in the open access data base used in seis-
mology. The analysis procedure fixes this problem: fast and simple off-line algorithms have
been developed to remove them. In the following the apparatus of GINGERINO and the
analysis procedure will be described, moreover we will introduce a qualitative comparison
with Polar motion signal.
2 The apparatus of GINGERINO
2.1 The apparatus
GINGERINO is a 3.6 m side square ring-laser installed in the underground laboratory of
Gran Sasso near L’Aquila - Italy. It has been realised with the mechanical parts of our first
prototype G-Pisa [4], utilizing with little modifications the geosensor scheme developed by
U. Schreiber[19]. In order to align optically the ring cavity, the orientation of each mirror
can be changed using levers driven by micrometric screws. The under vacuum mirror box
contains bearings and elastic joints for the adjustment of the pitch and yaw tilts of the mirror.
We call this model hetero-lithic, to distinguish it from G which is monolithic. It is generally
accepted that future array of ring-laser should be based on hetero-lithic structures. ROMY,
the array now operative inside the seismological observatory of Bavaria is based on a hetero-
lithic model. GINGERINO is mounted on a granite slab, which is connected to the ground
by a reinforced concrete structure. The whole structure is anchored to the ground only in
the centre, and the vacuum tubes and the discharge are attached to the granite[3]. Since May
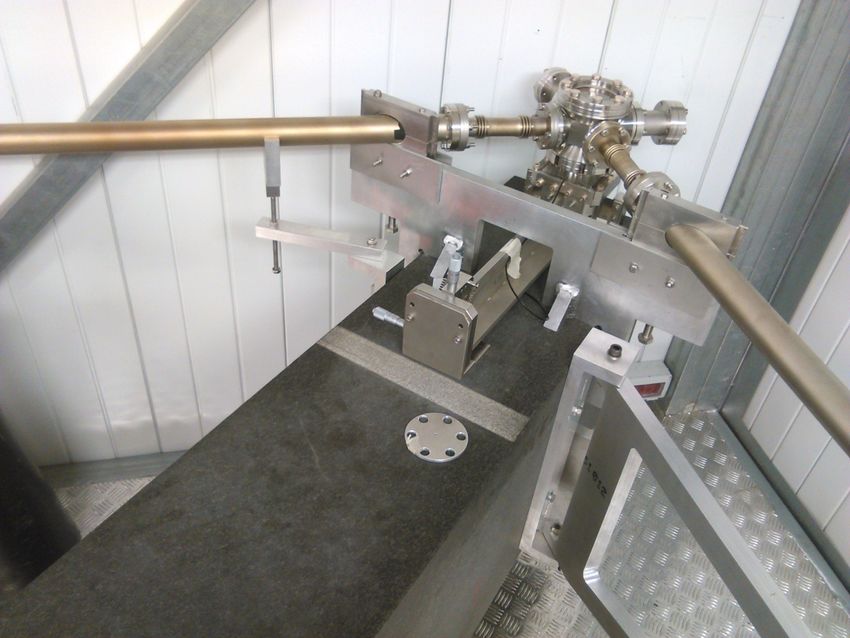
Fig. 1. Detail of one of the 4 mirror boxes, the levers to orientate the mirror, and the struc-
tures to stiffen the mechanics are visible.
2 www.romy-erc.eu
33, 2017 GINGERINO is taking data continuously. It is free running because the geometry
control has not been yet completed.
We implemented only a control to keep constant the optical power of one of the two counter
propagating laser beams by acting on the discharge current. Indeed, the laser gain must be
set close to threshold, in order to warrant single longitudinal mode operation. This control is
needed in order to avoid abrupt shut-down of the laser. Our optoelectronic system acquires
the following signals: the Sagnac interferometric signal, the intensities of the clockwise and
counter-clockwise laser beams, (Icw and Iccw ), and a Discharge plasma florescence Monitor
(DM), which is taken by a photodiode placed very close to the pyrex capillary. Monobeam
signals are narrow-band optically filtered around the 633 nm laser wavelength to cut plasma
fluorescence. These raw data are acquired and stored at 5kHz acquisition rate. Additional
high sensitivity devices are co-located: one tilt meter with 1 nrad resolution (2-K High Reso-
lution Tiltmeter HRTM, Lipmann), an high performance seismometer (Trillium 240s), a pres-
sure meter and temperature probes. The seismometer (owned by the Italian INGV, Istituto
Nazionale di Geofisica e Vulcanologia) produces data that are stored in a data base at 200 Hz,
while the other monitors (temperature, tilt and pressure) are acquired by the GINGERINO
DAQ system and stored at 1 Hz. Presently, because of a system failure, temperature data are
not available.
Seismology is a science based on the observation of ground motions. Two types of measures
are routinely implemented, translation and strain, observed by inertial seismometer and by
strain meters based on optical or mechanical principles. However a full description of the
ground movements requires also the acquisition of a third type of measurement, namely ro-
tations [1]. The need of co-located translation and rotation observables at different sites is
outlined in Ref. [11], in order to investigate the local velocity structure. Rotational signals
induced by seismic waves have a quite small amplitude. A strong seismic wave with a linear
acceleration of 1 mm/s2 produces a rotation velocity amplitude of some 10−7 rad/s, while
microseismic (around 0.1Hz) rotational background noise should be expected smaller than
10−10 rad/s [9]. Then, rotational seismology requires high sensitivity sensors. Large frame
ring laser gyroscopes demonstrated a unrivalled sensitivity level. Impressive data were col-
lected on the ring laser G located at the Geodetic Observatory in Wettzell - Germany. Already
in 2003 was reported a fully consistent observation of the rotation around a vertical axis and
of the the linear translational motion recorded in by co-located seismometers [6]. The sensi-
tivity of G in the 0.01 − 0.5 Hz region was pushed later at the level lower than 10−11 rad/s,
allowing a clear observation of the secondary microseismic peak [9]. Other less sophisticated
laser gyroscopes proved to be capable to produce relevant information for seismology. As an
example, our first prototype G-Pisa, which was located at the VIRGO3 gravitational antenna
site, was able in 2011 to record with good resolution the rotational signal around a horizontal
axis induced by the Mw = 9.0, March 2011, Japan Earthquake [2].
GINGERINO constitutes an important step for rotational seismology. Its location, under
more than 1km of rock at the LNGS site, isolates effectively the apparatus from the anthropic
and meteorologic noise and guarantees a high level of environmental stability. Also the level
of microseismic noise, as detected by the co-located linear seismometers, is significantly low.
During its acquisition time, started in Summer 2016, a lot of seismic events has been ob-
served. In particular GINGERINO acquired in almost near field the Central Italy seismic
sequence, whose epicentres were in a radius of less than 100 km [18], demonstrating that it
is possible to identify the seismic waves back-azimuth (bottom of Fig. 2). In the occurrence
3 https://www.ego-gw.it
4of the Mexico MW 8.1 Earthquake the data allowed the demonstration of the G1,G2,G3,G4
onsets of the surface Love waves [17]. Fig. 2 (top) we show the seismic event of July 17,
Kamchatka.
#10!8
1
+z [rad=s]
0
-1
0 1000 2000 3000 4000 5000 6000 7000 8000
#10!6 Time [s]
2
+z [rad=s]
0
-2
0 10 20 30 40 50 60 70
Time [s]
Fig. 2. Typical signal from far away strong Earthquake, the tele-seismic event on July 18
2017, around 00 : 00 (UTC), Kamchatka, Russia, M 7.6 (TOP) and a typical signal of regional
Earthquake, on October 16 2016 09:32:35 (UTC), Rieti, Italy Mw 4.0 (BOTTOM)
2.2 Data acquisition
The offline analysis is composed of 2 steps. In the first one we evaluate from the raw data
the instantaneous Sagnac frequency f S , and all the parameters of the laser kinematics. The
instantaneous Sagnac frequency f S is reconstructed using the Hilbert transform, decimated
and stored at 10Hz. This data set is useful to evidence any fast dynamics related to seis-
mic regional event. In the meantime the raw data are bandpass filtered around the nominal
Sagnac frequency of 280.4 Hz with 2 Hz bandwidth, subdued to the Hilbert transform and
finally stored at 1 Hz. This data set is useful for the analysis of very low frequency features (
as solid Earth tides, and polar motion,).
The backscattering (BS) is the optical coupling of the CW with the CCW laser beam because
of light scattering on the surface of each mirror. Its temporal fluctuations produces a sig-
nificative low frequency noise on the Sagnac frequency that we can estimate by analysing
the mono beams signals. Indeed, Icw and Iccw , contains at the Sagnac frequency information
related to the interference with the light backscattered on the mirrors. Applying the Hilbert
transform to this data, we can find the phase (φcw and φccw ) and the amplitude (Acw and
Accw ) Thus, one estimation of the backscattering term is given by [10]:
Acw Accw
BS = × cos(φcw − φccw ) (2)
Icw Iccw
5As for the Sagnac frequency f S , the quantities BS, and DM are decimated and stored at 1 and
− ISmin
10 Hz. Further, a very convenient parameter is the fringe contrast FC defined as ISmaxISmax ,
where IS is the instantaneous intensity of the Sagnac signal. FC is evaluated from the 5kHz
sampled Sagnac signal and stored with the other parameters.
The second step can imply different procedures finalised to specific targets. For instance, in
the seismological application, the analysis goes further by implementing a fast procedure to
eliminate the data features due to laser dynamics that can cause unwanted triggers for the
seismology analysis. From another side, the low frequency part of the signal can be analysed
to investigate the causes of instrumental instability. This could suggest how to improve the
low frequency response of the apparatus to investigate the presence of global signals such as
Polar motion and solid Earth tides.
2.3 The main characteristics of the ring-laser signal
GINGERINO is a single axis ring laser gyroscope. This means that it is sensitive only to one
component of the angular rotation vector. Its output is the Sagnac frequency f S , which is con-
nected to instantaneous rotation rate around the ring axis Ω = Ω E cos(θ + δθ ) + δω, where
Ω E is the instantaneous Earth rotation rate, θ is the local colatitude, δθ is the inclination angle
in the meridian plane of the ring axis with respect to the zenith and δω indicates the local
rotation effects, including those coming from the apparatus itself. Moreover, the Sagnac fre-
quency is also affected by the laser dynamics. This effect can be phenomenologically corre-
lated to the value of backscattering, the intensities difference of the two counter propagating
beams and to the plasma fluorescence intensity, estimated by the Discharge Monitor DM.
Assuming that those terms are small it is possible to expand in series the response of the
ring-laser in function of the BS, ∆I = Ic − Icc and DM [10]
f S = 4(S + δS)(Ω E + δω ) cos (θ + δθ ) + a1 × BS + a2 × ∆I + a3 × DM (3)
where S an δS are the geometrical scale factor and its variation, θ is the local colatitude
(47.55o for LNGS) and δθ is its variation. By fitting the parameters ai we can isolate and
subtract the contributes of BS, ∆I, DM from f S in Eq. 3. From now on what it remains will
be called "residuals". At this point, it is evident that it is not possible to discriminate among
the effect of δS, δω and δθ using a single gyroscope. So any variation of f S can be induced
by a change of scale factor (δS), angular velocity (δω) or inclination angle to the north (δθ).
These residuals from Eq. 3, expressed as variations of the Sagnac frequency δ f S , contain the
relevant informations. It is useful to define the following quantities: k S , k ω and k θ , with value
for GINGERINO:
1
δS = k S δ f S , kS = , k S = 1.98 × 10⁴ s (4)
Ω E cos θ
1
δω = k ω δ f S , kω = , k ω = 1.76 × 10⁻⁷ rad/s/Hz (5)
S cos θ
1
δθ = k θ δ f S , kθ = , k θ = 1/306 rad/Hz (6)
SΩ E sin θ
These expressions relate a Sagnac frequency change to δS, δω and δθ. In general the vari-
ations δS can be reduced controlling the geometry of the square cavity. At present GIN-
GERINO is free running, and the variations of S must be taken into account in the data
analysis.
62.4 Main characteristics of the data set
The whole set of data are shown in Fig. 3. Well visible are the 10 portions of data with
GINGERINO in split-mode, i.e. the two counter-propagating laser beams are oscillating on
different longitudinal modes, with a frequency difference equal to the free spectral range of
the cavity (around 21 MHz). GINGERINO operated in split mode for about 1.5% of the time,
the longest split mode was ∼ 13 hours, and the average about 4 hours. Looking deeper it
is possible to see also the mode jumps (points where the two counter-propagating beams
change mode almost at the same time). In Fig. 4 mode jumps are well visible in the Sagnac
signal and in the plasma monitor. In the 90 days of records we observe more than 1000 mode
288
286
Sagnac Frequency [Hz]
284
282
280
278
276
274
0 10 20 30 40 50 60 70 80 90 100
Days since 04-May-2017 00:00 UTC
Fig. 3. 97 days of data, raw data.
jumps, and it is straightforward to see that they happen very rapidly, affecting only a few
seconds. We have built a software routine which automatically identifies mode jumps and
split mode. It utilizes the Fringe Contrast (FC) and two kind of threshold levels: the lower
one to recognize the split mode periods and the higher one to recognize the mode jumps.
In this way, the bad portions of the data, are identified and then eliminated and replaced
by linear interpolation. It is in principle possible to replace the data eliminated with smarter
procedure, in order not to miss information but we have chosen the linear interpolation since
is the simplest one. In Fig. 5 we show the Sagnac frequency cleaned through these procedure.
As previously said, the laser dynamics is affected by backscattering, by the difference of
the two modes intensities and by the the plasma processes estimated through the discharge
monitor DM. In Fig. 6 we show the coherence of the Sagnac frequency f S with respectively
BS, ∆I and DM. The working point of laser is set close to the threshold, in order to avoid
multimode operation. The output power of one of the two counter propagating beams is
opto-electronically controlled by regulating the voltage of the electronic discharge. Since the
gain curve of the gas is not flat and GINGERINO is free running, when the perimeter of the
cavity and the wavelength change, the control modifies the voltage in order to keep constant
the output power. In short, DM gives information of the long period perimeter modifications
7280.5
Discharge Monitor [V] Sagnac Frequency [Hz]
280.4
280.3
280.2
3.298
3.296
3.294
3.292
3.29
3.288
20.68 20.7 20.72 20.74 20.76 20.78 20.8
Days since 04-May-2017 00:00 UTC
Fig. 4. Mode jumps observed in the Sagnac frequency and the discharge monitor.
280.5
280.45
Sagnac Frequency [Hz]
280.4
280.35
280.3
0 10 20 30 40 50 60 70 80 90 100
Days since 04-May-2017 00:00 UTC
Fig. 5. Sagnac frequency without split mode and mode jumps. Two Earthquakes are well
visible: the M6.4 of June 12 (Greece) and the M6.7 of July 21 (Turkey).
8Frequency [Hz]
10!4 10!3 10!2 10!1 100
1
Sagnac frequency and BackScattering
Sagnac frequency and DischargeMonitor
0.8 Sagnac frequency and Intensity Di,erence
Coherence Value
0.6
0.4
0.2
101 102 103 104
Frequency [cycle/day]
Fig. 6. Square root of the magnitude-squared coherence of the Sagnac frequency f S with
the backscatter BS, difference of intensities ∆I and discharge monitor DM. The calculated
coherences have been filtered and decimated by a factor of 100
Fig. 7. All the three probes (BS, ∆I and DM) are used during the analysis process in order
to clean up the output signal and to study the low frequency behaviour of the gyroscope
with the residuals δ f S . The first step is to remove the very low frequency trend using DM.
This is done by subtracting the linear contribution by using a least square method. In the
second step, each portion of data between two split modes are analysed separately and the
contributions from backscattering and intensity difference are subtracted by using a linear
regression. The analysis is focused on the long time behaviour, with particular attention to
the response at frequency around 1 cycle/day, to see whether the signal induced by polar
motion and solid Earth tide are visible. We have investigated several procedure, and it has
been immediately evident that the subtraction was more effective decimating the data. The
effectiveness of this procedure is evident comparing the raw data with the residuals (Fig. 8).
Fig. 9 shows the residuals expressed as angular rotation on the left and change of the relative
angle on the right one.
2.5 Comparison with expected Polar Motion and solid Earth tide signals
A horizontal gyroscope as GINGERINO is affected by the relative motion of the moon and
the sun. Among all possible effects, the dominating ones are the polar motion and the north-
south tilt caused by the solid Earth tide. The polar motion is basically a signal around 1
cycle/day, while the Earth tide has several components. The used model is based on the
simulation developed for G Wettzell by Andre’ Gebauer [8] (Fig. 10). To have an idea of
the performances of our gyroscopes we compare in Fig. 11 the power spectral density of the
RAW data, residuals one and the quantum shot noise of our instrument. Another important
way to show the performances of our instrument is the comparison between the overlapping
Allan deviation of the Sagnac raw data and the residuals one, the overlapping Allan devia-
tion of the polar motion and solid Earth tide and the quantum shot noise of our instrument
93.65
3.6
3.55
Discharge Monitor [V]
3.5
3.45
3.4
3.35
3.3
3.25
3.2
0 10 20 30 40 50 60 70 80 90 100
Days since 04-May-2017 00:00 UTC
Fig. 7. Discharge Monitor during the whole period.
0.5
0.4
0.3
Frequency [Hz]
0.2
0.1
0
-0.1 Sagnac RAW
Backscattering subtracted
-0.2
0 5 10 15 20 25 30 35
Hours since 04-Jun-2017 16:00 UTC
Fig. 8. The residual after backscattering subtraction is compared with the raw data, in both
curves the average is subtracted and the raw data are shifted up by 0.1Hz.
101
$
Variation of Angular Velocity nrad " s!1
0.8 15
0.6
10
#
0.4
North Tilt [nrad]
5
0.2
0 0
-0.2
-5
-0.4
-10
-0.6
-0.8 -15
0 10 20 30 40 50 60 70 80 90 100
Days since 04-May-2017 00:00 UTC
Fig. 9. Residuals expressed as angular velocity (left) or as tilt angle with respect to the
north south direction (right). GINGERINO is a single axis gyroscope and the residuals can
be interpreted as angular velocity or change in the relative angle with the rotation axis.
40
Sum [7Hz]
20
0
Polar motion [7Hz]
20
0
-20
Solid earth tide [7Hz]
20
10
0
0 10 20 30 40 50 60 70 80 90 100
Days since 04-May-2017 00:00 UTC
Fig. 10. Synthetic effect on GINGERINO. TOP: summed polar motion and Earth tide, MID-
DLE polar motion only, BOTTOM solid Earth tide.
11Fig. 12. This value is estimated by [13]:
Frequency [Hz]
10!6 10!5 10!4 10!3
10!7
10!8
p i
PSD (rad=s)= Hz
10!9
h
10!10
RAW data
Residuals data
Quantum noise limit
10!11
10!1 100 101
Frequency [cycle/day]
Fig. 11. Comparison of the power spectral density of the residuals, the RAW data set and
the quantum noise limit.
s
cP hν
ΩN = (7)
4QA P0 t
where c is the speed of light, P and A are the ring perimeter and its area, Q the cavity qual-
ity factor, h the Plank constant, ν the laser frequency, √
P0 the cavity power losses
√ and t the
integration time. For GINGERINO Ω N ' 8.43 × 10⁻¹¹ t [rad/s] (1.16 × 10⁻⁶ t in relative
units)4
3 Discussion and Conclusions
GINGERINO is the first high sensitivity ring laser based on hetero-lithic structure, which
operated unattended for several months with a duty cycle higher than 95% and a sensitivity
around 0.1 nrad/s for 1 second integration time. We analysed the first 96 days of continuous
data throw suitable software routines in order to make them available to a broader commu-
nity. A large number of disturbances caused by mode jumps are present in the data. It is
necessary to eliminate these noise sources to avoid fake triggers. A fast procedure, suitable
to be implemented on-line, has been developed at this purpose.
The low frequency part of the spectrum is of primary interest, but below 1 mHz the sys-
tematics of the laser, as backscatter noise, dominates. Using the procedure described in this
paper the gyroscope Allan variance has been improved of about one order of magnitude,
reducing the noise coming from backscattering and other systematics of the laser.
4 these values are evaluated considering seconds as units for t
12Fig. 12. Overlapping Allan deviation of raw data (red curve) and the residuals (blue curve)
compared with the quantum noise limit (dashed line) and the Polar motion (magenta
curve) and Solid Earth Tide (green curve) of GINGERINO site. Due to computational needs
the residuals overlapping Allan deviation has been calculated using data sampled at 180s
The data exhibits a large number of mode jumps, the developed procedure is not able to
completely remove the disturbances induced by these ones, so part of the excess noise could
be due to them. The number of mode jumps are rather high and not consistent with the typ-
ical temperature variation inside the GINGERINO site. One possible explanation is that the
laser cavity is not stable enough in size and orientation, further study is necessary to explain
the high occurrence of mode jumps, for that the probes of temperature are necessary. GIN-
GERINO mechanics is 10 years old. In the meantime, more stable mechanical solution have
been developed. ROMY, for example, has a more rigid structure. GP2, our new prototype,
which has two stages of alignment, rough and fine. In the near future we plan to fix the DAQ
problems and the temperature probes.
The mirrors losses play a crucial role in this kind of apparatus, using mirrors with lower
losses the shot noise limit improve, and the noise coming from the backscattering, which is
the dominant noise source, decreases. At present the losses of the installed mirrors are more
than a factor 10 higher than the ones installed in G. A new set of mirrors will be installed in
GINGERINO before summer 2018, tests are in progress in order to test the quality of these
new mirrors. Nowadays the system is still running and the analysis will continue in order
to further improve the comprehension of the very low frequency response.
13References
[1] K Aki and P G Richards. Quantitative Seismology. Geology (University Science Books).:
Seismology. University Science Books, 2002.
[2] J. Belfi, N. Beverini, F. Bosi, G. Carelli, A. Di Virgilio, E. Maccioni, A. Ortolan, and
F. Stefani. A 1.82 m 2 ring laser gyroscope for nano-rotational motion sensing. Applied
Physics B: Lasers and Optics, 106(2):271–281, 2012.
[3] Jacopo Belfi, Nicolò Beverini, Filippo Bosi, Giorgio Carelli, Davide Cuccato, Gaetano De
Luca, Angela Di Virgilio, André Gebauer, Enrico Maccioni, Antonello Ortolan, Alberto
Porzio, Gilberto Saccorotti, Andreino Simonelli, and Giuseppe Terreni. Deep under-
ground rotation measurements: GINGERino ring laser gyroscope in Gran Sasso. Review
of Scientific Instruments, 88(3):034502, mar 2017.
[4] Jacopo Belfi, Nicolò Beverini, Giorgio Carelli, Angela Di Virgilio, Enrico Maccioni,
Gilberto Saccorotti, Fabio Stefani, and Alexander Velikoseltsev. Horizontal rotation sig-
nals detected by “G-Pisa” ring laser for the M w = 9.0, March 2011, Japan earthquake.
Journal of Seismology, 16(4):767–776, oct 2012.
[5] F. Bosi, G. Cella, A. Di Virgilio, A. Ortolan, A. Porzio, S. Solimeno, M. Cerdonio, J. P.
Zendri, M. Allegrini, J. Belfi, N. Beverini, B. Bouhadef, G. Carelli, I. Ferrante, E. Mac-
cioni, R. Passaquieti, F. Stefani, M. L. Ruggiero, A. Tartaglia, K. U. Schreiber, A. Gebauer,
and J-P. R. Wells. Measuring gravitomagnetic effects by a multi-ring-laser gyroscope.
Physical Review D, 84(12):122002, dec 2011.
[6] Alain Cochard, H. Igel, B. Schuberth, W. Suryanto, A. Velikoseltsev, U. Schreiber,
J. Wassermann, F. Scherbaum, and D. Vollmer. Rotational Motions in Seismology: The-
ory, Observation, Simulation. In Earthquake Source Asymmetry, Structural Media and Ro-
tation Effects, pages 391–411. Springer-Verlag, Berlin/Heidelberg, 2005.
[7] Angela D. V. Di Virgilio, Jacopo Belfi, Wei-Tou Ni, Nicolo Beverini, Giorgio Carelli, En-
rico Maccioni, and Alberto Porzio. GINGER: A feasibility study. The European Physical
Journal Plus, 132(4):157, apr 2017.
[8] André Gebauer. Private Communication.
[9] Celine Hadziioannou, Peter Gaebler, Karl Ulrich Schreiber, Joachim Wassermann, and
Heiner Igel. Examining ambient noise using colocated measurements of rotational and
translational motion. Journal of Seismology, 16(4):787–796, oct 2012.
[10] R.B. Hurst, N. Rabeendran, K.U. Schreiber, and J.-P.R. Wells. Correction of backscatter-
induced systematic errors in ring laser gyroscopes. Applied Optics, 53(31), 2014.
[11] Heiner Igel, Alain Cochard, Joachim Wassermann, Asher Flaws, Ulrich Schreiber,
Alex Velikoseltsev, and Nguyen Pham Dinh. Broad-band observations of earthquake-
induced rotational ground motions. Geophysical Journal International, 168(1):182–196, jan
2007.
[12] G. Sagnac. Effet tourbillonnaire optique. La circulation de l’éther lumineux dans un
interférographe tournant. Journal de Physique Théorique et Appliquée, 4(1):177–195, 1914.
14[13] K. U. Schreiber, J. P R Wells, and G. E. Stedman. Noise processes in large ring lasers.
General Relativity and Gravitation, 40(5):935–943, 2008.
[14] Karl Ulrich Schreiber. Private Communication.
[15] Karl Ulrich Schreiber, T. Klügel, J.-P. R. Wells, R. B. Hurst, and A. Gebauer. How to
detect the chandler and the annual wobble of the earth with a large ring laser gyroscope.
Physical Review Letters, 107(17):173904, oct 2011.
[16] Karl Ulrich Schreiber and Jon-Paul. Wells. Invited Review Article: Large ring lasers for
rotation sensing. Review of Scientific Instruments, 84(4):041101, apr 2013.
[17] Andreino Simonelli, Jacopo Belfi, Nicolò Beverini, Angela D. V. Di Virgilio, Umberto
Giacomelli, Gaetano De Luca, and Heiner Igel. Love waves trains observed after the
MW 8.1 Tehuantepec earthquake by an underground ring laser gyroscope. In AGU Fall
Meeting 2017, S33G-2954, New Orleans, 2017.
[18] Andreino Simonelli, Heiner Igel, Joachim Wassermann, Jacopo Belfi, Enrico Maccioni,
Angela D. V. Di Virgilio, Nicolò Beverini, Gaetano De Luca, and Gilberto Saccorotti.
Rotational motions from the 2016, Central Italy seismic sequence, as observed by an
underground ring laser gyroscope. Submitted at Geophysical Journal International.
[19] G E Stedman. Ring-laser tests of fundamental physics and geophysics. Reports on
Progress in Physics, 60(6):615–688, jun 1997.
[20] Angelo Tartaglia, Angela Di Virgilio, Jacopo Belfi, Nicolò Beverini, and Matteo Luca
Ruggiero. Testing general relativity by means of ring lasers. The European Physical Jour-
nal Plus, 132(2):73, feb 2017.
[21] Monika Tercjak and Aleksander Brzeziński. On the Influence of Known Diurnal and
Subdiurnal Signals in Polar Motion and UT1 on Ring Laser Gyroscope Observations.
Pure and Applied Geophysics, 174(7):2719–2731, 2017.
15You can also read