Mixture of orthogonal sequences made from extended time-stretched pulses enables measurement of involuntary voice fundamental frequency response ...
←
→
Page content transcription
If your browser does not render page correctly, please read the page content below
Mixture of orthogonal sequences made from extended time-stretched pulses
                                         enables measurement of involuntary voice fundamental frequency response to
                                                                     pitch perturbation
                                              Hideki Kawahara1 , Toshie Matsui2, Kohei Yatabe3 , Ken-Ichi Sakakibara6, Minoru Tsuzaki4,
                                                                        Masanori Morise5 , and Toshio Irino1
                                                                         1
                                                                        Wakayama University, Wakayama, 640-8510 Japan
                                                                   2
                                                                   Toyohashi University of Technology, Aichi, 441-8580 Japan
                                                                           3
                                                                             Waseda University, Tokyo, 169-8555 Japan
                                                              6
                                                                Health Science University of Hokkaido, Hokkaido, 061-0293 Japan
                                                                     4
                                                                       Kyoto City University of Arts, Kyoto 610-1197 Japan
                                                                             5
                                                                               Meiji University, Tokyo, 164-8525 Japan
arXiv:2104.01444v1 [cs.SD] 3 Apr 2021

                                                    kawahara@wakayama-u.ac.jp, tmatsui@cs.tut.ac.jp, k.yatabe@asagi.waseda.jp,
                                                      kis@hoku-iryo-u.ac.jp,minoru.tsuzaki@kcua.ac.jp, mmorise@meiji.ac.jp,
                                                                              irino@wakayama-u.ac.jp

                                                                  Abstract                                   1.1. Background and related work
                                                                                                             Without proper regulation, we are not able to keep the funda-
                                        Auditory feedback plays an essential role in the regulation of       mental frequency of the voice (for example, sustained vowels)
                                        the fundamental frequency of voiced sounds. The fundamental          constant [7]. Auditory feedback plays an essential role in this
                                        frequency also responds to auditory stimulation other than the       regulation [8–10]. Vibrato, which makes singing voice attrac-
                                        speaker’s voice. We propose to use this response of the funda-       tive, also involves auditory feedback in production [11,12]. De-
                                        mental frequency of sustained vowels to frequency-modulated          spite decades of research on voice fundamental frequency con-
                                        test signals for investigating involuntary control of voice pitch.   trol mechanisms, it still is a hot topic [13–16]. Note that the
                                        This involuntary response is difficult to identify and isolate by    target of the regulation is not the fo value. The target is the
                                        the conventional paradigm, which uses step-shaped pitch pertur-      perceived pitch and is a psychological attribute, [17]. For pe-
                                        bation. We recently developed a versatile measurement method         riodic signals, fo value is the perceived pitch’s physical corre-
                                        using a mixture of orthogonal sequences made from a set of ex-       late. In other words, we can observe the perceptual attribute,
                                        tended time-stretched pulses (TSP). In this article, we extended     pitch, directly using the fo value of the produced voice. The
                                        our approach and designed a set of test signals using the mix-       regulation of voice pitch consists of voluntary and involuntary
                                        ture to modulate the fundamental frequency of artificial signals.    control [18, 19]. The shifted pitch paradigm [20] used in these
                                        For testing the response, the experimenter presents the modu-        studies has difficulty investigating this involuntary response.
                                        lated signal aurally while the subject is voicing sustained vow-
                                        els. We developed a tool for conducting this test quickly and             The first author proposed to use a pseudo-random signal
                                        interactively. We make the tool available as an open-source and      [21] to perturb the fo of the fed-back voice. It enabled to make
                                        also provide executable GUI-based applications. Preliminary          the test signal unpredictable and to derive the impulse response
                                        tests revealed that the proposed method consistently provides        of the auditory-to-voice fo chain [22, 23]. This unpredictabil-
                                        compensatory responses with about 100 ms latency, represent-         ity enabled measurement of involuntary response to pitch per-
                                        ing involuntary control. Finally, we discuss future applications     turbation. However, it was difficult for others to replicate the
                                        of the proposed method for objective and non-invasive auditory       test because it required a complex combination of hardware and
                                        response measurements.                                               software tools. The procedure also consisted of several draw-
                                        Index Terms: pitch perception, fundamental frequency, time-          backs due to available technology in the 1990s. For example,
                                        stretched-pulse, auditory feedback, frequency modulation             we measured the response to pitch perturbation using the max-
                                                                                                             imum length sequence (MLS) [21]. Selection of MLS among
                                                                                                             other TSP signals [24–28] was inevitable to make the test sig-
                                                             1. Introduction                                 nal unpredictable. However, MLS has difficulty in measuring
                                                                                                             systems with non-linearity [26, 27]. Conventional pitch extrac-
                                        The fundamental frequency (fo )1 of sustained vowels respond         tors are the other source of problem. They introduced non-linear
                                        to frequency modulation of aurally presented sounds [2–4].           and unpredictable distortions in the extracted fo trajectories.
                                        This response, combined with our recently developed system
                                        analysis method [5, 6] provides a versatile new tool for inves-
                                        tigating the auditory-to-speech chain. Preliminary tests illus-      1.2. Contribution of the current work
                                        trated that the proposed method provides accurate measurement        We succeeded in making test signals which are unpredictable
                                        of the involuntary response to fo perturbation of the aurally pre-   and do not have MLS’s difficulty. Our new system analysis
                                        sented test signals. The measured latency of the response was        method uses a new extended TSP called CAPRICEP (Cascaded
                                        around 100 ms and compensatory to the perturbation. The goal         All-Pass filters with RandomIzed CEnter frequencies and Phase
                                        of this article is to introduce our method and to demonstrate the    Polarities) [6]. We used CAPRICEP and developed an auditory-
                                        feasibility of the proposed method. We developed an easy-to-         to-speech chain analysis system by adopting the simultane-
                                        use tool and made it available as an open-source for readers to      ous measurement method of linear, non-linear, and random re-
                                        be able to replicate and verify our results.                         sponses [5]. We developed an instantaneous frequency-based fo
                                                                                                             analysis method instead of using conventional pitch extractors
                                           1 We use the symbol f to represent the fundamental frequency
                                                                    o                                        and removed the above-mentioned distortions. The combina-
                                        adopting the discussion in the forum article [1].                    tion of these analysis methods and substantially advanced com-
Modulation signal        Test signal
         generator             generator        Headphone

      Orthogonal sequence
           generator

     CAPRICEP
     generator
                                   Microphone
       System        Fundamental
      response        frequency
       analysis        analyzer                              Natural
                                                            sidetone

      Analyzed
      response

Figure 1: Schematic diagram of the involuntary response mea-
surement to pitch perturbation using the proposed method.

putational power removed all the difficulties in measuring the
auditory-to-speech chain response and resulted in an easy-to-          Figure 2: Periodic allocation of extended unit-TSPs and making
use tool for conducting experiments. The tool is open-sourced          of the mixed signal. Elements are overlap and added.
and available from the first author’s GitHub repository [29].
     The following section introduced the proposed method with
illustrative plots of component procedures. Then, we introduce
a GUI-based application for conducting experiments based on
the proposed method quickly and interactively. The section
shows preliminary test examples to illustrate how to use the tool
and how to analyze the results. Finally, we discuss the further
application of this method for objective and non-invasive audi-
tory response measurements.                                            Figure 3: Smoothed modulation signal prepared for frequency
     The associated media provides a movie showing how an              modulation.
interactive test tool for conducting the proposed method works
to readers. The media also consists of an example recording of a
test session and link to the tool for readers to investigate details   varying fundamental frequency. We used a six-term cosine se-
and to verify our results.                                             ries for the envelope of the analytic signals [30] for calculating
                                                                       clean instantaneous frequency. The “Fundamental frequency
                                                                       analyzer” in Fig. 1 does this process.
                            2. Method                                       This process applies the pulse recovery and correlation-
Figure 1 shows a schematic diagram of the experimental setting         cancellation procedures described in the previous section. It
of the proposed method. The task of the subject is to keep voic-       yields the perturbation pulse shape from the electrically fed-
ing a sustained vowel at a constant pitch while exposed to the         back signal. It also yields the response to the perturbation from
test sound using a headphone. The analysis of the response to          the recorded sound. The “System response analysis” in Fig. 1
pitch perturbation uses fo values of both the test and the voiced      does this process.
sounds. A special design enabled analysis of the involuntary
response to pitch perturbation.                                        2.3. Design and analysis parameters

2.1. Test signal design                                                We designed the temporal distribution of the power of unit-TSP
                                                                       to have the raised cosine shape [6]. The nominal duration of
Test signal design consists of the following four steps. The first     the unit-TSP was 400 ms. We set the allocation interval of unit-
step generates extended TSP signals (unit-TSPs) based CAPRI-           TSPs as 16384 samples (371.5 ms for 44100Hz sampling). We
CEP [6]. The “CAPRICEP generator” in Fig. 1 does this pro-             selected three items from the unit-TSP pool to generate one set
cess. The second step periodically (tr represents the period)          of orthogonal sequences. Note that the mixtures of three se-
allocates unit-TSPs using a set of orthogonal series to yield a        quences made from the different sets of unit-TSPs are indepen-
set of (after post-processing) orthogonal sequences [5]. The           dent. We set the total duration of the test signal 20 s. This
“Orthogonal sequence generator” in Fig. 1 does this process.           setting provides about 60 repetitions of measurement for calcu-
The third step mixes and smooths the orthogonal sequences              lating one impulse response. This repetition reduces the obser-
to make a modulation signal for frequency modulation. The              vation error by about 1/8 in terms of standard deviation.
“Modulation signal generator” in Fig. 1 does this process.
The fourth step frequency modulates the carrier signals such           2.4. Generated signals and analyzed signals
as a single sine wave and signals consisting of harmonically
related multiple sine waves. The “Test signal generator” in            This section uses the generated signals in each procedure shown
Fig. 1 does this process.                                              in Fig. 1 to illustrate its function. Figure 2 illustrates the func-
     The third step generates a modulation signal having the fun-      tion of “Orthogonal sequence generator.” The labels “Seq.1,”
damental period 4×tr with and without smoothing. Filtering us-         “Seq.2,” and “Seq.3” are orthogonal sequences made from three
ing time-reversed unit-TSPs followed by post-processing using          different unit-TSPs. For “Seq.1,” we allocated the first unit-
the set of orthogonal series recovers periodic pulse sequences         TSP periodically with the same polarity. For “Seq.2,” we al-
with the period tr and a pulse sequence with the period 4×tr .         located the second unit-TSP periodically inverting the polarity
                                                                       each time. For “Seq.3,” we allocated the third unit-TSP period-
                                                                       ically inverting the polarity every other time. We overlap and
2.2. Analysis of response
                                                                       added each allocation to yield the sequence. We mixed all se-
The fundamental frequency analyzer uses analytic signals               quences to make the signal “MIX” for the following process.
which are tuned to the target fundamental frequency. The in-                Figure 3 shows an example of the generated signal by
stantaneous frequency of the filtered signal is the temporally         “Modulation signal generator.” We smoothed the mixed sig-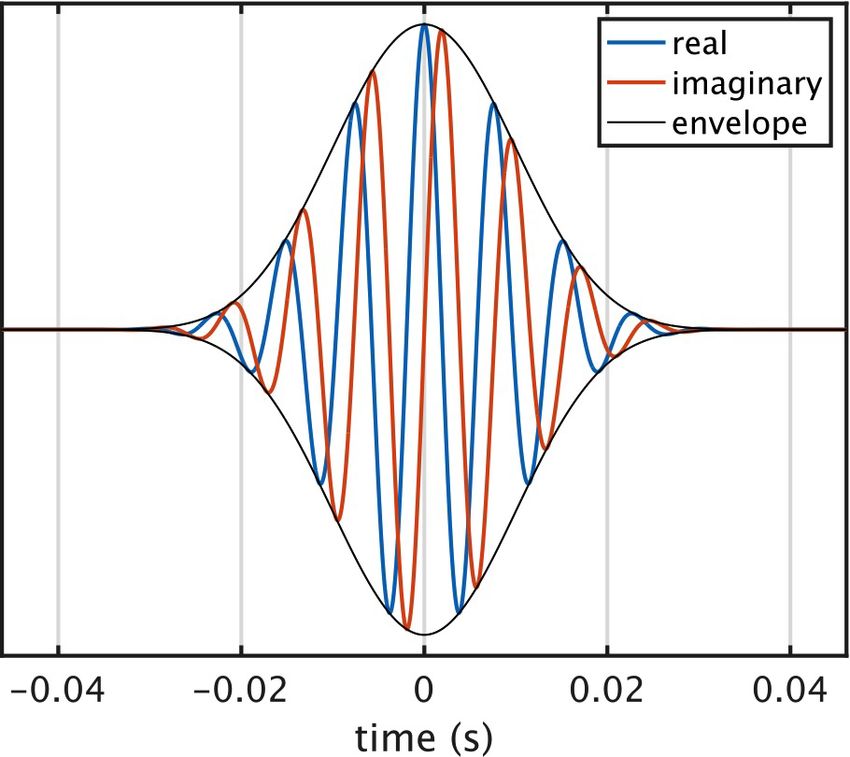
Figure 4: Frequency modulated test signal with multiple har-
monic components. (Sine phase) Figure 6: Recovered modulation and observed pulses processed
from the electrically looped back signal and the acoustic signal
through a headphone and a microphone.
Figure 5: Impulse response (left) and gain (right) of the analytic
signal filter for analyzing 130 Hz sinusoidal component.
nal (“MIX” in Fig. 2) generated by the preceding procedure
using the six-term cosine series [30]. This smoother provides
more than 114 dB suppression of interfering signals outside
of the main lobe of the frequency response. The plot shows
a portion of the signal with the length of eight allocation pe-
riods. We set the standard deviation of the modulation signal
to 25 Cent. This setting is to design the speed of fo transition
of this modulation signal not to exceed that observed in natu-
ral speech sounds [31]. Note that this smoothed signal modu-
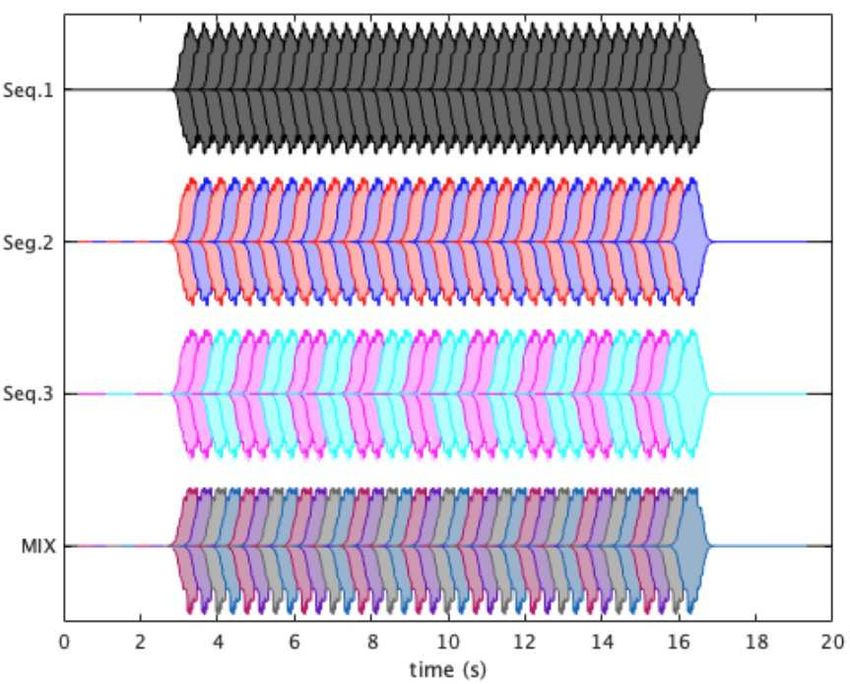
lates the fo represented in log-frequency because a set of linear Figure 7: A snapshot of the GUI of the interactive test tool for
differential equations approximate the fo dynamics well when measuring fo response to the perturbation.
using the log-frequency representation [32].
Figure 4 shows an example of the test signal consisting of
twenty harmonic components generated using the “sine” phase.
This is the output of “Test signal generator” in Figure 1. The canceling headphone). Filtering using time-reversed unit-TSPs
plot shows the portion with one allocation interval’s width. Note and cross-correlation canceling procedure recovers the pertur-
that the waveform deformation caused by the frequency modu- bation pulse and responses from the extracted fo trajectories.
lation is not visible in this plot because the magnitude of the Please refer to the reference [5] for details of these recovery
modulation is less than 7% of the fundamental period. The procedures. Note that the recovered pulse shapes are effectively
headphone converts this test signal to the test sound and presents the same (the electric signal yielded 50.38 Cent and the acoustic
the sound to the subject. signal yielded 50.32 Cent at each peak.).2
Figure 5 shows the impulse response hc [n] and the fre- Figure 6 illustrates that the proposed procedure provides ac-
quency gain response of the filter for fo analysis. The proce- curate measurement of the fo response to the perturbation. It is
dure “Fundamental frequency analyzer” uses this filter. The important to note that the perturbation does not modify the sub-
following equation provides the instantaneous frequency fi [n] ject’s auditory feedback through the natural sidetone. It enables
of the filtered output y[n], where n represents the index of the us to measure the involuntary response to the fo perturbation
discrete-time signal. without disrupting the natural auditory-to-speech chain3 .
y[n + 1] fs 3. Measurement tool and examples
fi [n] = ∠ · (1)
y[n] 2π
We conducted preliminary experiments using the GUI-based
where ∠[a] represents the argument of a complex number a and test tool shown in Fig. 7. Because of the COVID-19 pandemic,
fs represents the sampling frequency of the discrete-time sig- the first author played the experimenter and the subject roles.
nal. Because the fundamental frequency of the test signal and This may introduce biases. Please use these example results
the sustained vowel are known in advance, we avoid using con- as illustration materials for proof of concept of the proposed
ventional pitch extractors. Those extractors consist of pre and method. We made the tool and some examples accessible to ev-
post-processing procedures and introduce non-linear and unpre- eryone for them to be able to replicate the tests described in this
dictable distortions. Equation 1 does not introduce such distor- article. Please refer to the associated multimedia files.
tions and yields the fo values at the audio sampling rate. The
impulse response hc [n] design is crucial for Eq. 1 to yield accu- 3.1. GUI-based test tool
rate instantaneous frequency values [33]. We used the six-term Figure 7 shows a snapshot of the GUI of the interactive test
cosine series [30] to design the envelope of hc [n]. tool for measuring fo response to the perturbation. This image
Figure 6 shows the analysis results of “System response
analysis” in Fig. 1. The same fo analysis procedure extracted 2 Figure 6 shows a slight delay in the acoustic pulse. The noise-
the fo values of the test signal (the electrically looped back sig- canceling process of the headphone introduced about a 6 ms delay.
nal) and the acquired acoustic signal (an omnidirectional con- 3 Depending on the presentation level, the test signal may induce the
denser microphone acquired the sound produced by a noise- Lombard’s effect [34].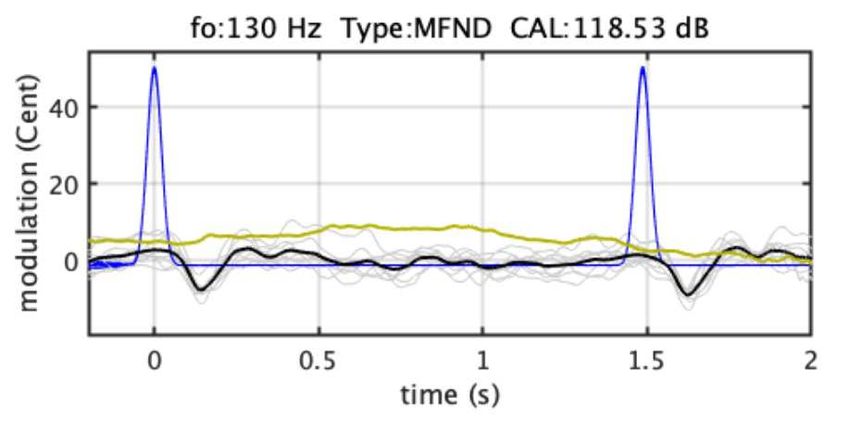
Figure 8: Response example to complex sound with 20 har-
                                                                      Figure 9: Response example to missing fundamental sound con-
monic components.
                                                                      sisting of resolved harmonics from 2nd to 20th components

shows a response to the missing fundamental (missing the first        tary response to the perturbation of this speech-to-speech chain.
harmonic component) test signal. The left part of the GUI is for      These results illustrate the feasibility of the proposed method.
operation, and the right part is for display the analysis result.
                                                                           Each session lasts about one minute. We tested under var-
The center bar graph is an input level monitor. The right three
                                                                      ious conditions using different types of test signals. The next
panels are the power level (top), recovered responses (middle),
                                                                      section discusses the future possibilities we found from those
and the final response analysis result. The title of the top panel
                                                                      test sessions.
shows the recorded file name and the test conditions. Note that
the analysis does not precede data saving. Also, a separate log-
file records all saving and analysis operations. These are the             4. Discussion and future applications
built-in mechanism to prevent misconducts of experiments.             We conducted tests using a sum of harmonic components other
                                                                      than the fundamental component. It is a missing fundamental
3.2. Test conditions                                                  signal. Figure 9 shows the summary of the results. Note that
We used a miniature omnidirectional condenser microphone              the average of the response is close to that of test signals hav-
(Shure MX153T/O-TQG), a noise-canceling circumaural head-             ing the fundamental component (Fig. 8). This suggests that we
phone (SONY MDR-1RNC), an audio interface (ROLAND Ru-                 can conduct this acoustic-to-speech chain experiment using a
bix24), and a powered loudspeaker (IK Multimedia iLoud Mi-            loudspeaker instead of using a headphone. This is very useful.
cro Monitor). The microphone and the R-channel audio inter-                We also tested using a sum of harmonic components from
face output are connected R and L channels of the inputs of the       the eighth to the twentieth. The average response to this test
audio interface. We used a notebook computer (Apple Mac-              signal shows a very small compensatory behavior. This differ-
BookPro 13 inches with 2.7GHz Intel Core i7 and 16 GB mem-            ence in response may reflect the difference in the pitch salience
ory) for running the tool. The placement of the microphone            of the test signals. We speculate that the proposed procedure
adopted the recommendation [35]. The sampling rate and the            provides direct access to our internal pitch representation. The
resolution was 44100 Hz and 24 bit. The target fo was 130 Hz,         immediate is to design test signals using several phase relations
a comfortable pitch for the subject.                                  between harmonic components, such as cosine, alternating [36],
                                                                      random, and Schroeder phase [37]. These may lead to critical
3.3. Test procedure                                                   tests for testing various pitch perception models [38]. The pro-
                                                                      posed method provides a non-invasive and quantitative assess-
Before start experiments, the experimenter calibrates the acous-      ment of auditory functions.
tic input using pink noise and the calibration panel of the GUI.
A test session starts by clicking the “START” button. In the be-                             5. Conclusions
ginning several seconds, the subject listens to the test sound to
determine the target pitch of voicing. Then, the subject starts the   We designed a set of test signals using the mixture to modu-
sustained vowel keeping the pitch constant. The test signal lasts     late the fundamental frequency of artificial signals for testing
in twenty seconds. By clicking the “SAVE” button, it saves the        the auditory-to-speech chain of pitch regulation. For testing the
test signal and the recorded voice, then response analysis starts     response, the experimenter presents the modulated signal au-
and displays the results. The attached media files consist of a       rally while the subject is voicing sustained vowels. We devel-
movie showing an example test procedure.                              oped a tool for conducting this test quickly and interactively.
                                                                      We make it available as an open-source and also provide com-
3.4. Example of analysis results                                      piled GUI-based applications executable without requiring the
                                                                      MATLAB license. Preliminary tests using the tool revealed
Figure 8 summarizes results of eight sessions using a test signal     that the proposed method consistently provides compensatory
consisting of twenty harmonic components. Each session used           responses with about 100 ms latency, representing involuntary
the test signal made from a different combination of unit-TSPs.       control. Finally, we discuss future applications of the proposed
The different combination makes the non-linear time-invariant         method for objective and non-invasive auditory response mea-
response independent each other. The thin and light-gray solid        surements.
lines show the obtained eight responses. The thick black line
shows the average response. The blue line shows the frequency
modulation pulse of the test signal. The dark yellow line shows                         6. Acknowledgments
the averaged random responses. Note that the average response         This work was supported by JSPS (Japan Society for the Pro-
is compensatory to the perturbation with a latency of around          motion of Science) Grants-in-Aid for Scientific Research Grant
100 ms. Test signal having only the fundamental component             Numbers JP18K00147, JP18K10708, and JP19K21618.
prevented the subject from monitoring the pitch of the produced
voice. This condition made the fo randomly drift away from
the target value. This behavior suggests that when using the                                  7. References
test signal with harmonic components, the subject’s auditory-          [1] I. R. Titze, R. J. Baken, K. W. Bozeman, S. Granqvist, N. Henrich,
to-speech chain of pitch regulation operates intact. Therefore it          C. T. Herbst, D. M. Howard, E. J. Hunter, D. Kaelin, R. D. Kent,
is safe to state that the averaged response represents the involun-        J. Kreiman, M. Kob, A. Löfqvist, S. McCoy, D. G. Miller, H. Noé,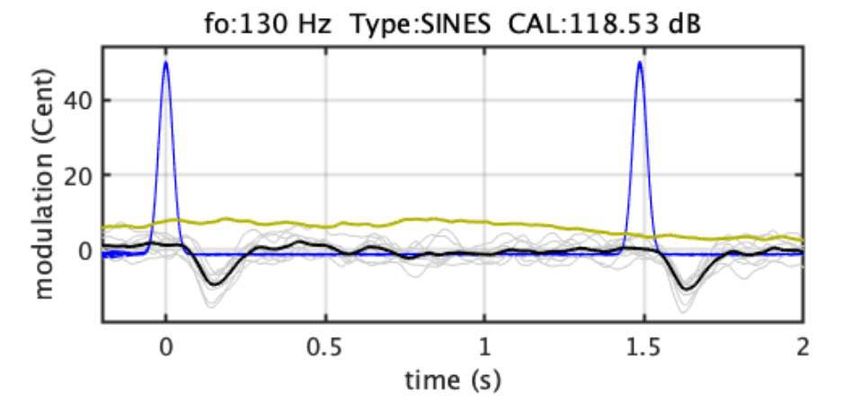
R. C. Scherer, J. R. Smith, B. H. Story, J. G. Švec, S. Ternström,    [20] T. A. Burnett, J. E. Senner, and C. R. Larson, “Voice F0 responses
     and J. Wolfe, “Toward a consensus on symbolic notation of har-               to pitch-shifted auditory feedback: a preliminary study,” J. Voice,
     monics, resonances, and formants in vocalization,” J. Acoust. Soc.           vol. 11, no. 2, pp. 202–211, 1997.
     Am., vol. 137, no. 5, pp. 3005–3007, 2015.
                                                                             [21] M. R. Schroeder, “Integrated-impulse method measuring sound
 [2] M. Sivasankar, J. J. Bauer, T. Babu, and C. R. Larson, “Voice                decay without using impulses,” J. Acoust. Soc. Am., vol. 66, no. 2,
     responses to changes in pitch of voice or tone auditory feedback,”           pp. 497–500, 1979.
     J. Acoust. Soc. Am., vol. 117, no. 2, pp. 850–857, 2005.
                                                                             [22] H. Kawahara, “Interactions between speech production and per-
 [3] R. Behroozmand, O. Korzyukov, and C. R. Larson, “ERP corre-                  ception under auditory feedback perturbations on fundamental
     lates of pitch error detection in complex tone and voice auditory            frequencies,” J. Acoust. Soc. Jpn. (E), vol. 15, no. 3, pp. 201–202,
     feedback with missing fundamental,” Brain Res., vol. 1448, pp.               1994.
     89–100, 2012.
                                                                             [23] H. Kawahara, H. Kato, and J. C. Williams, “Effects of auditory
 [4] S. Patel, A. Lodhavia, S. Frankford, O. Korzyukov, and C. R.                 feedback on F0 trajectory generation,” in Proc. Int. Conf. Spok.
     Larson, “Vocal and neural responses to unexpected changes in                 Lang. Process. (ICSLP), vol. 1, 1996, pp. 287–290.
     voice pitch auditory feedback during register transitions,” J. Voice,
     vol. 30, no. 6, pp. 772.e33–772.e40, 2016.                              [24] N. Aoshima, “Computer-generated pulse signal applied for sound
                                                                                  measurement,” J. Acoust. Soc. Am., vol. 69, no. 5, pp. 1484–1488,
 [5] H. Kawahara, K. I. Sakakibara, M. Mizumachi, M. Morise, and                  1981.
     H. Banno, “Simultaneous measurement of time-invariant linear
     and nonlinear, and random and extra responses using frequency           [25] C. Dunn and M. J. Hawksford, “Distortion immunity of MLS-
     domain variant of velvet noise,” in Asia-Pac. Signal Inf. Process.           derived impulse response measurements,” J. Audio Eng. Soc.,
     Assoc. Annu. Summit Conf. (APSIPA ASC), 2020, pp. 174–183.                   vol. 41, no. 5, pp. 314–335, 1993.
 [6] H. Kawahara and K. Yatabe, “Cascaded all-pass filters with ran-         [26] A. Farina, “Simultaneous measurement of impulse response and
     domized center frequencies and phase polarity for acoustic and               distortion with a swept-sine technique,” in Audio Eng. Soc. Conv.
     speech measurement and data augmentation,” arXiv:2010.13185,                 108. AES, 2000.
     2020, (Accepted for ICASSP 2021).                                       [27] G.-B. Stan, J.-J. Embrechts, and D. Archambeau, “Comparison
 [7] I. R. Titze, Principles of Voice Production.     Englewood Cliffs,           of different impulse response measurement techniques,” J. Audio
     New Jersey: Prentice-Hall, Inc., 1994.                                       Eng. Soc., vol. 50, no. 4, pp. 249–262, 2002.
 [8] J. A. Jones and D. Keough, “Auditory-motor mapping for pitch            [28] P. Guidorzi, L. Barbaresi, D. D’Orazio, and M. Garai, “Impulse
     control in singers and nonsingers,” Exp. Brain Res., vol. 190,               responses measured with MLS or Swept-Sine signals applied to
     no. 3, pp. 279–287, 2008.                                                    architectural acoustics: an in-depth analysis of the two methods
                                                                                  and some case studies of measurements inside theaters,” Energy
 [9] J. A. Tourville, K. J. Reilly, and F. H. Guenther, “Neural mecha-            Procedia, vol. 78, pp. 1611–1616, 2015.
     nisms underlying auditory feedback control of speech,” NeuroIm-
     age, vol. 39, no. 3, pp. 1429 – 1443, 2008.                             [29] H. Kawahara, “GitHub repository for speech and hearing
                                                                                  research/education tools,” 2021, (retrieved 2 April 2021).
[10] E. F. Chang, C. A. Niziolek, R. T. Knight, S. S. Nagarajan, and
                                                                                  [Online]. Available: https://github.com/HidekiKawahara
     J. F. Houde, “Human cortical sensorimotor network underlying
     feedback control of vocal pitch,” Proc. Natl. Acad. Sci. U.S.A.,        [30] H. Kawahara, K.-I. Sakakibara, M. Morise, H. Banno, T. Toda,
     vol. 110, no. 7, pp. 2653–2658, 2013.                                        and T. Irino, “A new cosine series antialiasing function and its
                                                                                  application to aliasing-free glottal source models for speech and
[11] C. Leydon, J. J. Bauer, and C. R. Larson, “The role of auditory
     feedback in sustaining vocal vibrato,” J. Acoust. Soc. Am., vol.             singing synthesis,” in Proc. Interspeech, Stocholm, August 2017,
     114, no. 3, pp. 1575–1581, 2003.                                             pp. 1358–1362.

[12] I. R. Titze, B. Story, M. Smith, and R. Long, “A reflex resonance       [31] Y. Xu and X. Sun, “Maximum speed of pitch change and how it
     model of vocal vibrato,” J. Acoust. Soc. Am., vol. 111, no. 5, pp.           may relate to speech,” J. Acoust. Soc. Am., vol. 111, no. 3, pp.
     2272–2282, 2002.                                                             1399–1413, 2002.

[13] C. R. Larson and D. A. Robin, “Sensory processing: Advances             [32] H. Fujisaki, “A note on the physiological and physical basis for the
     in understanding structure and function of pitch-shifted auditory            phrase and accent components in the voice fundamental frequency
     feedback in voice control,” AIMS Neurosci., vol. 3, no. 1, pp. 22–           contour,” Vocal physiology: Voice production, mechanisms and
     39, 2016.                                                                    functions, pp. 347–355, 1988.
[14] R. Behroozmand, K. Johari, K. Bridwell, C. Hayden, D. Fahey,            [33] H. Kawahara, “Pitfalls in digital signal processing,” J. Acoust.
     and D.-B. Den Ouden, “Modulation of vocal pitch control through              Soc. Jpn, vol. 73, no. 9, pp. 592–599, 2017, (in Japanese).
     high-definition transcranial direct current stimulation of the left     [34] H. Brumm and S. A. Zollinger, “The evolution of the Lombard ef-
     ventral motor cortex,” Exp. Brain Res., vol. 238, pp. 1525–1535,             fect: 100 years of psychoacoustic research,” Behaviour, vol. 148,
     2020.                                                                        no. 11-13, pp. 1173–1198, 2011.
[15] E. S. H. Murray and C. E. Stepp, “Relationships between vocal           [35] R. R. Patel, S. N. Awan, J. Barkmeier-Kraemer, M. Courey,
     pitch perception and production: A developmental perspective,”               D. Deliyski, T. Eadie, D. Paul, J. G. Švec, and R. Hillman, “Rec-
     Sci. Rep., vol. 10, no. 1, pp. 1–10, 2020.                                   ommended protocols for instrumental assessment of voice: Amer-
[16] D. Peng, Q. Lin, Y. Chang, J. A. Jones, G. Jia, X. Chen, P. Liu,             ican speech-language-hearing association expert panel to develop
     and H. Liu, “A causal role of the cerebellum in auditory feedback            a protocol for instrumental assessment of vocal function,” Am. J.
     control of vocal production,” Cerebellum, pp. 1–12, 2021.                    Speech-Lang. Pathol., vol. 27, no. 3, pp. 887–905, 2018.
[17] B. C. J. Moore, An introduction to the psychology of hearing,           [36] R. D. Patterson, “A pulse ribbon model of monaural phase percep-
     6th ed. Brill Academic Pub., 2013.                                           tion,” J. Acoust. Soc. Am., vol. 82, no. 5, pp. 1560–1586, 1987.
[18] T. C. Hain, T. A. Burnett, S. Kiran, C. R. Larson, S. Singh, and        [37] M. Schroeder, “Synthesis of low-peak-factor signals and binary
     M. K. Kenney, “Instructing subjects to make a voluntary response             sequences with low autocorrelation,” IEEE Trans. Inf. Theory,
     reveals the presence of two components to the audio-vocal reflex,”           vol. 16, no. 1, pp. 85–89, 1970.
     Exp. Brain Res., vol. 130, no. 2, pp. 133–141, 2000.                    [38] A. de Cheveigné, “Pitch perception models,” in Pitch: neural cod-
[19] J. M. Zarate, S. Wood, and R. J. Zatorre, “Neural networks in-               ing and perception, C. J. Plack, A. J. Oxenham, and R. R. Fay,
     volved in voluntary and involuntary vocal pitch regulation in expe-          Eds. Springer, 2005, pp. 169–233.
     rienced singers,” Neuropsychologia, vol. 48, no. 2, pp. 607–618,
     2010.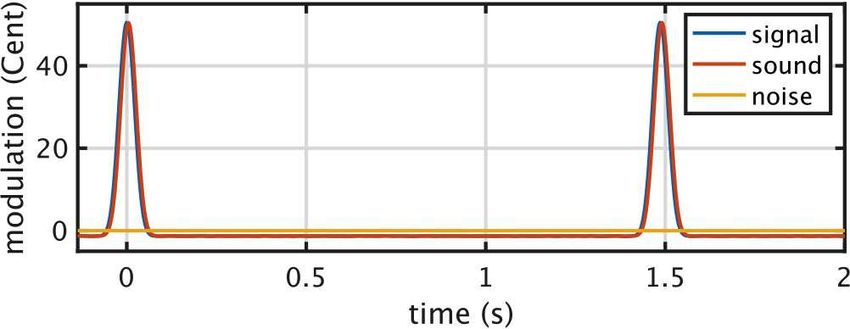
You can also read