Ultra-long-range hydroacoustic observations of submarine volcanic activity at Monowai, Kermadec Arc
←
→
Page content transcription
If your browser does not render page correctly, please read the page content below
Ultra-long-range hydroacoustic observations of
   submarine volcanic activity at Monowai, Kermadec Arc,
        D. Metz, Anthony B. Watts, I. Grevemeyer, M. Rodgers, M. Paulatto

     To cite this version:
    D. Metz, Anthony B. Watts, I. Grevemeyer, M. Rodgers, M. Paulatto. Ultra-long-range hydroacous-
    tic observations of submarine volcanic activity at Monowai, Kermadec Arc,. Geophysical Research
    Letters, American Geophysical Union, 2016, 43 (4), pp.1529-1536. �10.1002/2015GL067259�. �hal-
    01347208�

                                 HAL Id: hal-01347208
                https://hal.archives-ouvertes.fr/hal-01347208
                                     Submitted on 8 Sep 2021

    HAL is a multi-disciplinary open access            L’archive ouverte pluridisciplinaire HAL, est
archive for the deposit and dissemination of sci- destinée au dépôt et à la diffusion de documents
entific research documents, whether they are pub- scientifiques de niveau recherche, publiés ou non,
lished or not. The documents may come from émanant des établissements d’enseignement et de
teaching and research institutions in France or recherche français ou étrangers, des laboratoires
abroad, or from public or private research centers. publics ou privés.
                                              Copyright
PUBLICATIONS
Geophysical Research Letters
RESEARCH LETTER                             Ultra-long-range hydroacoustic observations
10.1002/2015GL067259
                                            of submarine volcanic activity at Monowai,
Key Points:
• T phase arrivals at Ascension Island
                                            Kermadec Arc
  can be linked to a submarine eruption     D. Metz1, A. B. Watts1, I. Grevemeyer2, M. Rodgers1, and M. Paulatto3
  at Monowai, Kermadec Arc
• T phases must have traveled along the     1
                                             Department of Earth Sciences, University of Oxford, Oxford, UK, 2GEOMAR Helmholtz Centre for Ocean Research Kiel, Kiel,
  SOFAR channel and over a geodesic
  range of ~15,800 km                       Germany, 3Géoazur, Université Nice Sophia Antipolis, Valbonne, France
• Our results are confirmed by correlation
  with broadband seismic data and
  transmission loss modeling                Abstract Monowai is an active submarine volcanic center in the Kermadec Arc, Southwest Pacific Ocean.
                                            During May 2011, it erupted over a period of 5 days, with explosive activity directly linked to the generation
Supporting Information:                     of seismoacoustic T phases. We show, using cross-correlation and time-difference-of-arrival techniques, that
• Supporting Information S1                 the eruption is detected as far as Ascension Island, equatorial South Atlantic Ocean, where a bottom moored
                                            hydrophone array is operated as part of the International Monitoring System of the Comprehensive Nuclear-Test-Ban
Correspondence to:                          Treaty Organization. Hydroacoustic phases from the volcanic center must therefore have propagated through
D. Metz,
dirkm@earth.ox.ac.uk                        the Sound Fixing and Ranging channel in the South Pacific and South Atlantic Oceans, a source-receiver distance
                                            of ~15,800 km. We believe this to be the furthest documented range of a naturally occurring underwater
                                            signal above 1 Hz. Our findings, which are consistent with observations at regional broadband stations and
Citation:
Metz, D., A. B. Watts, I. Grevemeyer,       long-range, acoustic parabolic equation modeling, have implications for submarine volcano monitoring.
M. Rodgers, and M. Paulatto (2016),
Ultra-long-range hydroacoustic
observations of submarine volcanic          1. Introduction
activity at Monowai, Kermadec Arc,
Geophys. Res. Lett., 43, 1529–1536,         Estimations on the number of active volcanoes in the world’s oceans range from hundreds to thousands, and only
doi:10.1002/2015GL067259.                   a few active sites have been studied in detail due to their inherent inaccessibility. Monowai Volcanic Centre at
                                            25.89°S, 177.18°W in the northern Kermadec Arc comprises an active submarine stratovolcanic cone, a number
Received 1 DEC 2015
Accepted 29 JAN 2016
                                            of parasitic cones, and a flanking caldera with a small central dome [e.g., Wormald et al., 2012; Paulatto et al.,
Accepted article online 2 FEB 2016          2014]. The center has a well-documented record of more than five decades of activity [e.g., Davey, 1980;
Published online 22 FEB 2016                Talandier and Okal, 1987], including discolored surface water, intermittent observations of changes of seafloor
Corrected 9 JUN 2017 and
                                            depth due to ongoing magmatic activity, large-scale sector collapses, and swarms of tertiary phase arrivals
17 DEC 2020
                                            (“T phases”) recorded at broadband seismic stations in the southwest Pacific region [Wright et al., 2008;
This article was corrected on 9 JUN         Chadwick et al., 2008a]. Repeat swath bathymetric mapping has revealed the highly dynamic nature of Monowai
2017 and on 17 DEC 2020. See the
                                            cone, the summit of which has shallowed by ~67 m since 2004. Its most recent documented eruption was during
end of the full text for details.
                                            14 May to 1 June 2011, when significant morphological differences were observed aboard R/V SONNE (expedition
                                            SO215), including the development of a ~72 m high-summit cone and a flanking sector collapse of ~18 m [Watts
                                            et al., 2012]. During this period, a 5 day long burst of T phases was recorded at broadband seismic stations on
                                            Rarotonga (Cook Islands), Papeete (Tahiti), and Marquesas Islands (Figure 1a), thereby directly linking seismoacous-
                                            tic observations and changes in seafloor depth due to submarine volcanic activity for the first time. Apart from the
                                            Monowai Volcanic Centre, recent reports of T phases generated by submarine explosive volcanism along the wider
                                            Tonga-Kermadec area include West Mata, Hunga Ha’apai-Hunga, and Brothers Volcano [Dziak et al., 2008;
                                            Bohnenstiehl et al., 2014].
                                            T phases are low-frequency sound waves that travel in the Sound Fixing and Ranging (SOFAR) channel, a dis-
                                            tinct layer of low sound wave speed in the oceanic water column [Tolstoy et al., 1949; Ewing et al., 1951]. The
                                            SOFAR channel effectively serves as an acoustic waveguide for underwater signals of various origins, with the
                                            large majority generated by earthquakes at plate boundaries, for example, along subduction zones and mid-
                                            oceanic ridge crests [Smith et al., 2002; Graeber and Piserchia, 2004]. During the transition from ocean to land,
                                            the seismoacoustic signal trapped in the deep sound channel can be converted effectively and thus becomes
                                            detectable by both ocean-moored hydrophones and land-based seismometers [Stevens et al., 2001], often
                                            providing significant improvement in event detection and relocation where instrument coverage is poor
                                            [e.g., Tolstoy and Bohnenstiehl, 2005; Ito et al., 2012].

©2016. American Geophysical Union.
                                            T phase seismicity is a key feature of the hydroacoustic waveform component of the International Monitoring
All Rights Reserved.                        System (IMS) which is maintained by the Comprehensive Nuclear-Test-Ban Treaty Organization (CTBTO).

METZ ET AL.                                             ULTRA-LONG-RANGE HYDROACOUSTIC ACTIVITY                                                               1529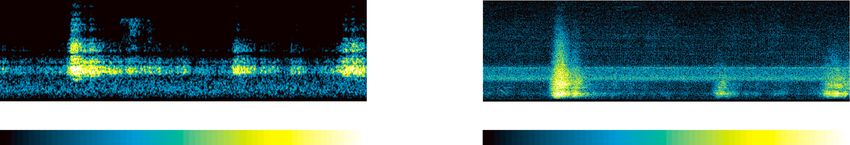
Geophysical Research Letters                                                               10.1002/2015GL067259

                  Figure 1. (a) Location map of Monowai Volcanic Centre (MVC, red triangle) and IMS station H10 (orange star). T phases of
                  the May 2011 eruption were recorded at three regional broadband stations (blue diamonds) at Rarotonga (RAR), Papeete
                  (PPTF), and Marquesas Islands (TAOE). The stations are located at 1847 km, 2991 km, and 4340 km distance from the
                  volcano, respectively. Bathymetry is taken from the 2008 GEBCO grid. (b) Position map of the H10S and H10N hydrophone
                  arrays near Ascension Island with insets for individual components. Geodesic distances between Monowai and the
                  hydrophone arrays are 15,717 km (H10S) and 15,834 km (H10N).

                  Currently, a total of ten hydroacoustic receiver sites are in operation worldwide, six of which are hydrophone
                  triplet arrays, typically deployed near the axis of the SOFAR channel [Okal, 2001]. In this study, we focus on
                  recordings from IMS station H10 at Ascension Island, equatorial South Atlantic Ocean, of the five-day long
                  explosive activity documented by Watts et al. [2012] at the Monowai Volcanic Centre, southwest Pacific
                  Ocean (Figure 1).

                  2. Hydroacoustic Data and Direction-of-Arrival Calculations
                  IMS Station H10 consists of two tripartite arrays of bottom moored hydrophones located northwest and south-
                  west of Ascension Island (Figure 1b). The triplets, H10N1-3 and H10S1-3, respectively, are positioned at approxi-
                  mately 875 m depth and equidistant interhydrophone spacing of 2 km. Acoustic measurements are made at
                  250 Hz sampling rate and transmitted in real time to the International Data Centre (IDC) in Vienna for routine
                  processing and analyst review [Hanson et al., 2001]. Following the onset of the eruption at Monowai Volcanic
                  Centre on 17 May 2011, both H10 arrays recorded a high incidence of hydroacoustic T phases.
                  To determine the direction of arrival of these signals, we follow an approach previously introduced by Heaney
                  et al. [2013] for the investigation of volcanogenic T phase arrivals associated with the 2010 eruption at Sarigan
                  Seamount. Hydrophone recordings are corrected for instrument response and a mean and trend is removed. A
                  two-pole band-pass filter with a low- and high-cutoff frequency of 4 Hz and 12 Hz, respectively, is applied to
                  avoid noise contamination from either end of the spectrum, e.g., through ocean microseism, whale vocalization,
                  or ship screw noise, and in general reflects the frequency range at which T phases would be expected to
                  efficiently propagate within the SOFAR channel due to its inherent geometry [Hanson and Bowman, 2006].
                  Hydrophone recordings were subdivided into 1 min long windows over a continuous period of 5 days
                  between 06:00 UTC 17 May and 06:00 UTC 22 May 2011. Peak delay times Δt are calculated from pairwise,
                  normalized cross-correlation of the windowed data. The angle of arrival θ, which represents the geodesic
                  back azimuth along the great circle path between receiver and source, is then derived from the peak delay
                  times between pairs of hydrophones positioned at distance d and averaged over the array. Since the spacing
                  of the array elements (i, j) is multiple orders of magnitude smaller than the source-receiver distance, we can
                  assume a planar wave front for a point source in the acoustic far field:

                                                                                cΔt
                                                              θij ðΔtÞ ¼ cos1                                                (1)
                                                                                 dij

                  where c is the propagation speed across the array. Geometric ambiguity of the inverse cosine function is
                  resolved by an a priori estimation of both the signal source location and c, which can be inferred from local

METZ ET AL.                   ULTRA-LONG-RANGE HYDROACOUSTIC ACTIVITY                                                               1530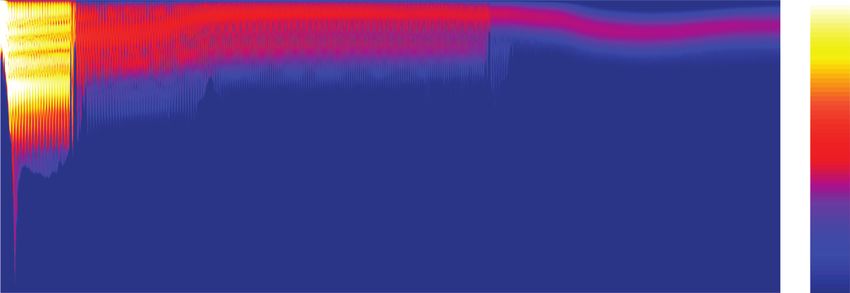
Geophysical Research Letters                                                                     10.1002/2015GL067259

                  Figure 2. Twenty-four hours of data recorded at station H10S, beginning at 06:00 UTC 17 May 2011. (a) Single-receiver
                  spectrogram of the H10S1 hydrophone data. A 2 Hz high-pass filter is applied to eliminate low-frequency noise; however,
                  wide-band contamination is present between 18 and 26 Hz, possibly due to ship noise. (b) Root-mean-squared (RMS)
                  amplitudes calculated over 1 min windows. The results of the time-difference-of-arrival processing are shown in the
                  form of (c) correlation coefficients and (d) back azimuths averaged over the H10S array. Only time windows with an
                  average coefficient ≥ 0.33 are used in the back azimuth calculation. The onset of the eruption at Monowai is recognizable
                  in all four subfigures: Hydroacoustic phases, most distinguishable in the 2 to 20 Hz band, arrive from 09:00 UTC onward,
                  accompanied by a positive shift in RMS amplitude of almost 20 dB re 1 μPa. Correlation values between hydrophones
                  increase significantly at the same time, resulting in the distinct stabilization of the angle of arrival to within a degree of the
                  predicted back azimuth to Monowai at 205.5°.

                  water column data and is fixed at 1492 m/s for the H10 station (Figure S1 in the supporting information). Only
                  time windows with an average correlation coefficient ≥ 0.33 are used in (1) to eliminate weakly correlated
                  background noise.

                  3. Observations at the Ascension Island Array
                  Our calculations show that volcanic activity at the Monowai Volcanic Centre stabilizes back azimuths over an
                  approximately 5 day long period, representing a persistent source of acoustic energy at both arrays of the
                  Ascension Island station.
                  The onset of the eruption at 09:00 UTC on 17 May is clearly recognizable in the spectrogram of hydroacoustic
                  measurements, shown for the southern array in Figure 2a. Here one of the most striking features is a
                  continuous, low-level noise band in the 18–25 Hz range, which we attribute to ship traffic in the area. T phases
                  are most notable in the 2–20 Hz range, with lengths of tens of seconds up to several minutes and average
                  acoustic intensities of 100 to 110 dB re 1 μPa2/Hz. Maximum levels of 125 dB re 1 μPa2/Hz are reached during
                  minute-long bursts of broadband, high-frequency energy, ranging up to 40 Hz and more. These arrivals occur
                  predominantly during the first 48 h of the eruption at rates of up to 10 per hour, most likely representing
                  explosions at the magma-water interface [e.g., Chadwick et al., 2008b]. With the beginning of the eruption,
                  peak RMS values increase by almost 20 dB compared to preeruptive background levels (Figure 2b).

METZ ET AL.                    ULTRA-LONG-RANGE HYDROACOUSTIC ACTIVITY                                                                       1531
Geophysical Research Letters 10.1002/2015GL067259
Figure 3. Traces of the (a) RAR vertical seismometer component and (b) hydrophone H10S1. The data are recorded at 20 Hz
sampling rate at RAR and 250 Hz at H10S1, band-pass filtered at 2–6 Hz and 4–12 Hz, respectively, and show arrivals during
6 h long periods on 17 May 2011. Traces are aligned for an offset of 156 min and 12 s, the nominal travel time difference
between the two receivers for a presumed signal source at Monowai. Vertical red lines delimit the time range of 30 min
spectrograms of land-recorded T phases and corresponding arrivals at H10S1 as shown in Figures 3c and 3d. (c and d) The
dB scale is normalized for better comparability and does not reflect absolute physical quantities. Spectral data are high-pass
filtered at 2 Hz. There is a striking visual coherence between the signal envelopes in Figures 3a and 3b and relative
frequency distributions of the individual bursts in Figures 3c and 3d, respectively.
Average correlation coefficients of the windowed hydrophone data rise sharply, scattering between 0.25 and 0.8
from 17 May 09:00 UTC onward (Figure 2c). The angle of arrival simultaneously stabilizes around 206.5 ± 0.2°
during the first 24 h of the eruption, which closely matches the predicted geodesic back azimuth to Monowai,
and clearly indicates a signal source between IMS Station H10 and the volcanic center (Figure 2d).
The end of the eruptive episode occurs around 13:00 UTC on 23 May, when calculated back azimuths become
more scattered, before cross-correlation coefficients drop beneath the detection threshold of 0.33 at 16:00
UTC (Figure S2). There are several pauses in activity over the course of the 5 days, ranging from tens of min-
utes up to a 6 h long break in activity on 21 May. The high incidence of T phase arrivals and the partial overlap
of individual events and their codas result in a quasi-continuous character of the signal, adding up to an
acoustic signature which is best described as low-level, volcano-seismic tremor interspersed with explosive
activity [see, e.g., Fox et al., 2001].
4. Combining Hydroacoustic and Broadband Seismic Data
In order to confirm the azimuthal constraints of the direction-of-arrival calculations, we relate acoustic and
seismic measurements in both the near field and far field in an effort to unambiguously identify volcanic
activity at the Monowai Volcanic Centre as the primary signal source. T phase arrivals associated with the
May 2011 eruption were detected at three seismic broadband stations at Rarotonga (RAR), Papeete (PPTF),
and Marquesas Islands (TAOE) in the Pacific Ocean (Figure 1). However, both PPTF and TAOE seismic data
are affected by high ambient noise levels during the time of the eruption, preventing the application of com-
mon relocation techniques for individual T phase events [e.g., Williams et al., 2006]. Instead, we exploit relative
METZ ET AL. ULTRA-LONG-RANGE HYDROACOUSTIC ACTIVITY 1532Geophysical Research Letters 10.1002/2015GL067259
Figure 4. (a) Normalized RMS amplitudes at the RAR seismic station (vertical component) and the H10S1 hydrophone,
calculated for 1 min windows between 06:00 UTC 17 May and 06:00 UTC 18 May. The data are band-pass filtered at
2–6 Hz and 4–12 Hz, respectively. Red circles highlight corresponding RMS peaks for clarity. (b) Cross-correlation results of
data in Figure 4a. The distinct 0.92 peak marks the maximum coefficient of this 24 h period. The corresponding delay
time is 157 min, indicating that the signal arrives 2 h and 37 min earlier at the Rarotonga seismometer relative to the
Ascension Island hydrophone.
travel time differences between the proximal RAR station and a single, distal H10 hydrophone element for
our calculations.
Assuming a signal source at Monowai and a constant axial propagation speed of 1475 ± 3 m/s, a reasonable
estimate for the sound speed average along the geodesic path between the volcano and Ascension Island
[Munk and Forbes, 1989], nominal arrival time offsets between these two receiving stations are estimated
at 156 min 43 ± 21 s. Stacking the traces according to this offset (Figures 3a and 3b) reveals a striking visual
coherence between the signals, precisely aligning higher-amplitude phases and periods of quiescence.
Individual T phase events appear similar in both time and frequency domains (Figures 3c and 3d). This is
despite the possibility that higher frequencies tend to be lost during the ocean-land conversion process at
the RAR station [Stevens et al., 2001].
In a further step to remove any ambiguity regarding the source, envelope functions are calculated from
normalized RMS amplitudes for the H10S1 hydrophone and the vertical component of RAR station. There
is a notable visual coherence between the two signals (Figure 4a), and cross-correlation of the envelope func-
tions from RAR and H10S1 shows a high degree of correlation (Figure 4b). Twenty-four hour time windows
were chosen for cross-correlation as this is approximately 10 times the expected delay time between the
two stations. The highest cross-correlation coefficient of the eruption is observed during the first 24 h win-
dow, with a cross-correlation coefficient of 0.92 at a lag of 157 ± 1 min (Figure 4b). The high level of correla-
tion is attributed to the large number of high-amplitude, coherent arrivals during this time. This calculation is
in agreement with the calculated delay time assumed in Figure 3 (156 min 43 ± 21 s) and confirms our initial
assumption of a common signal source at Monowai.
Our observations are equivalent for both the H10S and H10N hydrophone array, located at great circle dis-
tances of 15,717 and 15,834 km respectively from Monowai. These are, to our current knowledge, the longest
ranges ever reported for any naturally occurring underwater phenomena and are only superseded by the
artificial source-receiver paths achieved during the Heard Island Feasibility Test [Munk et al., 1994]. The signif-
icant coherence observed between the seismic and hydrophone recordings further suggest that the overall
seismoacoustic structure of the eruption is conserved in the T phase signal, even over extremely long
METZ ET AL. ULTRA-LONG-RANGE HYDROACOUSTIC ACTIVITY 1533Geophysical Research Letters 10.1002/2015GL067259
Figure 5. Two dimensional parabolic equation model (RAM, [Collins, 1993]) for a source-receiver path between Monowai
Seamount and H10S. The model assumes an 8 Hz source at 60 m depth, corresponding to the dominant frequency of
hydroacoustic arrivals and the bathymetry of the volcano. Apart from the Louisville and North Scotia Ridge, located at km
1,500 and km 9,500 along the profile respectively, ray paths along the SOFAR channel axis experience little obstruction and
appear to be limited only by the sea surface in southern latitudes. Transmission loss for a receiver (black star) at 875 m
depth is estimated to be ~145-150 dB re 1 μPa. Bottom properties are set to 1,700 m/s for sound speed, with attenuation
parameters of 0.3 and 3.5 dB/m/kHz at 100 and 300 m below the seafloor respectively [Kibblewhite, 1989]. Bathymetry is
taken from the 2008 GEBCO grid, sampled at 100 m intervals. Water column data is taken from the 2001 World Ocean Atlas,
with sound speed profiles calculated every kilometre according to [Mackenzie, 1981].
distances and propagation through different media. Nonetheless, it is important to note that seismoacoustic
activity associated with the May 2011 eruption at Monowai was not detected at further sites in the southern
Pacific or Atlantic Ocean, including two broadband stations located on Ascension Island itself. This illustrates,
at least for the case of volcanic activity at the Monowai Volcanic Centre, the advantage of a sensitive, acous-
tically “quiet” hydrophone array over single-element, land-based instruments.
Our approach holds true for further eruptions at the Monowai Volcanic Centre. On 1 January 2013, a swath
mapping campaign of the SO225 expedition aboard R/V SONNE had to be aborted due to a sudden increase
in volcanic activity, including observations of surface-reflected shockwaves in the audible range, pumice
rafts, and discolored water [Werner et al., 2013]. A preliminary screening of the Ascension Island hydrophone
data reveals persistent high-energy arrivals from a back azimuth of 205.5° for this time period, which in
overall frequency content, spatial and temporal distribution strongly resembles our observations of the
May 2011 eruption.
5. Investigation of Potential Bathymetric Blockage and Transmission
Loss Modeling
Long-distance hydroacoustic propagation can be affected by bathymetric obstruction and range-dependent
sound speed variations [Blum and Cohen, 1971]. Furthermore, the existence of a deep sound channel is not facili-
tated at southern latitudes, where water masses at critical depths are dominated by the temperature regime of
the Antarctic Circumpolar Current (ACC) [Denham and Kibblewhite, 1970]. Using a range-dependent adiabatic
equation model (RAM) [Collins, 1993], we therefore investigate the source-receiver path by calculating the full
sound field over the geodesic profile between Monowai and the Ascension Island hydrophones (Figure 5).
In order to reflect the prevailing frequency content of the T phase arrivals observed at H10S, we assume an
8 Hz source, placed at 60 m below sea level which is in accord with the most recent estimates of summit
depth at Monowai [Watts et al., 2012]. The nominal great circle distance is ~15,717 km for the southern triplet
array. Potential obstructions along the acoustic ray path include the Louisville Ridge as well as the Pacific-
Antarctic Ridge, the Scotia Sea Ridges, the Maurice Ewing Bank, the eastern Rio Grande Rise, and the southern
Mid-Atlantic Ridge.
Our modeling shows that the most severe transmission loss occurs near the Louisville Ridge seamount chain,
where the crest of one of the seamounts in the chain intersects the SOFAR channel axis and the signal is par-
tially blocked, resulting in an average reduction of 20 to 25 dB re 1 μPa. A similar effect would be expected for
the area around the North Scotia Ridge and Maurice Ewing Bank, where seafloor depths are shallowest along
METZ ET AL. ULTRA-LONG-RANGE HYDROACOUSTIC ACTIVITY 1534Geophysical Research Letters 10.1002/2015GL067259
the profile. However, the RAM model predicts that acoustic phases partially propagate as surface reflected
waves south of the 60°S parallel, thereby evading bathymetric obstruction and reducing the average effect
of acoustic blockage to ~10 dB re 1 μPa. This upward shift of the axis of the SOFAR channel is facilitated by
the temperature anomaly of the ACC, which dilutes vertical sound speed gradients in the upper layers and
subsequently raises the minimum velocity zone to shallower depths of up to 300 m and less (e.g., Northrop
and Colborn [1974] and de Groot-Hedlin et al. [2009]; see also Figure S3). Similar effects of range-dependent
temperature variations on high-latitude acoustic propagation have been previously observed by Chapp
et al. [2005], enabling long-distance detection of iceberg-generated tremor in the southern Indian Ocean.
Overall transmission loss along the wider sound channel axis varies between 110 and 150 dB re 1 μPa.
Transmission loss at the receiver depth of 875 m at full distance averages around 145–150 dB re 1 μPa. This
implies maximum source levels of ~275–280 dB re 1 μP at Monowai, which is comparable to amplitudes of
explosive activity reported at NW-Rota 1 or West Mata volcano by Chadwick et al. [2008b] and Dziak et al.
[2015]. Derived source levels correspond to seismic events with body wave magnitudes of mb ≤ 4.0 [Fox
et al., 2001], a size which appears typical for submarine explosion-type systems [e.g., Dziak et al., 1996] but
generally is too small to be detected by conventional methods in remote regions by a sparse global network.
6. Summary
Acoustic phases associated with a 5 day long episode of submarine volcanic activity at the Monowai Volcanic
Centre were detected on CTBTO hydrophone installations at Ascension Island, Mid-Atlantic Ocean. The geo-
desic source-receiver path of approximately 15,800 km is, to our knowledge, the longest ranging, naturally
occurring hydroacoustic signal above 1 Hz ever observed in the world’s oceans. Our observations are consis-
tent with the timing of T phase arrivals at the Rarotonga broadband seismic station for a source at Monowai.
They are also consistent with the results of two-dimensional adiabatic mode calculations based on the RAM
Parabolic Equation which suggest that hydroacoustic signals partially travel as surface reflected phases at
shallow depths in the southern oceans, thereby avoiding significant acoustic blockage by topographic obsta-
cles during the transition from Pacific to Atlantic waters. Our findings highlight the exceptional capabilities of
the International Monitoring System of the CTBTO and its potential for remotely detecting further episodes of
submarine volcanic activity and therefore better understanding the dynamics of the seafloor, both at
Monowai and elsewhere, in the future.
Acknowledgments
Hydroacoustic data were made avail-
References
able by the CTBTO International Data Blum, J. W., and D. S. Cohen (1971), Acoustic wave propagation in an underwater sound channel: I. Qualitative theory, J. Inst. Math. Appl., 8,
Centre, Vienna, through the virtual Data 186–198.
Exploitation Centre (vDEC, www.ctbto. Bohnenstiehl, D. R., R. P. Dziak, H. Matsumoto, and J. A. Conder (2014), Acoustic response of submarine volcanoes in the Tofua Arc and
org/specials/vdec/), and processed northern Lau Basin to two great earthquakes, Geophys. J. Int., 196(3), 1657–1675, doi:10.1093/gji/ggt472.
using MATLAB-based tools, including Chadwick, W. W. J., I. C. Wright, U. Schwarz-Schampera, O. Hyvernaud, D. Reymond, and C. E. J. de Ronde (2008a), Cyclic eruptions and sector
the Waveform Suite by Reyes and West collapses at Monowai submarine volcano, Kermadec arc: 1998–2007, Geochem. Geophys. Geosyst., 9, Q10014, doi:10.1029/2008GC002113.
[2011]. The facilities of IRIS Data Services Chadwick, W. W. J., K. V. Cashman, R. W. Embley, H. Matsumoto, R. P. Dziak, C. E. J. de Ronde, T. K. Lau, N. D. Deardorff, and S. G. Merle (2008b),
were used for access to waveforms of Direct video and hydrophone observations of submarine explosive eruptions at NW Rota-1 volcano, Mariana arc, J. Geophys. Res., 113,
the Rarotonga broadband station. IRIS B08S10, doi:10.1029/2007JB005215.
Data Services are funded through the Chapp, E., D. R. Bohnenstiehl, and M. Tolstoy (2005), Sound-channel observations of ice-generated tremor in the Indian Ocean, Geochem.
Seismological Facilities for the Geophys. Geosyst., 6, Q06003, doi:10.1029/2004GC000889.
Advancement of Geoscience and Collins, M. D. (1993), A split-step pade solution for the parabolic equation method, J. Acoust. Soc. Am., 93(4), 1736–1742, doi:10.1121/
EarthScope (SAGE) Proposal of the 1.406739.
National Science Foundation under Davey, F. J. (1980), The Monowai Seamount—An active submarine volcanic center on the Tonga-Kermadec Ridge, N. Z. J. Geol. Geophys.,
Cooperative Agreement EAR-1261681. 23(4), 533–536.
The authors would like to thank Karin de Groot-Hedlin, C., D. K. Blackman, and C. S. Jenkins (2009), Effects of variability associated with the Antarctic circumpolar current on sound
Sigloch, Tarje Nissen-Meyer (both propagation in the ocean, Geophys. J. Int., 176(2), 478–490, doi:10.1111/j.1365-246X.2008.04007.x.
Oxford), Ian Wright (National Denham, R. N., and A. C. Kibblewhite (1970), Sound-velocity structure of South Pacific Ocean, N. Z. J. Geol. Geophys., 13(1), 39.
Oceanographic Centre), and Steve Dziak, R. P., C. G. Fox, R. W. Embley, J. E. Lupton, G. C. Johnson, W. W. Chadwick, and R. A. Koski (1996), Detection of and response to a
McNutt (University of South Florida) for probable volcanogenic T-wave event swarm on the western Blanco Transform Fault Zone, Geophys. Res. Lett., 23(8), 873–876, doi:10.1029/
their fruitful discussions; Mark Prior and 96GL00240.
Antero Tuppurainen (both CTBTO) for Dziak, R. P., J. H. Haxel, H. Matsumoto, T. K. Lau, S. G. Merle, C. E. J. de Ronde, R. W. Embley, and D. K. Mellinger (2008), Observations of regional
technical advice on IMS instrumentation seismicity and local harmonic tremor at Brothers volcano, south Kermadec arc, using an ocean bottom hydrophone array, J. Geophys. Res.,
and database access; and Maya Tolstoy 113, B08S04, doi:10.1029/2007JB005533.
and Ralph Stephen for their helpful Dziak, R. P., D. R. Bohnenstiehl, E. T. Baker, H. Matsumoto, J. Caplan-Auerbach, R. W. Embley, S. G. Merle, S. L. Walker, T. K. Lau, and
reviews. D. Metz was partially supported W. W. J. Chadwick (2015), Long-term explosive degassing and debris flow activity at West Mata submarine volcano, Geophys. Res. Lett., 42,
by a grant from the German Academic 1480–1487, doi:10.1002/2014GL062603.
Exchange Service (DAAD). Ewing, M., F. Press, and J. L. Worzel (1951), Further observations of the T-phase, Geol. Soc. Am. Bull., 62(12), 1527.
METZ ET AL. ULTRA-LONG-RANGE HYDROACOUSTIC ACTIVITY 1535Geophysical Research Letters 10.1002/2015GL067259
Fox, C. G., H. Matsumoto, and T. Lau (2001), Monitoring Pacific Ocean seismicity from an autonomous hydrophone array, J. Geophys. Res.,
106(B3), 4183–4206, doi:10.1029/2000JB900404.
Graeber, F. M., and P.-F. Piserchia (2004), Zones of T-wave excitation in the NE Indian ocean mapped using variations in backazimuth over
time obtained from multi-channel correlation of IMS hydrophone triplet data, Geophys. J. Int., 158(1), 239–256, doi:10.1111/
j.1365-246X.2004.02301.x.
Hanson, J., R. Le Bras, P. Dysart, D. Brumbaugh, A. Gault, and J. Guern (2001), Operational processing of hydroacoustics at the Prototype
International Data Center, Pure Appl. Geophys., 158(3), 425–456, doi:10.1007/PL00001190.
Hanson, J. A., and J. R. Bowman (2006), Methods for monitoring hydroacoustic events using direct and reflected T waves in the Indian Ocean,
J. Geophys. Res., 111, B02305, doi:10.1029/2004JB003609.
Heaney, K. D., R. L. Campbell, and M. Snellen (2013), Long range acoustic measurements of an undersea volcano, J. Acoust. Soc. Am., 134(4),
3299, doi:10.1121/1.4818844.
Ito, A., H. Sugioka, D. Suetsugu, H. Shiobara, T. Kanazawa, and Y. Fukao (2012), Detection of small earthquakes along the Pacific-Antarctic
Ridge from T-waves recorded by abyssal ocean-bottom observatories, Mar. Geophys. Res., 33(3), 229–238, doi:10.1007/s11001-012-9158-0.
Kibblewhite, A. C. (1989), Attenuation of sound in marine-sediments—A review with emphasis on new low-frequency data, J. Acoust. Soc. Am.,
86(2), 716–738, doi:10.1121/1.398195.
Mackenzie, K. V. (1981), 9-term equation for sound speed in the oceans, J. Acoust. Soc. Am., 70(3), 807–812, doi:10.1121/1.386920.
Munk, W. H., and A. M. G. Forbes (1989), Global ocean warming: An acoustic measure?, J. Phys. Oceanogr., 19(11), 1765–1780, doi:10.1175/
1520-0485.
Munk, W. H., R. C. Spindel, and A. Baggeroer (1994), The heard island feasibility test, J. Acoust. Soc. Am., 96(4), 2330, doi:10.1121/1.410105.
Northrop, J., and J. G. Colborn (1974), Sofar channel axial sound speed and depth in the Atlantic Ocean, J. Geophys. Res., 79(3), 5633–5641,
doi:10.1029/JC079i036p05633.
Okal, E. A. (2001), T-phase Stations for the International Monitoring System of the Comprehensive Nuclear-Test-Ban Treaty: A global
perspective, Seismol. Res. Lett., 72(2), 186–196, doi:10.1785/gssrl.72.2.186.
Paulatto, M., A. B. Watts, and C. Peirce (2014), Potential field and high-resolution bathymetry investigation of the Monowai volcanic centre,
Kermadec Arc: Implications for caldera formation and volcanic evolution, Geophys. J. Int., 197(3), 1484–1499, doi:10.1093/gji/ggt512.
Reyes, C. G., and M. E. West (2011), The waveform suite: A robust platform for manipulating waveforms in MATLAB, Seismol. Res. Lett., 82(1),
104–110, doi:10.1785/gssrl.82.1.104.
Smith, D. K., M. Tolstoy, C. G. Fox, D. R. Bohnenstiehl, H. Matsumoto, and M. J. Fowler (2002), Hydroacoustic monitoring of seismicity at the
slow-spreading Mid-Atlantic Ridge, Geophys. Res. Lett., 29(1), 1518, doi:10.1029/2001GL013912.
Stevens, J. L., G. E. Baker, R. W. Cook, G. L. D’Spain, L. P. Berger, and S. M. Day (2001), Empirical and numerical modeling of T-phase
propagation from ocean to land, Pure Appl. Geophys., 158(3), 531–565, doi:10.1007/PL00001194.
Talandier, J., and E. A. Okal (1987), Seismic detection of underwater volcanism—The example of french polynesia, Pure Appl. Geophys., 125(6),
919–950, doi:10.1007/BF00879361.
Tolstoy, I., M. Ewing, and F. Press (1949), T phase of shallow-focus submarine earthquakes, Geol. Soc. Am. Bull., 60(12), 1957.
Tolstoy, M., and D. R. Bohnenstiehl (2005), Hydroacoustic constraints on the rupture duration, length, and speed of the Great Sumatra-Andaman
Earthquake, Seismol. Res. Lett., 76(4), 419–425.
Watts, A. B., C. Peirce, I. Grevemeyer, M. Paulatto, W. Stratford, D. Bassett, J. A. Hunter, L. M. Kalnins, and C. E. J. de Ronde (2012), Rapid rates of
growth and collapse of Monowai submarine volcano in the Kermadec Arc, Nat. Geosci., 5(7), 510–515, doi:10.1038/ngeo1473.
Werner, R., D. Nürnberg, and F. Hauff (2013), RV SONNE—Cruise report SO225, Kiel.
Williams, C. M., R. A. Stephen, and D. K. Smith (2006), Hydroacoustic events located at the intersection of the Atlantis (30°N) and Kane (23°
40’N) Transform Faults with the Mid-Atlantic Ridge, Geochemistry, 7(6), 6015, doi:10.1029/2005GC001127.
Wormald, S. C., I. C. Wright, J. M. Bull, G. Lamarche, and D. J. Sanderson (2012), Morphometric analysis of the submarine arc volcano Monowai
(Tofua-Kermadec Arc) to decipher tectono-magmatic interactions, J. Volcanol. Geotherm. Res., 239, 69–82, doi:10.1016/
j.jvolgeores.2012.06.004.
Wright, I. C., W. W. J. Chadwick, C. E. J. de Ronde, D. Reymond, O. Hyvernaud, H.-H. Gennerich, P. Stoffers, K. Mackay, M. A. Dunkin, and
S. C. Bannister (2008), Collapse and reconstruction of Monowai submarine volcano, Kermadec arc, 1998–2004, J. Geophys. Res., 113,
B08S03, doi:10.1029/2007JB005138.
Erratum
In the originally published version of this article, the mooring depth of the H10 hydrophone arrays at
Ascension Island was erroneously quoted as 1700 m below sea level. The correct depth of the tripartite arrays
is in fact 875 m below sea level, and in direct vicinity of the SOFAR channel axis in the region. In addition,
an error due to which the cylindrical spreading term had been omitted from the transmission loss model
was corrected in the latest version. These oversights did not affect our direction-of-arrival calculations,
but required corrections to our estimates of peak acoustic source levels and body wave magnitudes.
Figures 5 and S1 were amended accordingly. The authors would like to thank Albert Brouwer (CTBTO)
for his help with recalculating the instrument depths from the virtual Data Exploitation Centre (vDEC).
All corrections have since been made, and the present version may be considered the authoritative
version of record.
METZ ET AL. ULTRA-LONG-RANGE HYDROACOUSTIC ACTIVITY 1536You can also read