A pilot study investigating the use of 4D flow MRI for the assessment of splanchnic flow in patients suspected of mesenteric ischaemia - Nature
←
→
Page content transcription
If your browser does not render page correctly, please read the page content below
www.nature.com/scientificreports
OPEN A pilot study investigating the use
of 4D flow MRI for the assessment
of splanchnic flow in patients
suspected of mesenteric ischaemia
Pauline Hall Barrientos1*, Katrina Knight2, Douglas Black3, Alexander Vesey4 & Giles Roditi3
The most common cause of chronic mesenteric ischaemia is atherosclerosis which results in limitation
of blood flow to the gastrointestinal tract. This pilot study aimed to evaluate 4D flow MRI as a
potential tool for the analysis of blood flow changes post-prandial within the mesenteric vessels.
The mesenteric vessels of twelve people were scanned; patients and healthy volunteers. A baseline
MRI scan was performed after 6 h of fasting followed by a post-meal scan. Two 4D flow datasets were
acquired, over the superior mesenteric artery (SMA) and the main portal venous vessels. Standard
2D time-resolved PC-MRI slices were also obtained across the aorta above the coeliac trunk, superior
mesenteric vein, splenic vein and portal vein (PV). In the volunteer cohort there was a marked increase
in blood flow post-meal within the PV (p = 0.028), not seen in the patient cohort (p = 0.116). Similarly,
there were significant flow changes within the SMA of volunteers (p = 0.028) but not for the patient
group (p = 0.116). Our pilot data has shown that there is a significant haemodynamic response to
meal challenge in the PV and SMA in normal subjects compared to clinically apparent CMI patients.
Therefore, the interrogation of mesenteric venous vessels exclusively is a feasible method to measure
post-prandial flow changes in CMI patients.
Mesenteric ischaemia comprises a related group of disorders with a variety of aetiologies and natural histories1–4.
These disorders have not benefitted from anywhere near as much interest and research as other forms of cardio-
vascular disease, remain relatively poorly understood5 and usually have a poor prognosis6,7. Diagnosis can be
challenging and management strategies variable with patients frequently falling between specialties.
Chronic mesenteric ischaemia (CMI) is an important sub-type of mesenteric ischaemia the incidence of
which has been increasing in recent years8,9. CMI is almost invariably associated with atherosclerosis. Typically,
post-prandial abdominal pain due to induced relative ischaemia (‘mesenteric angina’) and weight loss from
food fear combined with a history of atherosclerotic disease in other territories points towards the diagnosis
although clinical presentations vary. On the other hand, patients presenting with abdominal pain may be found
to have mesenteric atherosclerosis on computed tomography (CT) prompting uncertainty over whether the
atherosclerosis is the causative pathology for the presentation or just a bystander phenomenon; this is because
the mesenteric circulation is highly collateralised such that arterial occlusions are commonly a symptomatic10–13.
As such, there is often diagnostic uncertainty when faced with a patient in whom CMI is part of the differential
diagnosis, in some cases of diagnostic doubt then invasive treatments such as angioplasty and stent may be offered
on a speculative basis, not ideal given the potential for the significant morbidity and even mortality associated
with such interventions. Therefore, techniques that are capable of reliably demonstrating both anatomic arte-
rial steno-occlusive disease and any consequent down-stream impairment of perfusion and ideally inducible
reversible ischaemia (analogous to the use of myocardial perfusion techniques for the coronary circulation) will
provide the best path to appropriate diagnosis and hence decisions about treatment. However, such techniques
are not yet in routine clinical use.
1
Clinical Physics, Queen Elizabeth University Hospital, NHS Greater Glasgow & Clyde, Glasgow G51 4TE,
UK. 2Academic Unit of Surgery, Glasgow Royal Infirmary, NHS Greater Glasgow & Clyde, Glasgow G51 4TE,
UK. 3Department of Radiology, NHS Greater Glasgow & Clyde & Institute of Cardiovascular and Medical Sciences,
Glasgow G51 4TE, UK. 4Department Vascular Surgery, University Hospital Hairmyres, East Kilbride G75 8RG,
UK. *email: pauline.hallbarrientos@glasgow.ac.uk
Scientific Reports | (2021) 11:5914 | https://doi.org/10.1038/s41598-021-85315-1 1
Vol.:(0123456789)
www.nature.com/scientificreports/
Assessing anatomy and inducible relative ischaemia. Duplex ultrasound of the mesenteric arter-
ies is a reasonable first line test in patients where there is a low but definite suspicion of CMI. In thin subjects,
Duplex can be an excellent test to evaluate arterial stenosis where the vessel is well visualised but there is much
interobserver variability as for many ultrasound vascular evaluations and often imaging is limited anatomically
to the superior mesenteric artery (SMA) alone. While an increase in velocities across a stenosis after meal chal-
lenge point to the diagnosis of true mesenteric angina the actual bulk flow rates are not evaluated and collateral
circulations are not assessed. Furthermore, to assess for haemodynamic change the imaging is very often com-
promised by bowel gas and peristaltic motion following meal challenge.
Computed tomography angiography (CTA) offers high-resolution 3-dimensional arteriography and an assess-
ment of the solid and hollow abdominal v iscera14–17. Vessel suitability for endovascular intervention or operability
may be assessed, as may any collateral circulation. However, the imaging is static and only offers a very rough
assessment of likely perfusion and potential for induced relative ischaemia. In the current absence of alternative
single-phase CTA is thought a reasonable test for most patients with suspected CMI.
Magnetic resonance imaging (MRI) and magnetic resonance angiography (MRA) also provide non-invasive
alternatives to conventional arteriography and CTA for patients with suspected CMI. Contrast-enhanced mag-
netic resonance angiography (CE-MRA) can clearly map arterial steno-occlusive disease and collateral pathways
similar to CTA, the lack of ionising radiation allows for multiphase and dynamic examinations without radiation
penalty allowing evaluation of arterial and venous structures and even providing qualitative flow information. A
potential further benefit of a MRI approach is that it is capable of delineating not only the vascular anatomy but
with the addition of flow sensitive techniques also the flow dynamics in a single test18. MRI is now readily avail-
able in vascular centres and has become the imaging modality of choice in the peripheral circulation supported by
evidence-based guidelines19,20. There have been previous studies in the 1 990s21–23 where mesenteric flow response
to meal challenge (in the superior mesenteric arteries and veins) was studied using 2D phase contrast imaging
(2D time-resolved PC-MRI), however, these studies had a limited number of patients and volunteers. A signifi-
cant limitation of the use of 2D PC-MRI that has impeded its clinical uptake is the need for accurate planning
of acquisition planes orthogonal to what can be small, tortuous and variably angled vessels. 4-dimensional flow
sequences have been developed, enabling haemodynamic measurement within a single volume of interest. This
potentially greatly simplifies the acquisition of flow data since a single relatively large volume encompassing all
vessels of interest can be simply placed without specific regard to individual vessel orientations etc. However, its
use in the investigation of GI responses to situations of demand, such as the post-prandial phase, in both healthy
patients and those with symptoms suggestive of chronic mesenteric ischaemia remains under-investigated.
Interrogating the portal vein (PV) and/or the superior mesenteric vein (SMV) is likely to be the optimal
method of quantifying mesenteric blood flow as in most situations, the entire circulation of the gut will pass
through this single large vessel. On the other hand, measuring and summing flow through multiple small, dis-
eased, tortuous and collateralised arteries is challenging even with a single acquired volume and unlikely to be
as reproducible. In addition, the PV is virtually never calcified and is rarely stented; both situations which can
lead to signal loss in MRI. In very heavily calcified arteriosclerotic disease there may be such dense calcification
that arterioliths are formed and the calcium density can create a local susceptibility artifact.
The aim of this prospective pilot study was to determine the feasibility of assessing the response of the
mesenteric vasculature to a meal stimulus using 3D time-resolved PC-MRI, also known as 4D flow, in both
healthy participants and patients with symptoms characteristic of CMI. This study was also designed to compare
haemodynamic assessment of the venous versus arterial mesenteric systems. 4D flow data were also compared
to established 2D time-resolved PC-MRI, known as 2D flow, techniques for validation.
Materials and methods
Subjects. A total of twelve participants were recruited, 6 patients and 6 healthy volunteers. The patients
(mean age 65 y, range 44–81 y, 2F), with characteristic CMI syndromes were identified with clinical consensus
from vascular multidisciplinary team meetings (MDTM) comprising consultant vascular surgeons and inter-
ventional radiologists, at the Queen Elizabeth University Hospital, Glasgow and University Hospital Hairmyres,
East Kilbride. Patients were recruited with clinically obvious CMI based on a combination of history and physi-
cal examination plus all their imaging features from standard investigations. Patients where there was any clini-
cal doubt as to the aetiology of their abdominal pain were not included in the study.
Healthy subjects (mean age 39 y, range 30–77 y, 4F) were recruited from the Glasgow Clinical Research Imag-
ing Facility (CRIF) volunteer bank. Inclusion criteria were volunteers over the age of 18 years with no known
mesenteric ischaemia symptoms or other gastrointestinal disorders, no clinical history of vascular disease and
no clinical signs of peripheral vascular disease. Subjects with arrhythmia or MR non-conditional implants and
devices were excluded.
Statement. This study was approved by the local ethics committee, Glasgow CRIF approval group, and writ-
ten informed consent was obtained from all participants. Research Ethics Committee West of Scotland REC3,
reference 16/WS/0220. All experiments and methods were performed in accordance to relevant guidelines and
regulations. We applied the following methods, meal challenge and MR imaging protocol and data analysis, from
Roldán-Alzate24 to measure flow changes in arterial and venous vessels post-prandial.
Meal challenge. For the baseline scan all participants were asked to fast for 6 h (no food, liquid or chewing
gum). After the initial scan subjects were asked to consume a standard meal, 400 mL of Ensure Plus (700 cal)
and were then scanned again 60 min post meal ingestion. 60 min was selected as this was quoted to be the peak
time of blood flow within the SMA post meal returns to baseline after 2–3 h, which coincides with CMI patients
Scientific Reports | (2021) 11:5914 | https://doi.org/10.1038/s41598-021-85315-1 2
Vol:.(1234567890)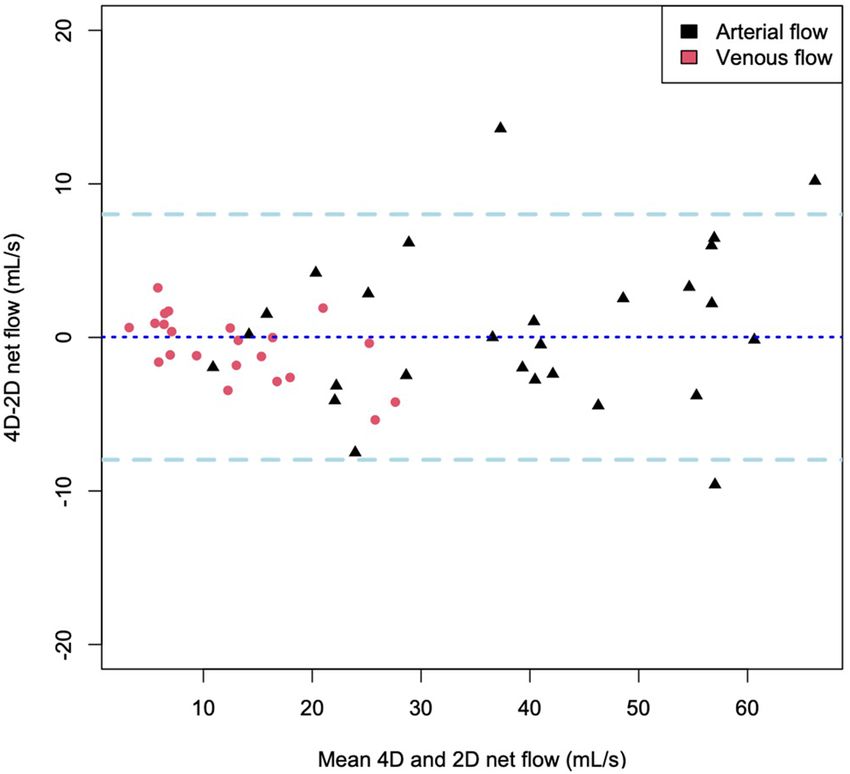
www.nature.com/scientificreports/
experiencing pain lasting 1–2 h after eating25,26. In addition it was felt that is was appropriate to scan post-
prandial at 60 min, unlike Roldán-Alzate, due to the fact that within 20 min post-prandial one cannot guarantee
that a significant flow response could be measured since the rate of change of blood flow can vary from person to
person27. All patients and volunteers, apart from two, were scanned between 9 to 10 a.m. to account for diurnal
changes. Due to logistics one patient and one volunteer were scanned at 2 p.m.
MR imaging. All scans were performed using a 3.0T Prisma MRI system (Siemens Healthineers) with an 18
channel body array coil. Both 4D flow and 2D flow data were acquired for each of the subjects.
Arterial and venous vessels were imaged using: True FISP fat saturated breath held, TR/TE 246/1.31 ms,
FoV 340 mm, resolution 1.3 × 1.3 mm, slice thickness 2.4 mm, flip angle 36°, TA 20 s in the transverse, sagittal
and trasnsverse planes. Additional images were acquired of the PV and SV vessels to facilitate perpendicular
planning of 2D flow slices across these vessels, since they were not easy to plan from the True FISP fat saturated
images. The following sequences were used True FISP single shot fat saturated breath held, orthogonal to the
vessel, FoV 400 mm, TR/TE 986/3.26 ms, acquired resolution 1.6 × 1.6 mm, slice thickness 4 mm, flip angle
TA 20 s. Followed by a breath held True FISP cine planned perpendicular to the middle of the imaged vessel,
FoV 340 mm, resolution 1.3 × 1.3 mm, slice thickness 7 mm, flip angle 44°, TA 4.7 s. The cine sequence would
confirm the pulsatile motion of the PV or SV vessel and was then used for the positioning of the 2D flow scans.
2D flow data were acquired, pre- and post-prandial, across the aorta at levels above the coeliac artery, above
(SMA was also visualised in this plane) and below the renal arteries, planned using HASTE images. The superior
mesenteric vein (SMV), splenic vein (SV) and portal vein (PV) were planned as described from the section above.
The 2D time resolved PC-MRI data were acquired with the following parameters: resolution 1.8 × 1.8, slice thick-
ness 6 mm, TR/TE 3.7–5.3/2.47–3.1 ms, with a scan time of 14 s (breath-hold) and 30 time frames between each
R-R interval. The velocity encoding value (Venc) was set at 50 cm/s for the veins and 150 cm/s for the arterial
planes with option to increase Venc if aliasing was apparent. The acquisitions used retrospective ECG gating.
The research 4D flow sequence (WIP 785A, the product is currently under development and is not for sale in
the US and in other countries. Its future availability cannot be ensured), from Siemens, acquired the data with
the following imaging parameters: imaging volume 288 × 288 × 72 mm, 1.8 mm acquired resolution, 1.8 mm slice
thickness, TR/TE = 4.8–5.9/ 2.25–3.19 ms, iPat 3, with a scan time of ~ 8 min and 20 time frames between each
R-R interval. The acquisition used retrospective ECG gating and navigators (placed over liver/diaphragm) for
respiratory gating, with an acceptance window of ± 8 mm. Two volumes of 4D flow data were acquired. First 4D
flow acquisition was for the SMA with the Venc set at 150 cm/s (pre- and post-meal) for volunteers and 200 cm/s
(pre-meal) and 220 cm/s (post-meal) for patients. A higher Venc setting was selected for patients to account for
potential jet flow distal to any SMA stenosis.
The second 4D flow acquisition was for the PV. 2D flow was acquired initially to help determine the Venc set-
tings for 4D flow of the PV. Therefore, for 4D flow the Venc was set at 30 cm/s (pre-meal) and 40 cm/s (post-meal)
for volunteers and 20 cm/s (pre-meal) and 30 cm/s (post-meal) for patients. A lower Venc setting was selected
for patients as it was found from 2D acquisitions that these patients typically had a lower peak velocity when
compared to the healthy volunteers. It was crucial that the Venc set for both arterial and venous flow matched
the real velocity within the vessel, if this was not done then the region of interest was acquired with a lower, less
optimal signal to noise ratio (SNR)28. However, it can be challenge to find a Venc setting that will image both
slow and high velocities through and distal to the SMA stenosis, therefore a higher Venc was selected to measure
the jet flow distal to the stenosis. Venc of 220 cm/s was able to visualise this sufficiently.
The order of the flow sequences was as follows for all patients and volunteers post-meal:
Localisers and anatomical images
PV 2D cine PC MRI
PV 3D cine PC MRI
SMA 3D cine PC MRI (during this SV, SMV, arterial flow measurements were planned)
Remaining arterial and venous 2D cine PC MRI
Post-flow PV 2D and 3D cine PC were acquired ~ 60 min after the patient had finished their meal. Therefore
SMA flow measurements were acquired ~ 70 min post meal.
2D and 4D flow MRI data analysis. 2D time-resolved PC-MRI data were analysed using Argus Flow
software (Siemens Healthcare GmbH, Erlangen, Germany). Anatomical, magnitude and phase images were
imported into Argus Flow and background phase and phase anti-aliasing (10% of highest Venc) corrections
were applied. A region of interest was selected over the visible lumen. The software then calculated the following
waveforms and indices: area, flow, mean velocity and peak velocity.
4D flow images were processed using Siemens prototype software (Flow version 2.4, Flow version 2.4, Siemens
Healthcare GmbH, Erlangen, Germany). Data sets were uploaded to the software and corrections were applied
onto the data set. These included: phase anti-aliasing, background phase correction, and motion tracking.
Vessels were segmented using a centreline model. The vessels identified from the two data sets, for both pre-
and post-meal, were the visceral aortic segment and the portal venous system, as shown in Figs. 1 and 2. Analysis
planes were selected manually and placed in the following regions for each patient and volunteer:
1. Aorta above coeliac trunk (AoC)
2. SMA (for patients then beyond any stenosis)
Scientific Reports | (2021) 11:5914 | https://doi.org/10.1038/s41598-021-85315-1 3
Vol.:(0123456789)www.nature.com/scientificreports/
Figure 1. Segmentation of arterial vessels with planes of analysis annotated.
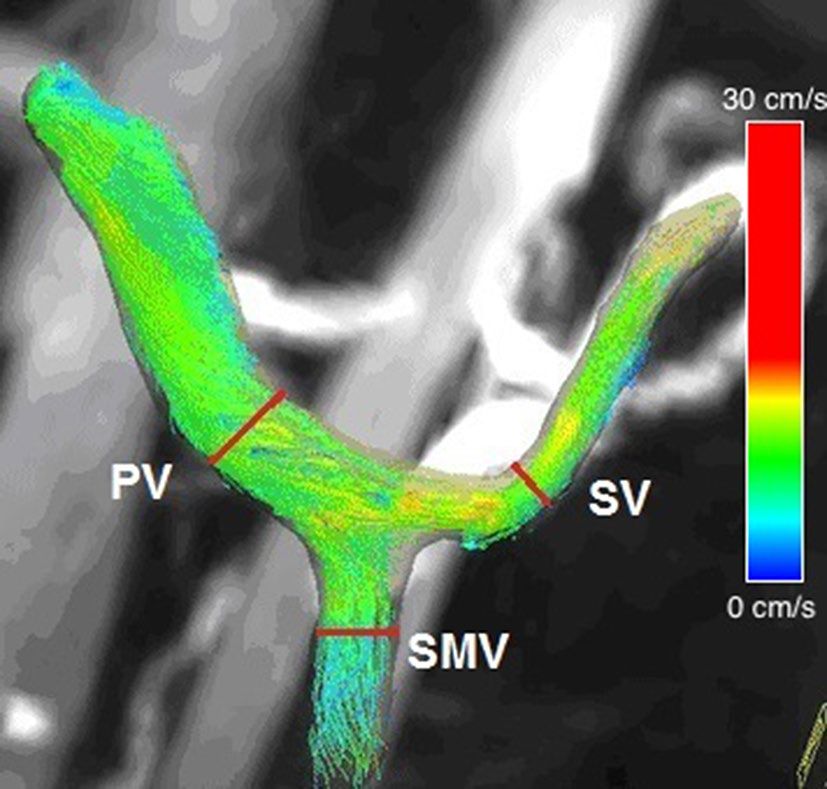
Figure 2. Segmentation of venous vessels with planes of analysis annotated.
3. Coeliac artery (CA)
4. PV (~ 1 cm distal to the confluence)
5. SV
6. SMV
For each of the planes selected quantitative parameters were automatically generated by the Siemens software.
These parameters were a time integrated flow evaluation which included maximum peak velocity magnitude,
temporal average net flow, temporal average net forward volume within the contour over time. The software
also generated 3D streamlines within the segmented vessels as shown in Fig. 1. The total time for the data to be
processed was ~ 15 min. 4D flow slices were matched to the 2D slices. This was done by identifying the x, y and z
patient coordinates of the centre of 2D flow vessel using Osirix Lite. Several analysis planes were then prescribed
across the vessels in the 4D flow software. The coordinates of these 4D planes were then matched to the 2D.
Unfortunately, the coordinates of the 4D slices are only known after the results are exported, if the coordinates
did not match further analysis planes were added in the 4D flow software. The inter-operator variability was
tested using Bland–Altman analysis for both 2D and 4D. A total of 2 appraisers and 36 vessels from 6 data sets
were used. The average flow through the vessel of the PV, SMV, SV, AoC, SMA were measured.
Scientific Reports | (2021) 11:5914 | https://doi.org/10.1038/s41598-021-85315-1 4
Vol:.(1234567890)www.nature.com/scientificreports/
Figure 3. Average net flow through the PV for volunteers (left) and patients (right). Error bars indicate the
standard deviation. Plot created using R.
Figure 4. Bland–Altman results of 2D and 4D average flow for all analysis planes. Plot created using R.
For internal consistency of flow measurements, the conservation of mass was tested for each subject at the
portal confluence, this was determined for both pre- and post-prandial separately. This was done by measuring
the flow in the PV, SV and SMV such that:
QPV = QSV + QSMV (1)
where QPV, QSV and QSMV is flow in the PV, SV and SMV respectively.
Statistics. Flow values between 2 and 4D flow and changes between pre- and post-meal were studied using
Wilcoxon signed rank test (2-tailed). The statistics package IBM SPSS Statistics for Windows, version 24 (IBM
Corp., Armonk, N.Y., USA). Figures 3 and 4 were created using R (R Core team 2017), using package ggplot 2.
Scientific Reports | (2021) 11:5914 | https://doi.org/10.1038/s41598-021-85315-1 5
Vol.:(0123456789)www.nature.com/scientificreports/
Average net flow (mL/s) PV SMV SV AoC SMA CA
Pre-meal 13.4 ± 3.9 6.1 ± 1.5 7.1 ± 1.5 49.1 ± 8.5 5.8 ± 1.5 12.2 ± 3.3
Post-meal 19.5 ± 4.7 11.3 ± 3.2 7.6 ± 1.2 60.2 ± 13.0 11.0 ± 2.9 10.0 ± 2.9
P value 0.028 0.046 0.917 0.043 0.028 0.173
Table 1. Average flow results in volunteer cohort. PV portal vein, SV splenic vein, SMV superior mesenteric
vein, AoC aorta at coeliac artery, SMA superior mesenteric artery, CA coeliac artery.
Average net flow (mL/s) PV SMV SV (n = 5) AoC SMA
Pre-meal 10.2 ± 2.1 5.7 ± 1.7 5.7 ± 1.5 44.9 ± 12.1 5.3 ± 1.5
Post-meal 11.5 ± 1.6 6.2 ± 1.8 5.4 ± 1.4 48.4 ± 10.9 7.8 ± 2.2
P value 0.116 0.075 0.5 0.173 0.116
Table 2. Average flow results in patient cohort. PV portal vein, SV splenic vein, SMV superior mesenteric
vein, AoC aorta at coeliac artery, SMA superior mesenteric artery.
Results
Volunteers. In the 6 volunteers, the mean fasted average net flow rate in the portal vein was 13.4 ± 3.9 mL/s.
There was a significant increase in flow observed after the standardised meal increasing to 19.5 ± 4.7 mL/s
p = 0.028 (Fig. 3). This was predominantly due to flow in the SMV which was increased (p = 0.046) whereas flow
in the SV and CA was not significantly different (p = 0.917, p = 0.173 respectively).
The mean fasted average net flow rate in the SMA was 5.8 ± 1.5 mL/s. There was a significant increase in
flow observed after the standardised meal to 11.0 ± 2.9 mL/s (p = 0.028). In the AoC there was also a significant
increase (p = 0.043). Table 1 details the full results for the volunteers.
Patients. For the 6 patients the mean fasting average net flow rate in the portal vein was 10.2 ± 2.1 mL/s. After
the standardised meal there was not a statistically significant increase in flow in the portal vein: 11.5 ± 1.6 mL/s
(p = 0.116) (Fig. 3). Flow in the SMV and SV did not significantly change, p = 0.075 and p = 0.5 respectively.
The mean fasted average net flow rate in the SMA was 5.3 ± 1.5 mL/s. An increase in flow after the standardised
meal was apparent 7.8 ± 2.2 mL/s (p = 0.116), but this was not statistically significant for this small number of
patients. Similarly, there was an apparent increase in flow at the supra-coeliac aorta but this also did not reach
statistical significance (p = 0.173). Table 2 details the full results for the patient cohort. In one case the SV could
not be identified due to insufficient velocity sensitivity. In only four patients was the CA clearly identified and in
the other two this vessel was stenosed. These results were not included in the final analysis.
2D vs. 4D flow. Figure 4 demonstrates the Bland–Altman results for 4D flow compared to 2D flow for
all analysis planes. There is a good agreement between 4 and 2D net flow measurements with a mean bias of
0.02 ± 8.16 mL/s (p = 0.633).
Interobserver variability. For both 2D and 4D methods the overall the inter-observer variability was
good, mean bias 0.07 ± 3.40 mL/s (p = 0.816) and mean bias − 0.72 ± 6.27 mL/s (p = 0.195) respectively.
Quality control. For all subjects we found that the conservation of flow within the portal vein was met within
reasonable limits. The average flow difference between QSV-QSMV and QPV for volunteers was 0.2 ± 1.7 mL/s
(percentage difference 0.6 ± 13%) and 0.5 mL/s (percentage difference 1.6 ± 7.9%) for pre- and post-prandial
respectively. For patients the average flow difference was 2.1 ± 4 mL/s percentage difference 3 ± 13%) and
2.2 ± 3.4 mL/s (percentage difference 8 ± 8%) for pre- and post-prandial respectively.
Discussion
This pilot study measured the haemodynamic response in both the venous and arterial vasculature of 6 patients
with clinically apparent CMI and 6 healthy volunteers. Baseline and post-prandial flow changes in both the
PV and SMA have been quantified. Our data demonstrate that there is a significant measurable hemodynamic
response to a standard meal challenge within the PV, SMV and SMA in healthy volunteers whereas in the patient
cohort this normal physiological response was completely attenuated.
Although there are no previous studies using 4D flow on CMI patients there has been research in PV flow
changes, post-prandial, in the setting of patients with portal hypertension and healthy volunteers by Roldán-
Alzate et al.26. This group showed significant flow changes in the PV in healthy volunteers and minimal flow
changes in their patients with portal hypertension. However, their measurements of post-prandial flow were
taken 20 min post ingestion. We have demonstrated that these blood flow changes can be detected 60 min
after eating a meal. However, this does not justify that for a larger study one should use 60 min to study blood
flow changes post meal. Unfortunately, there is conflicting guidance of timings to detect changes and a lack
Scientific Reports | (2021) 11:5914 | https://doi.org/10.1038/s41598-021-85315-1 6
Vol:.(1234567890)www.nature.com/scientificreports/
of research in this area27,29. Therefore, we recognise that we need to have a larger in-depth study of blood flow
changes post-prandial over a period of time. For example, measure blood flow over a period of 90 min, every
15 min, for different age groups.
Our pilot study, for both volunteers and patients, were not aged matched limiting our knowledge of ‘normal’
flow responses across different age groups. Nor we have not accounted for severity of disease progression as we
had identified patients as having a stenosis present. Therefore, it is pertinent to determine the optimal time for
mesenteric blood flow changes in not only older patients but to account for varying degrees of vessel disease,
number of stenoses, presence of collateral pathways and symptomatic pain. This pilot study did not investigate
wall shear stress of both arterial and venous vessels for both patients and volunteers, since the sequences were
optimised for blood flow. A study of wall shear stress could also be investigated, as it is well known that elasticity
will change with age which could also influence blood flow r esponses30.
Another limitation of our study was the direct comparison of flow scans and its timings. We ensured that our
PV flow were prioritised, 2D and 3D cine PC, and measurements were acquired 60 min post-prandial. How-
ever, because of this it pushed the arterial measurements beyond this time point. Because of this we may not
capture a significant blood flow change in these vessels for both patients and volunteers. However, flow changes
in the SMA flow changes were measured ~ 70 min in volunteers, which indicates one can could still detect flow
changes > 60 min. To confirm this a blood flow study, as mentioned, would be needed.
Similar to Roldán-Alzate’s study we also found the portal vein interrogation to be reliable and reproduc-
ible and conservation of flow into the portal vein from the major tributaries was demonstrated. We also did
not observe any temporal order changes in 4D flow acquisition post-prandial. Therefore, in future studies, we
contend that only PV 4D flow data need be acquired. This will reduce scanning time and improve acceptability
for the patient. A separate MR arteriogram can be obtained with or without contrast before or after the flow
study for anatomy and intervention planning. As discussed in the introduction, portal vein flow is an acceptable
parameter of overall mesenteric flow being a single, large easily identified vessel with the additional advantage of
being (almost always) free from stents, calcification and stenosis meaning the resulting data will not be subject
to artefacts due to metalwork or jet velocities.
The pilot study also validated the results of 4D flow using 2D flow showing agreement between 4 and 2D
measurements. However, there are several outliers, in particular with a net flow > 40 mL/S. This was because 4D
flow planes did not match the selected 2D slices, measurements above the coeliac artery and below the renal
vessels were the main issues. This was because a few of the 2D slices were acquired out with the 4D volume. This
highlights the main limitation of 2D flow-data analysis is limited to one position and it cannot changed post-
hoc. 2D flow acquisition is time-consuming with slice planning being challenging and prone to inter-operator
variability. We found on average (including planning and repeat scanning if required) to acquire 6 2D flow
measurements took an average of 20 min. We found that scans are often repeated, in both planning and flow
imaging, due to poor breath holding by the patient/volunteer or due to the challenging nature of planning small
vessels. In particular, MRI technical staff found it difficult to identify and carefully plan slices across the vessels
for patients with little visceral fat, this is readily overcome by volumetric 4D flow acquisitions. However, 2D flow
was useful in this pilot study to determine the optimal Venc setting for 4D flow, if Venc setting was > 10% than
the peak velocity the acquired 4D flow data was subjected to a lower SNR (particularly noticeable in subjects
with increased subcutaneous and/or visceral fat.). However, from this study we can determine the optimal Venc
for future PV studies, 30 cm/s or pre- and 40 cm/s for post-prandial, for both patients and volunteers. Therefore,
for larger studies one would no longer require 2D flow and its additional anatomical images, giving the freedom
to interrogate the whole PV rather than one 2D slice, which cannot be fully guaranteed to be reproducible in
other patients. Currently the main disadvantage is the acquisition time for 4D flow acquisitions are quite long, on
average 8 min. Hopefully accelerated sequences such as kt-acceleration, non-Cartesian under sampling (radial,
spiral) and compressed sensing will overcome this limitation31,32. A further limitation is that if arterial data is
desired then a second 4D flow acquisition is currently required as we did in this pilot study, in the future dual-
Venc 4D flow sequences may obviate this limitation also although we contend that subject to further validation
PV flow alone should suffice for diagnosis or refutation of suspected C MI33.
Conclusion
We acknowledge that this pilot study was necessarily small and that a larger aged matched controlled cohort
study and taking into account the presence of diseased vessels will be required to further validate our findings. In
addition, a scan-scan repeatability study would need to be undertaken to determine the precision and reliability
of 4D flow for the mesenteric vasculature. This study will provide the justification for this technology assessment.
This work has shown MRI 4D flow holds promise in patients suspected of CMI and is a feasible alternative to
the combination of CTA and Duplex ultrasound in providing both anatomic and functional data from a single
scan without the limitations inherent in the current conventional techniques.
Received: 22 April 2020; Accepted: 12 February 2021
References
1. Oldenburg, W. A., Lau, L. L., Rodenberg, T. J., Edmonds, H. J. & Burger, C. D. Acute mesenteric ischemia: A clinical review. Arch.
Intern. Med. 24(164), 1054–1062 (2004).
2. Yasuhara, H. Acute mesenteric ischemia: The challenge of gastroenterology. Surg. Today. 35, 185–195 (2005).
3. Reginelli, A. et al. Mesenteric ischemia: The importance of differential diagnosis for the surgeon. BMC Surg. 13, S51 (2013).
4. van den Heijkant, T. C., Aerts, B. A., Teijink, J. A., Buurman, W. A. & Luyer, M. D. Challenges in diagnosing mesenteric ischemia.
World J. Gastroenterol. 19, 1338 (2013).
Scientific Reports | (2021) 11:5914 | https://doi.org/10.1038/s41598-021-85315-1 7
Vol.:(0123456789)www.nature.com/scientificreports/
5. Kolkman, J. J. & Geelkerken, R. H. Diagnosis and treatment of chronic mesenteric ischemia: An update. Best Pract. Res. Clin.
Gastroenterol. 31, 49–57 (2017).
6. Boley, S. J., Feinstein, F. R., Sammartano, R., Brandt, L. J. & Sprayregen, S. New concepts in the management of emboli of the
superior mesenteric artery. Surg. Gynecol. Obstet. 153, 561–569 (1981).
7. Sise, M. J. Acute mesenteric ischemia. Surg. Clin. North Am. 94, 165–181 (2014).
8. Zettervall, S. L. et al. Trends in treatment and mortality for mesenteric ischemia in the United States from 2000 to 2012. Ann. Vasc.
Surg. 42, 111–119 (2017).
9. Wilson, D. B. et al. Clinical course of mesenteric artery stenosis in elderly Americans. Arch. Intern. Med. 166, 2095–2100 (2006).
10. Clair, D. G. & Beach, J. M. Mesenteric ischemia. N. Engl. J. Med. 374, 959–968 (2016).
11. Pecoraro, F. et al. Chronic mesenteric ischemia: Critical review and guidelines for management. Ann. Vasc. Surg. 27, 113–122
(2013).
12. Edwards, M. S. et al. Acute occlusive mesenteric ischemia: Surgical management and outcomes. Ann. Vasc. Surg. 17, 72–79 (2003).
13. Trompeter, M., Brazda, T., Remy, C. T., Vestring, T. & Reimer, P. Non-occlusive mesenteric ischemia: Etiology, diagnosis, and
interventional therapy. Eur. Radiol. 12, 1179–1187 (2002).
14. Ha, H. K., Rha, S. E., Kim, A. Y. & Auh, Y. H. CT and MR diagnoses of intestinal ischemia. Semin. Ultrasound CT. 21, 40–55 (2000).
15. Laméris, W. et al. Imaging strategies for detection of urgent conditions in patients with acute abdominal pain: Diagnostic accuracy
study. BMJ 26, b2431 (2009).
16. Herbert, G. S. & Steele, S. R. Acute and chronic mesenteric ischemia. Surg. Clin. North Am. 87, 1115–1134 (2007).
17. Aschoff, A. J. et al. Evaluation of acute mesenteric ischemia: Accuracy of biphasic mesenteric multi-detector CT angiography.
Abdom. Imaging. 34, 345–357 (2009).
18. Shirkhoda, A. et al. Contrast-enhanced MR angiography of the mesenteric circulation: A pictorial essay. Radiographics 18, 851–861
(1998).
19. National Institute for Health and Care Excellence. National Institute for Health and Care Excellence, Peripheral arterial disease:
diagnosis and management, London. Reprint at https://www.nice.org.uk/guidance/cg147 (2012)
20. Scottish Intercollegiate Guidelines Network. Scottish Intercollegiate Guidelines Network, Diagnosis and management of peripheral
arterial disease, Edinburgh. Reprint at https://www.sign.ac.uk/archived-guidelines.html (2006)
21. Burkart, D. J., Johnson, C. D., Reading, C. C. & Ehman, R. L. MR measurements of mesenteric venous flow: Prospective evaluation
in healthy volunteers and patients with suspected chronic mesenteric ischemia. Radiology 194, 801–806 (1995).
22. Li, K. C. et al. Chronic mesenteric ischemia: Evaluation with phase-contrast cine MR imaging. Radiology 190, 175–179 (1994).
23. Chow, L. C., Chan, F. P. & Li, K. C. P. A comprehensive approach to MR imaging of mesenteric ischemia. Abdom. Imaging 27, 507
(2002).
24. Roldán-Alzate, A. et al. Impaired regulation of portal venous flow in response to a meal challenge as quantified by 4D flow MRI.
J. Magn. 42, 1009–1017 (2015).
25. Ascher, E. Haimovici’s Vascular Surgery 22–23 (Wiley, 2012).
26. Becquemin, J. P. Management of the diseases of mesenteric arteries and veins: Clinical practice guidelines of the European Society
for Vascular Surgery (ESVS). Eur. J. Vasc. Endovasc. 53, 455–457 (2017).
27. Someya, N., Endo, M. Y., Fukuba, Y. & Hayashi, N. Blood flow responses in celiac and superior mesenteric arteries in the initial
phase of digestion. Am. J. Physio-Reg. 294, R1790–R1796 (2008).
28. Lotz, J., Meier, C., Leppert, A. & Galanski, M. Cardiovascular flow measurement with phase-contrast MR imaging: Basic facts and
implementation. Radiographics 22, 651–671 (2002).
29. Cox, E. F., Palaniyappan, N., Aithal, G. P., Guha, I. N. & Francis, S. T. MRI assessment of altered dynamic changes in liver haemo-
dynamics following a meal challenge in compensated cirrhosis. Eur. Radiol. Exp. 2, 26 (2018).
30. Secomb, T. W. Theoretical models for regulation of blood flow. Microcirculation 15, 765–775 (2008).
31. Bollache, E. et al. k-t accelerated aortic 4D flow MRI in under two minutes: Feasibility and impact of resolution, k-space sampling
patterns, and respiratory navigator gating on hemodynamic measurements. Mag. Reson. Med. 79, 195–207 (2018).
32. Peper, E. S. et al. Highly accelerated 4D flow cardiovascular magnetic resonance using a pseudo-spiral Cartesian acquisition and
compressed sensing reconstruction for carotid flow and wall shear stress. J. Cardiovasc. Magn. Reson. 22, 1–15 (2020).
33. Callaghan, F. M. et al. Use of multi-velocity encoding 4D flow MRI to improve quantification of flow patterns in the aorta. J. Magn.
Reson. Imaging 43, 352–363 (2016).
Acknowledgements
We would like to acknowledge the MRI radiographic staff from the CRIF at the Queen Elizabeth University
Hospital in Glasgow. We would like to acknowledge WIP developer Ning Jin Ph.D.
Author contributions
P.H.B. data analysis and main author, created images 1, 2, 3, 4. D.B. data analysis. K.K., A.V. co-author. G.R co-
author and study conception.
Competing interests
The authors declare no competing interests.
Additional information
Correspondence and requests for materials should be addressed to P.H.B.
Reprints and permissions information is available at www.nature.com/reprints.
Publisher’s note Springer Nature remains neutral with regard to jurisdictional claims in published maps and
institutional affiliations.
Scientific Reports | (2021) 11:5914 | https://doi.org/10.1038/s41598-021-85315-1 8
Vol:.(1234567890)www.nature.com/scientificreports/
Open Access This article is licensed under a Creative Commons Attribution 4.0 International
License, which permits use, sharing, adaptation, distribution and reproduction in any medium or
format, as long as you give appropriate credit to the original author(s) and the source, provide a link to the
Creative Commons licence, and indicate if changes were made. The images or other third party material in this
article are included in the article’s Creative Commons licence, unless indicated otherwise in a credit line to the
material. If material is not included in the article’s Creative Commons licence and your intended use is not
permitted by statutory regulation or exceeds the permitted use, you will need to obtain permission directly from
the copyright holder. To view a copy of this licence, visit http://creativecommons.org/licenses/by/4.0/.
© The Author(s) 2021
Scientific Reports | (2021) 11:5914 | https://doi.org/10.1038/s41598-021-85315-1 9
Vol.:(0123456789)You can also read