Cost saving analysis of specialized, eHealth based management of patients receiving oral anticoagulation therapy: Results from the thrombEVAL ...
←
→
Page content transcription
If your browser does not render page correctly, please read the page content below
www.nature.com/scientificreports

                OPEN              Cost saving analysis of specialized,
                                  eHealth‑based management
                                  of patients receiving oral
                                  anticoagulation therapy: Results
                                  from the thrombEVAL study
                                  Lisa Eggebrecht1,2,11, Paul Ludolph1,3,11, Sebastian Göbel4,5, Marina Panova‑Noeva2,5,
                                  Natalie Arnold1, Markus Nagler1,2, Christoph Bickel6, Michael Lauterbach7, Roland Hardt8,
                                  Hugo ten Cate2,9, Karl J. Lackner5,10, Christine Espinola‑Klein4, Thomas Münzel2,4,5,
                                  Jürgen H. Prochaska1,2,5,11 & Philipp S. Wild1,2,5,11*

                                  To evaluate the cost-saving of a specialized, eHealth-based management service (CS) in comparison
                                  to regular medical care (RMC) for the management of patients receiving oral anticoagulation (OAC)
                                  therapy. Costs of hospitalization were derived via diagnosis-related groups which comprise diagnoses
                                  (ICD-10) and operation and procedure classification system (OPS), which resulted in OAC-related
                                  (i.e. bleeding/ thromboembolic events) and non-OAC-related costs for both cohorts. Cost for
                                  anticoagulation management comprised INR-testing, personnel, and technical support. In total, 705
                                  patients were managed by CS and 1490 patients received RMC. The number of hospital stays was
                                  significantly lower in the CS cohort compared to RMC (CS: 23.4/100 py; RMC: 68.7/100 py); with the
                                  most pronounced difference in OAC-related admissions (CS: 2.8/100 py; RMC: 13.3/100 py). Total costs
                                  for anticoagulation management amounted to 101 EUR/py in RMC and 311 EUR/py in CS, whereas
                                  hospitalization costs were 3261 [IQR 2857–3689] EUR/py in RMC and 683 [504–874] EUR/py in CS. This
                                  resulted in an overall cost saving 2368 EUR/py favoring the CS. The lower frequency of adverse events
                                  in anticoagulated patients managed by the telemedicine-based CS compared to RMC translated into a
                                  substantial cost-saving, despite higher costs for the specialized management of patients.
                                  Trial registration: ClinicalTrials.gov, unique identifier NCT01809015, March 8, 2013.

                                  Abbreviations
                                  CS	Coagulation service
                                  DOAC	Direct acting anticoagulants
                                  DRG	Diagnosis-related group
                                  INR	International normalised ratio

                                  1
                                   Preventive Cardiology and Preventive Medicine, Center for Cardiology, University Medical Center of
                                  the Johannes Gutenberg University Mainz, Langenbeckstraße 1, Mainz 55131, Germany. 2Center for
                                  Thrombosis and Hemostasis, University Medical Center of the Johannes Gutenberg-University Mainz, Mainz,
                                  Germany. 3Department of Psychiatry and Psychotherapy, University Medical Center of the Johannes Gutenberg
                                  University Mainz, Mainz, Germany. 4Center for Cardiology – Cardiology I, University Medical Center of the
                                  Johannes Gutenberg-University Mainz, Mainz, Germany. 5German Center for Cardiovascular Research (DZHK),
                                  Partner Site Rhine Main, Mainz, Germany. 6Department of Medicine I, Federal Armed Forces Central Hospital
                                  Koblenz, Koblenz, Germany. 7Department of Medicine 3, Barmherzige Brüder Hospital, Trier, Germany. 8Center for
                                  General Medicine and Geriatric Medicine, University Medical Center Mainz, Johannes Gutenberg University-Mainz,
                                  Mainz, Germany. 9CARIM/ Department of Vascular Medicine, Heart and Vascular Center, University Medical Center
                                  Maastricht, Maastricht, The Netherlands. 10Institute of Clinical Chemistry and Laboratory Medicine, University
                                  Medical Center of the Johannes Gutenberg University Mainz, Mainz, Germany. 11These authors contributed
                                  equally: Lisa Eggebrecht, Paul Ludolph, Jürgen H. Prochaska and Philipp S. Wild. *email: philipp.wild@
                                  unimedizin‑mainz.de

Scientific Reports |   (2021) 11:2577                | https://doi.org/10.1038/s41598-021-82076-9                                             1

                                                                                                                                          Vol.:(0123456789)
www.nature.com/scientificreports/
Regular medical care (n = 1490) Coagulation service (n = 705) P value
Age [years] 73.0 (65.0/79.0) 73.0 (63.0/80.0) 0.69
Male sex—% (n) 63.8% (951) 51.8% (365) < 0.0001
Arterial hypertension 78.8 (1174) 75.7 (534) 0.11
Atrial fibrillation 73.6 (1088) 64.3 (453) < 0.0001
Chronic kidney disease 23.4 (346) 15.9 (112) < 0.0001
Chronic lung disease 22.1 (326) 16.0 (112) 0.00073
Congestive heart failure 43.0 (628) 30.2 (211) < 0.0001
Diabetes 30.8 (459) 26.8 (187) 0.056
Dyslipidemia 55.2 (821) 43.1 (304) < 0.0001
Family history of MI/Stroke 41.3 (615) 30.6 (216) < 0.0001
History of bleeding 32.5 (459) 16.2 (114) < 0.0001
History of myocardial infarct ion 22.1 (327) 11.7 (82) < 0.0001
History of Stroke/ TIA 17.5 (260) 17.7 (125) 0.90
History of venous thromboembolism 23.3 (345) 33.4 (235) < 0.0001
Obesity 29.7 (442) 32.5 (229) 0.20
Peripheral artery disease 23.9 (347) 11.4 (80) < 0.0001
Smoking (current) 7.7 (115) 5.2 (37) 0.038
Tumor disease 17.8 (261) 18.9 (131) 0.51
CHA2DS2Vasc scorea 4.13 (1.76) 3.99 (1.75) 0.087
Charlson Comorbidity Index 5.92 (2.34) 5.31 (2.39) < 0.0001
HAS-BLED scorea 2.87 (2.34) 2.61 (1.31) < 0.0001
Table 1. Baseline characteristics of study participants according to healthcare model. Data are expressed as
the relative and absolute frequency for binary variables; all information is displayed for baseline frequency.
a
Calculated for patients with atrial fibrillation only.
IQR Interquartile range
OAC Oral anticoagulation
OPS Operation and procedure key codes
py Patient-years
RMC Regular medical care
TTR Time in therapeutic range
VKA Vitamin K antagonists
Oral anticoagulation (OAC) therapy is effective at preventing stroke and systemic embolism in patients with
atrial fibrillation or venous thrombosis, and reduces morbidity and mortality in individuals with established
thromboembolic disease1. Vitamin K antagonists (VKA) and direct acting anticoagulants (DOAC) are currently
the most commonly used anticoagulant drugs, of which both require a deliberate management of therapy (e.g.
due to comorbidities such as renal failure or heart failure). Although DOAC offer similar (or better) effectiveness,
safety, and convenience to V KA2–5, there is still a substantial amount of patients receiving V
KA6,7.
Treatment with VKA merits special attention: Interactions of VKA with co-medication, food or certain phar-
macogenomics variations (e.g. VKORC1, CYP2C9, CYP4F2) can lead to fluctuations of the international normal-
ised ratio (INR)8, and subsequently increase the risk of bleeding and other clinically relevant complications9,10.
Hence, effective and safe management of VKA treatment requires a regularly and intensive observation of patients
by their physician. However, inadequate treatment of many patients implies the need for optimizing the manage-
ment of oral a nticoagulation11, and formally structured anticoagulation services providing specialized care have
been shown to improve the clinical outcome of patients when compared to usual medical care12,13.
So far, a limited number of studies have evaluated the economic impact of an anticoagulation service. Besides
the low generalizability of results due to difference in social aspects and healthcare systems from country to
country, most studies lack accurate data assessment of operational cost and medical c laims14–16. All studies stated
a reduced health care expenditure of multi-disciplinary anticoagulation services compared with usual c are14–19.
However, no data is available on the cost-saving of a specialized, eHealth-based management system.
Especially against the background of the availability of (still) cost-intensive alternatives to VKA, it is of great
interest to evaluate cost-efficiency of a specialized, eHealth-based management system compared with usual
medical care investigating real world outcome in patients receiving VKA, which is supportive for making public
health decisions.
Results
Baseline characteristics of study sample. Patient characteristics of both cohorts are displayed in
Table 1. In total, 705 patients were managed by CS (median age: 73.0 years [IQR 63.0/80.0]; 52% male) and 1490
patients received RMC (median age: 73.0 years [IQR 65.0/79.0]; 64% male) with 465 and 1185 patient-years (py),
respectively. Individuals in RMC exhibited a worse clinical profile than patients managed by CS. Overall, reasons
Scientific Reports | (2021) 11:2577 | https://doi.org/10.1038/s41598-021-82076-9 2
Vol:.(1234567890)www.nature.com/scientificreports/
Regular medical care Coagulation service P value
Main diagnosis according to International Classification of Diseases (ICD)—% (n)
Angina pectoris (I20) 2.6 (21) 6.4 (7) 0.057
Atherosclerosis (I70) 3.7 (30) 0.0 (0) 0.08
Atrial fibrillation and flutter (I48) 12.0 (98) 11.9 (13) 1.00
Chronic ischemic heart disease (I25) 2.9 (24) 2.8 (3) 1.00
Heart failure (I50) 11.8 (96) 10.1 (11) 0.72
Pneumonia, unspecified organism (J18) 2.5 (20) 4.6 (5) 0.33
Operation and procedure codes (OPS)—% (n)*
Computer-assisted image data analysis with 3D-Evaluation (3-990) 9.7 (79) 10.1 (11) 0.74
Radio-controlled cardiac telemetry (8-933) 7.9 (64) 11.0 (12) 0.19
Transesophageal echocardiography (3-052) 12.0 (98) 7.3 (8) 0.38
Transfusion of whole blood, concentrated red cells and platelet concentrates
13.4 (109) 8.3 (9) 0.36
(8-800)
Unenhanced CT scan of the skull (3-200) 8.3 (68) 13.8 (15) 0.039
Diagnosis-related groups (DRG)—% (n)
Cardiac arrhythmia and conduction disturbances (F71B) 4.4 (36) 3.7 (4) 0.91
Heart failure and cardiogenic shock (F62B) 8.6 (70) 5.5 (6) 0.36
Invasive cardiological diagnostic , excluding myocardial infarction (F49G) 1.5 (12) 2.8 (3) 0.56
Syncope and collapse (F73Z) 1.8 (15) 1.8 (2) 1.00
Techniques for ventricular tachycardia catheter ablation, complex (F50A) 2.9 (24) 0.0 (0) 0.13
Techniques for ventricular tachycardia catheter ablation, non-complex (F50B) 2.9 (24) 5.5 (6) 0.26
Unstable angina pectoris without severe complications (F72B) 1.1 (9) 5.5 (6) 0.0026
Table 2. Event classifications according to healthcare model. Operation and procedure codes (OPS) are
presented according to the German procedure classification; five most common ICD, OPS and DRGs of each
cohort are presented. The shown percentages are based on the number of events in each cohort. *Multiple
designations are possible for one hospitalisation (i.e. there can be multiple OPS per event. The percentages for
OPS are based on number of procedures per total events).
for hospital admission did not relevantly differ between groups (Table 2): most frequent reasons for hospital
admission were atrial fibrillation/flutter (12% for both cohorts) and heart failure (11.8% for RMC; 10.1% for CS).
Cost for anticoagulation management. Management costs stratified by treatment group are shown
in Table 3. According to the statutory scale of fees for physicians20, INR measurements in the RMC were stated
as 4.70 EUR per test. Taking into account the number of tests per year (N = 21.5) resulted in total management
costs of 101 EUR per py in the RMC cohort. In the CS, combining the hourly wage of staff and time per patient
contact resulted in medical specialists and nursing time of 4.58 EUR and 6.31 EUR per test, respectively. Costs
for dispatch of dosage recommendation and technology were estimated to be 2.07 EUR. Total management cost
amounted to 311 EUR per (person-years) py in the CS cohort. Overall, total management costs were by 210 EUR
per py lower in RMC compared to CS treatment.
Hospital admissions, costs and savings. Overall, the number of hospital stays was significantly lower
in the CS cohort compared to RMC (CS: 23.4 admissions per 100 py; RMC: 68.7 admissions per 100 py; Table 3).
Complications of anticoagulation accompanied with a hospital stay occurred 158 and 13-times leading to 2.8
and 13.3 admissions per 100 py of the CS and RMC cohort, respectively. Regarding OAC-unrelated hospitalisa-
tions a less marked relative difference of number of admissions was observed (CS: 20.6 admissions per 100 py;
RMC: 55.4 admissions per 100 py).
Referring to OAC related hospitalisations, actual costs per hospital admission based on medical claims was
slightly higher for CS, although without significant difference (CS: 5689 [IQR 2901–8933] EUR; RMC: 5063 [IQR
4308–5945] EUR; p = 0.70), whereas the costs for OAC unrelated hospitalisations were lower in CS (CS: 3409 [IQR
2840–4163] EUR; RMC: 4945 [IQR 4505–5445] EUR; p < 0.001). Net savings in hospitalisation costs per py for
anticoagulation specific and non-specific outcomes are shown in Fig. 1. Greater savings in hospitalisation costs
per py in CS were observed for non-OAC related events compared to OAC-related (i.e. 2059 [IQR 1544–2591]
EUR vs. 518 [IQR 255–764] EUR).
Taking into consideration the rate of admissions and costs per admission, costs per py were diminished in
the CS cohort for OAC-related as well as OAC-unrelated hospital admissions resulting in 5-times lower total
hospitalisation costs per py in CS (CS: 683 [IQR 504–874] EUR vs. RMC: 3261 [IQR 2857–3689] EUR). In sum-
mary, total management costs per py in RMC were lower by 210 EUR compared to CS, whereas hospitalization
costs per py were 2578 EUR higher. Taking into account management costs, the overall cost saving was 2368
EUR per py favouring the CS treatment.
Scientific Reports | (2021) 11:2577 | https://doi.org/10.1038/s41598-021-82076-9 3
Vol.:(0123456789)www.nature.com/scientificreports/
Regular medical care (n = 1490) Coagulation service (n = 705)
Patient-years (py) 1184 465
Cost for anticoagulation management
Total cost per test [EUR] 4.70 12.96
Specialised nurse per test [EUR]a – 6.31
Medical specialist per test [EUR]b – 4.58
Preparation and dispatch of dosage recommendation per test [EUR] – 1.25
Usage of electronic patient files per test [EUR] – 0.82
Number of tests per year 21.5 24.0
Total cost for anticoagulation management per patient-year [EUR] 101 311
Cost for hospitalisation
OAC related
Number of admissions per 100 py 13.3 2.8
Cost per admission [EUR]c 5063 (4308–5945) 5689 (2901–8933)
Cost per patient-year [EUR]c 644 (492–812) 126 (48–237)
Not-OAC related
Preparation and dispatch of dosage recommendation Number of
55.4 20.6
admissions per 100 py
Preparation and dispatch of dosage recommendation cost per admis-
4945 (4505–5445) 3409 (2840–4163)
sion [EUR]c
Preparation and dispatch of dosage recommendation cost per patient-
2616 (2269–2998) 557 (407–725)
years [EUR]c
Total costs for hospitalisation per patient-year [EUR] 3261 (2857–3689) 683 (504–874)
Total costs [EUR] 3362 994
Table 3. Breakdown of hospitalisation and management costs stratified by treatment group. a Nursing time
per test was assumed to be 12 min for the hourly wage of 31.55 EUR. b Medical specialists time per consult
was assumed to be 5 min for the hourly wage of 54.92 EUR. c Confidence Intervals were generated via
bootstrapping.
Hospitalisations related to OAC treatment
Clinically- relevant bleeding
Hospitalisations not related to OAC treatment
Total hospitalisation costs
-4000 -3000 -2000 -1000 0 1000 2000 3000 4000 € per patient-year
savings in regular medical savings in coagulation
Figure 1. Net savings in hospitalisation costs per py for anticoagulation specific and non-specific outcomes.
As displayed in Fig. 2, the main reasons for hospitalisations were diseases of the circulatory system. Hospital
stays for the four most common ICD principal diagnoses (i.e. atrial fibrillation/flutter, heart failure, chronic
ischemic heart disease, angina pectoris) were less costly in the CS cohort. Costs of hospitalisation stays for
heart failure were significantly lower in CS (RMC: 2815 [IQR 2815–3602] EUR per admission vs. CS: 2620 [IQR
1494–2852] EUR per admission; p = 0.025).
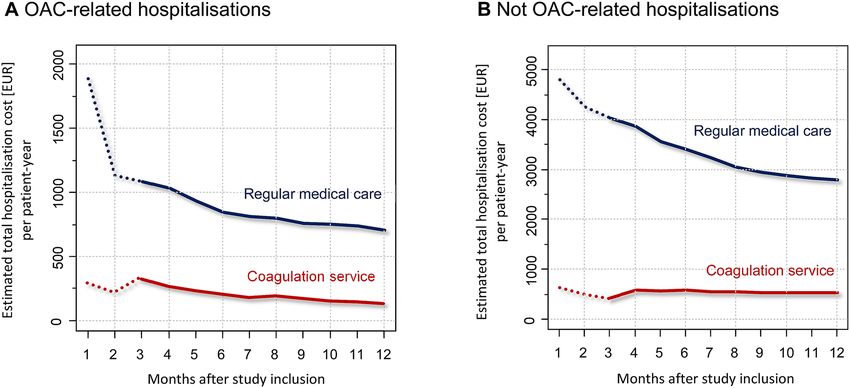
Hospitalisation costs over time. Figure 3 provides an overview on average OAC-related and OAC-
unrelated hospitalisation costs over the study period of 12 months. For both occasions, average hospitalization
costs (comprising number of admissions and cost per admission) were considerably higher in the RMC at the
start of the study. Costs over time—albeit at different levels—decreased over time in both cohorts. Referring
to OAC-unrelated hospitalisations, the change of average hospitalisations costs in the CS cohort over time was
comparatively small. The total non-OAC-related hospitalisation costs in the CS cohort stabilised at a constant
value of approximate 500 EUR per py.
Scientific Reports | (2021) 11:2577 | https://doi.org/10.1038/s41598-021-82076-9 4
Vol:.(1234567890)www.nature.com/scientificreports/
Figure 2. Median costs of hospitalizations for the five most common ICD-principal diagnoses stratified by
healthcare model.
Figure 3. Hospitalisation costs over the study period.
Propensity score weighted analysis. In order to account for the potential impact of differences in the
clinical profile of study participants in both cohorts on cost estimates, inverse probability of treatment weighting
using the propensity score was conducted. Lower costs per py for OAC-related hospitalisation in CS (CS: 139
[IQR 31–305] EUR vs. RMC: 587 [IQR 447–741] EUR) were revealed, idem for non-OAC related hospitalisa-
tions (CS: 706 [IQR 420–1058] EUR vs. RMC: 2523 [IQR 2186–2901] EUR). Total hospitalisation costs were
again lower by 2266 EUR per py. Taking into account management costs for both cohorts, net saving cost were
2056 EUR per py in the CS.
Discussion
This is the first study to evaluate the cost-saving of an eHealth based coagulation service compared with regular
medical care for the management of patients receiving oral anticoagulation therapy with VKA accounting for
operational costs, therapeutic outcome and the associated costs based on actual health claims data in a real-
world setting. The present study demonstrated that the savings of a CS observed with regard to clinical outcome
translate into substantial money saving of over 2000 EUR per py. Importantly, the positive cost-effectiveness was
due to a substantial saving in both OAC-related und -unrelated outcomes. This underlines that the multi-faceted
challenge OAC therapy can be successfully tackled by an eHealth-based, specialized CS.
Scientific Reports | (2021) 11:2577 | https://doi.org/10.1038/s41598-021-82076-9 5
Vol.:(0123456789)www.nature.com/scientificreports/
In general, it is challenging to compare the present results with findings from previous studies due to varia-
tions in study settings (e.g. differences in social aspects and healthcare systems). The thrombEVAL eHealth based
coagulation service as such is the first of its kind in Germany. Also, it must be recognized that not all anticoagula-
tion management systems are the same (e.g. difference in qualifications of staff, support software)21. However,
the overall cost saving of 2368 EUR per py in the CS cohort in the present analysis is similar to previously stated
amounts. Aziz et al.18 reported a yearly net saving of 2311 EUR per py (adjusted for inflation and converted into
EUR with currency rate of 2018/10/23), Chiquette et al.14 of 1897 EUR per py, and Rudd et al.15 of 998 EUR per
py. Each of the mentioned studies has clear limitations; nevertheless, the hypothesis of a coagulation service being
cost-saving is substantiated. In most investigations14,15,22, but not a ll17, there is a lack of detailed management
costs of the CS as well as reliable actual financial data from medical claims. However, these shortcomings were
addressed in the present study and, in addition, reasons for hospital admissions and the associated costs were
evaluated for both cohorts. Of note, the formally structured coagulation service has been shown to improve the
clinical outcome of patients when compared to usual medical care (e.g. lower rate of hospitalisations, major and
clinically relevant bleeding and all-cause mortality)12. It must be pointed out that investigations stating less auspi-
cious results regarding the beneficial effect of CS on therapeutic outcome did not conduct cost-saving analyses,
so potential publication bias cannot be ruled out with certainty23–25.
An improved control regarding quality of anticoagulation, assessed by the TTR, seems to be the key player
in improved clinical outcome in the CS12,26. Generally, if anticoagulation therapy is managed by a CS, sub-
jects are less likely to sustain bleeding or venous/arterial thromboembolic complications leading to less OAC
related-hospitalisation13,14, which can also be observed independent of the TTR12. Of note, in literature15,17,18
but also in the present study even more pronounced differences in non-OAC related hospitalisations between
cohorts were depicted. This supports the hypothesis that a specialised individually tailored healthcare model
(i.e. organized standardized-driven care, detailed standardized assessment of clinical status at each visit, and
individualized termination of control visits depending on medical necessity) allows evolving health problems
to be identified early and possibly addressed at the CS visit. This is underlined by the most frequent reasons
for hospital admission. For example, subjects in CS were significantly less often discharged with a diagnosis of
unspecified atherosclerosis which is not related to the therapy with oral anticoagulants. Overall, a combination
of improved TTR, regular contact with medical staff to early detect clinical symptoms, good patient education
and high availability of specialists for potential questions seem certainly as the most promising explanation for
a reduction of hospitalisations which in turn leads to lower costs in CS compared to RMC. It can be speculated
that preventive measures encouraged by CS also reduce costs per admission for certain diagnoses as seen in the
current analysis. However, this fact has not been investigated so far and remains to be evaluated in more detail.
Since DOAC are currently the most frequently prescribed oral anticoagulant agent27, it is of importance to set
the present results into context. Recent studies estimated the differences in medical costs for clinical outcomes
associated with the use of DOAC versus VKA when at different TTR levels. Despite higher drug costs, DOAC
reduced overall medical costs compared to warfarin, unless the TTR for VKA is above 60%28 or 65%29. Large
reductions in medical costs were mainly driven by less major bleedings with the DOAC30. A TTR in VKA-treated
patients of 75%, as in the current CS-cohort, emphasizes the assumption that VKA treatment in CS is superior
to DOAC with regard to cost-saving. It has to be noted that a TTR of ≥ 70% is often difficult to maintain in daily
regular medical care, as shown in registry-based s tudies31 as well as randomized clinical t rials32. In this regard,
considerations could be given to the possibility of managing patients receiving DOAC in a specialized service to
also saving from lower frequency of adverse events associated to this alternative form of health care provision.
Limitations. Some limitations of this work need to be acknowledged. First, the use of a non-randomized
study design might have introduced selection bias. Against this background, propensity score weighted analysis
accounting for clinical differences between cohorts was performed which proved the robustness of results. Gen-
erally, randomization to healthcare models seems problematic in real-life investigations, particularly because of
the limited ability to fully investigate a real-life scenario, but also because of patients´ beliefs and logistic and
financial reasons. Second, the basis for the assessment of management costs differed between the two groups.
In RMC, management costs were based on the reimbursement of costs by the national health insurance only
(there is a higher reimbursement for individuals with private health insurance), whereas costs in CS were equal
for all patients and were based on invoices of the service provider and real personnel costs. Since the percentage
of individuals with private health insurance is low (approx. 10% in Germany)33), the actual difference in costs
between the two systems is expected to be slightly underestimated. Third, costs for outpatient visits and proce-
dures as well as rehabilitation were not considered. Given the higher event rate in RMC vs. CS, an even greater
cost difference is likely if ambulatory costs would be included. Fourth, the follow-up period of 12-months was
relatively short but nevertheless greater than in previous investigations17. However, it can be seen that hospital
admission rates decreased with time and therefore one might suspect an even greater net saving for the CS com-
pared to RMC with longer observational time. Fifth, the majority of subjects (> 98%) received phenprocoumon
for anticoagulation therapy, which limits extrapolation to other oral anticoagulants. It is to be assumed that one
can see at least similar savings since therapy with warfarin is associated with greater INR variability. Last, the CS
was operated by a University Medical Center with specialized hemostaseological expertise compared to routine
medical care provided by ambulatory working general practitioners and specialized physicians, which might
have enhanced the difference between both care models.
Scientific Reports | (2021) 11:2577 | https://doi.org/10.1038/s41598-021-82076-9 6
Vol:.(1234567890)www.nature.com/scientificreports/
Conclusion
The present study illustrates that the improvement of clinical outcome of anticoagulated patients by a special-
ized, eHealth-based anticoagulation management system is cost-effective. Since cost saving was achieved by a
reduction of both OAC-specific and non-specific costs, this specialized health care model may also be beneficial
for patients receiving other anticoagulant agents. Generally, these findings could also stimulate the evaluation
of actions to improve quality of care in further medical fields to avoid higher secondary costs for the health care
system.
Methods
Study design. The thrombEVAL study (NCT01809015) is a prospective multi-centre cohort study compris-
ing two prospective cohorts: a cohort of patients receiving oral anticoagulation therapy in regular medical care
(RMC) and a cohort of anticoagulated patients whose anticoagulation therapy is managed by an eHealth-based,
specialized coagulation service (CS). Rationale and design of the study have been previously p ublished34. The
aim of the study was to investigate the quality of OAC with VKA in current health care and to evaluate the poten-
tial for improvements, and set it into context to a cost-saving analysis. Sample size calculations were conducted
to determine the optimal sample size and thereof assure an adequate power to detect statistical significant dif-
ferences between groups. All procedures were performed according to the principles of the Declaration of Hel-
sinki, good clinical practice and good epidemiological practice. Approval of the local ethics committee (federal
medical association Rhineland-Palatinate, reference no. 837.407.10.7415/7416) was obtained for all sites. All
participants provided informed written consent prior to study enrolment.
Study setting and study population. The study base of the thrombEVAL study is constituted by a
Western European, predominantly white population. Patients were recruited from January 2011 to March 2013.
Patients were eligible if they had the indication for OAC therapy for at least a further 3 months. The allocation
to the cohorts was not controlled or influenced by investigators of the study and was subject to the autonomous
decision of the patients (or their legal representative, if appropriate). Study enrolment for the multicentre cohort
of RMC (N = 2011 subjects) was carried out at hospitals and oral anticoagulation therapy was provided by gen-
eral practitioners and medical specialists (e.g. internal medicine). Due to the observational nature of the study,
management of OAC therapy as well as any other medical decisions were not influenced by the investigators of
the study and were left at the physicians´ discretion.
In the CS cohort (N = 760 subjects), management of OAC therapy was performed by a specialized service
that provided expert care by specifically-trained staff (i.e. nurses, medical doctors and senior physicians). Visits
for anticoagulation control were conducted in a highly standardized fashion with individualized time intervals
according to medical necessity. All treatment information (i.e. standardized assessment of clinical status and
level of international normalized ratio [INR] at each visit) was documented decentralized in a web-based, digital
case report form (Portavita B.V., Amsterdam, the Netherlands). This facilitated the coverage of both urban and
rural areas and enabled near-patient health care provision with standardized clinical assessment and digital
documentation. The electronic file was accessible for staff, patients and all physicians in charge (dependent on
the patient´s consent) via a secured internet connection. In the CS cohort, anticoagulant dose-adjustment was
based on the use of electronic patient file data and integrated computer-assisted dosing algorithms. Automated
scheduling of OAC control visits was established to prevent loss to follow-up and improve patient adherence.
The RMC group is a purely observational prospective study, so no interventions on therapy adjustment and
therapy monitoring were conducted.
In the RMC cohort, clinically relevant events were documented in electronic case report forms via annual
computer-assisted telephone interviews, whereas in the CS outcome-relevant events were recorded in the elec-
tronic patient file within the framework of anticoagulation control visits. Information on study endpoints was
validated by medical records and adjudicated by an independent review panel. In addition, electronic database
systems of hospital records were screened for unreported events to reduce a potential recall bias. All data were
checked for completeness, plausibility and validity according to pre-specified criteria which are defined in a
data management plan Median follow-up times for RMC and the CS were 12.0 (IQR, 11.9/12.0) and 14.0 (IQR,
6.6/19.2) months, respectively.
Data collection and analysis. Costs for oral anticoagulation management. The RMC management costs
are based on cost of INR measurements that are determined via the health care system (i.e. statutory scale of fees
for physicians20). Of note, costs for INR testing in Germany vary with the insurance status of the patient, mean-
ing statutory health insurance or private health insurance from a German or international insurance company.
The current analysis was based on costs in the statutory health care system, where the majority of patients are
part of (approx. 90%)33. Estimated INR testing frequency of 24.0 times per year for CS testing was assumed based
on published data from this cohort26.
Operational costs of the CS cohort consisted of compensation for staff, preparation and dispatch of dosage
recommendations and licensing fees for the electronic patient file (Portavita B.V) during the study period. The
personnel cost component per blood testing consisted of 12 min nursing time per contact with the patient (for
blood withdrawal, collection and entry of treatment-relevant information in the electronic file) at 31.55 € per
hour and 5 min medical doctor time per contact with the patient (for VKA dosing) at 54.92 € per hour. The
INR testing frequency of 21.5 times per year for usual care was derived from previously published data on the
thrombEVAL study26. In the current analysis medication costs for VKA were not included since they are assumed
to be equal in both cohorts.
Scientific Reports | (2021) 11:2577 | https://doi.org/10.1038/s41598-021-82076-9 7
Vol.:(0123456789)www.nature.com/scientificreports/
Costs for hospitalisation. Based on information on the clinical outcome of participants in both cohorts, the
associated hospitalization costs were evaluated. Costs estimates were based on available physician’s letters which
provide a blanket coverage of all hospitalisation costs. Diagnoses, operations and medical procedures were
coded according to the German modification of the ICD-10 (ICD-10GM) and the operation and procedure key
codes (OPS). OPS are provided by InEK (Institute for the Hospital Remuneration System) on behalf of the self-
governing partners of the German health care and are used in inpatient care. Both are essential components in
the diagnosis-related group (DRG) codes on which the calculation of total costs per hospital stay is based on. The
DRG system is a medico-economic patient classification system that reproduces the services provided by hos-
pitals via a fee-for-service payment system35. All discharged hospital patients are assigned to a DRG code using
on an algorithm which is based on inpatient hospital discharge dataset, containing: major and other diagnosis,
medical procedures, patient characteristics (age, gender), length of hospital stay, reason for hospital dis-charge
and type of admission (e.g. emergency, referral from GP or transfer from other hospital). For each of the DRG
codes a specific economic case value has been prescribed, and this case value, multiplied with a base rate which
is up to now specific for each hospital produces the reimbursement for a specific patient.
Statistical analysis. Discrete variables were described by absolute and relative frequencies, and continu-
ous variables by means with standard deviation or median value with 25th/75th percentiles (interquartile range,
IQR), where appropriate. No imputation was performed to address drop-out data. The time in therapeutic range
(TTR) was calculated according to the Rosendaal M ethod36. Hospital admissions within the first 12 months of
the study period were considered for analysis. In order to avoid bias, the first 2 months of follow-up were blanked
for the cost-saving analysis since study enrolment for the RMC cohort was performed during a hospitalization of
the patient. In order to reduce the possible bias (higher probability of complications and / or re-hospitalizations
shortly after inclusion in the study) as a result, a blanking period was introduced. It was distinguished between
hospital costs resulting from complications of anticoagulation (i.e. clinically-relevant bleeding or thromboem-
bolic events) and hospital costs which were not related to anticoagulation treatment (i.e. any other reason for
admission or death). To obtain total hospitalisation costs per patient year, recorded costs for 10 months were
extrapolated to 12 months and divided by the total number of participants. Due to extreme skewness of the data,
bootstrapping with 2000 replications was used to compute confidence intervals. Inverse probability of treatment
weighting using a propensity score was performed under consideration of the cardiovascular profile (i.e. pres-
ence of traditional cardiovascular risk factors and history of cardiovascular disease). Cost-saving calculations
were performed by using the differences in total costs between RMC and CS. All statistical analyses were con-
ducted using the software program R, v.3.1.1 (http://www.r-project.org).
Received: 13 November 2019; Accepted: 30 December 2020
References
1. Friberg, L., Rosenqvist, M. & Lip, G. Y. Net clinical saving of warfarin in patients with atrial fibrillation: A report from the Swedish
atrial fibrillation cohort study. Circulation 125, 2298–2307. https://doi.org/10.1161/circulationaha.111.055079 (2012).
2. Giugliano, R. P. et al. Edoxaban versus warfarin in patients with atrial fibrillation. N. Engl. J. Med. 369, 2093–2104. https://doi.
org/10.1056/NEJMoa1310907 (2013).
3. Granger, C. B. et al. Apixaban versus warfarin in patients with atrial fibrillation. N. Engl. J. Med. 365, 981–992. https://doi.
org/10.1056/NEJMoa1107039 (2011).
4. Patel, M. R. et al. Rivaroxaban versus warfarin in nonvalvular atrial fibrillation. N. Engl. J. Med. 365, 883–891. https://doi.
org/10.1056/NEJMoa1009638 (2011).
5. Connolly, S. J. et al. Dabigatran versus warfarin in patients with atrial fibrillation. N. Engl. J. Med. 361, 1139–1151. https://doi.
org/10.1056/NEJMoa0905561 (2009).
6. Weitz, J. I. et al. Trends in prescribing oral anticoagulants in Canada, 2008–2014. Clin. Ther. 37, 2506-2514.e2504. https://doi.
org/10.1016/j.clinthera.2015.09.008 (2015).
7. Eikelboom, J. W. et al. Dabigatran versus warfarin in patients with mechanical heart valves. N. Engl. J. Med. 369, 1206–1214. https
://doi.org/10.1056/NEJMoa1300615 (2013).
8. Cooper, G. M. et al. A genome-wide scan for common genetic variants with a large influence on warfarin maintenance dose. Blood
112, 1022–1027. https://doi.org/10.1182/blood-2008-01-134247 (2008).
9. Connolly, S. J. et al. Saving of oral anticoagulant over antiplatelet therapy in atrial fibrillation depends on the quality of international
normalized ratio control achieved by centers and countries as measured by time in therapeutic range. Circulation 118, 2029–2037.
https://doi.org/10.1161/circulationaha.107.750000 (2008).
10. Sanden, P., Renlund, H., Svensson, P. J. & Sjalander, A. Bleeding complications and mortality in warfarin-treated VTE patients,
dependence of INR variability and iTTR. Thromb Haemost https://doi.org/10.1160/th16-06-0489 (2016).
11. van Walraven, C., Jennings, A., Oake, N., Fergusson, D. & Forster, A. J. Effect of study setting on anticoagulation control: A sys-
tematic review and metaregression. Chest 129, 1155–1166. https://doi.org/10.1378/chest.129.5.1155 (2006).
12. Prochaska, J. H. et al. e-Health-based management of patients receiving oral anticoagulation therapy: Results from the observational
thrombEVAL study. J. Thromb. Haemost. 15, 1375–1385. https://doi.org/10.1111/jth.13727 (2017).
13. Wieloch, M. et al. Anticoagulation control in Sweden: Reports of time in therapeutic range, major bleeding, and thrombo-embolic
complications from the national quality registry AuriculA. Eur. Heart J. 32, 2282–2289. https://doi.org/10.1093/eurheartj/ehr134
(2011).
14. Chiquette, E., Amato, M. G. & Bussey, H. I. Comparison of an anticoagulation clinic with usual medical care: Anticoagulation
control, patient outcomes, and health care costs. Arch. Intern. Med. 158, 1641–1647 (1998).
15. Rudd, K. M. & Dier, J. G. Comparison of two different models of anticoagulation management services with usual medical care.
Pharmacotherapy 30, 330–338. https://doi.org/10.1592/phco.30.4.330 (2010).
16. Lafata, J. E., Martin, S. A., Kaatz, S. & Ward, R. E. Anticoagulation clinics and patient self-testing for patients on chronic warfarin
therapy: A cost-effectiveness analysis. J. Thromb. Thrombolysis. 9(Suppl 1), S13-19 (2000).
17. Hall, D. et al. Health care expenditures and therapeutic outcomes of a pharmacist-managed anticoagulation service versus usual
medical care. Pharmacotherapy 31, 686–694. https://doi.org/10.1592/phco.31.7.686 (2011).
Scientific Reports | (2021) 11:2577 | https://doi.org/10.1038/s41598-021-82076-9 8
Vol:.(1234567890)www.nature.com/scientificreports/
18. Aziz, F., Corder, M., Wolffe, J. & Comerota, A. J. Anticoagulation monitoring by an anticoagulation service is more cost-effective
than routine physician care. J. Vasc. Surg. 54, 1404–1407. https://doi.org/10.1016/j.jvs.2011.05.021 (2011).
19. Sullivan, P. W., Arant, T. W., Ellis, S. L. & Ulrich, H. The cost effectiveness of anticoagulation management services for patients
with atrial fibrillation and at high risk of stroke in the US. Pharmacoeconomics 24, 1021–1033 (2006).
20. KASSENÄRZTLICHE BUNDESVEREINIGUNG. EINHEITLICHER BEWERTUNGSMASSSTAB-EBM. https: //www.kbv.de/html/
ebm.php (2018).
21. Holbrook, A. et al. Evidence-based management of anticoagulant therapy: Antithrombotic therapy and prevention of thrombosis,
9th ed: American College of Chest Physicians Evidence-Based Clinical Practice Guidelines. Chest 141, e152S-184S. https://doi.
org/10.1378/chest.11-2295 (2012).
22. Lafata, J. E., Martin, S. A., Kaatz, S. & Ward, R. E. The cost-effectiveness of different management strategies for patients on chronic
warfarin therapy. J. Gen. Intern. Med. 15, 31–37 (2000).
23. Landefeld, C. S. & Anderson, P. A. Guideline-based consultation to prevent anticoagulant-related bleeding. A randomized, con-
trolled trial in a teaching hospital. Ann. Intern. Med. 116, 829–837 (1992).
24. Matchar, D. B., Samsa, G. P., Cohen, S. J., Oddone, E. Z. & Jurgelski, A. E. Improving the quality of anticoagulation of patients with
atrial fibrillation in managed care organizations: Results of the managing anticoagulation services trial. Am. J. Med. 113, 42–51
(2002).
25. Wilson, S. J. et al. Comparing the quality of oral anticoagulant management by anticoagulation clinics and by family physicians:
A randomized controlled trial. CMAJ 169, 293–298 (2003).
26. Prochaska, J. H. et al. Quality of oral anticoagulation with phenprocoumon in regular medical care and its potential for improve-
ment in a telemedicine-based coagulation service—Results from the prospective, multi-center, observational cohort study
thrombEVAL. BMC Med. 13, 14. https://doi.org/10.1186/s12916-015-0268-9 (2015).
27. Gadsboll, K. et al. Increased use of oral anticoagulants in patients with atrial fibrillation: Temporal trends from 2005 to 2015 in
Denmark. Eur. Heart J. 38, 899–906. https://doi.org/10.1093/eurheartj/ehw658 (2017).
28. You, J. H. Novel oral anticoagulants versus warfarin therapy at various levels of anticoagulation control in atrial fibrillation—A
cost-effectiveness analysis. J. Gen. Intern. Med. 29, 438–446. https://doi.org/10.1007/s11606-013-2639-2 (2014).
29. Amin, A. et al. Estimation of the impact of warfarin’s time-in-therapeutic range on stroke and major bleeding rates and its influ-
ence on the medical cost avoidance associated with novel oral anticoagulant use-learnings from ARISTOTLE, ROCKET-AF, and
RE-LY trials. J. Thromb. Thrombolysis. 38, 150–159. https://doi.org/10.1007/s11239-013-1048-z (2014).
30. Krejczy, M., Harenberg, J., Wehling, M. & Obermann, K. Cost-effectiveness of anticoagulation in patients with nonvalvular atrial
fibrillation with edoxaban compared to warfarin in Germany. Biomed. Res. Int. 2015, 876923. https://doi.org/10.1155/2015/87692
3 (2015).
31. Pokorney, S. D. et al. Patients’ time in therapeutic range on warfarin among US patients with atrial fibrillation: Results from
ORBIT-AF registry. Am. Heart J. 170(141–148), 148.e141. https://doi.org/10.1016/j.ahj.2015.03.017 (2015).
32. Agarwal, S., Hachamovitch, R. & Menon, V. Current trial-associated outcomes with warfarin in prevention of stroke in patients
with nonvalvular atrial fibrillation: a meta-analysis. Arch. Intern. Med. 172, 623–631; discussion 631–623. https: //doi.org/10.1001/
archinternmed.2012.121 (2012).
33. BMG & PKV. Anzahl der Mitglieder und Versicherten der gesetzlichen und privaten Krankenversicherung in den Jahren 2011 bis 2017
(in Millionen). https://de.statista.com/statistik/daten/studie/155823/umfrage/gkv-pkv-mitglieder-und-versichertenzahl-im-vergl
eich/ (2018).
34. Prochaska, J. H. et al. Evaluation of oral anticoagulation therapy: Rationale and design of the thrombEVAL study programme. Eur.
J. Prev. Cardiol. 22, 622–628. https://doi.org/10.1177/2047487314527852 (2015).
35. Kobel, C., Thuilliez, J., Bellanger, M. & Pfeiffer, K.-P. in Diagnosis-Related Groups in Europe: Moving Towards Transparency, Efficiency
and Quality in Hospitals. (eds R. Busse, A. Geissler, W. Quentin, & M. Wiley) 37–58 (Open University Press, New York, 2011).
36. Rosendaal, F. R., Cannegieter, S. C., van der Meer, F. J. & Briet, E. A method to determine the optimal intensity of oral anticoagulant
therapy. Thromb. Haemost. 69, 236–239 (1993).
Acknowledgements
We thank all study participants of the thrombEVAL study and co-workers of the Center for Thrombosis and
Hemostasis of the University Medical Mainz for their commitment and support. This work contains results that
are part of the doctoral thesis of Paul Ludolph.
Author contributions
Conception and study design: L.E., P.L., T.M., J.H.P., P.S.W. Substantial contribution to acquisition, analysis, or
interpretation of data: L.E., P.L., S.G., M.P.-N., N.A., M.N., C.B., M.L., R.H., H.t.C., K.J.L., C.E.-K., T.M., J.H.P.,
P.S.W. Data management and statistical analysis: M.N., P.L., L.E., J.H.P., P.S.W. Drafting the manuscript: L.E.,
P.L., J.H.P., P.S.W. Revising manuscript critically for important intellectual content: L.E., P.L., S.G., M.P.-N.,
N.A., M.N., C.B., M.L., R.H., H.t.C., K.J.L., C.E.-K., T.M., J.H.P., P.S.W. All authors have read and approved the
manuscript in its current form.
Funding
Open Access funding enabled and organized by Projekt DEAL. The thrombEVAL study was supported by the
state initiative “health economy” of the Ministries of Health and Economics, Rhineland-Palatinate, Germany
(Grant identifier: AZ.623-1), the Federal Ministry of Education and Research, Germany (Grant identifier: BMBF
10E01003), the Centre for Translational Vascular Biology (CTVB) of the University Medical Center Mainz,
Boehringer Ingelheim Pharma GmbH & Co. KG, Bayer Vital GmbH, Daiichi Sankyo Europe GmbH, Sanofi-
Aventis Germany GmbH, IMO Institute GmbH, Portavita BV and the German Heart Foundation. The sponsoring
bodies played no role in the planning, conduct or analysis of this study.
Competing interests
The authors declare no competing interests.
Additional information
Correspondence and requests for materials should be addressed to P.S.W.
Reprints and permissions information is available at www.nature.com/reprints.
Scientific Reports | (2021) 11:2577 | https://doi.org/10.1038/s41598-021-82076-9 9
Vol.:(0123456789)www.nature.com/scientificreports/
Publisher’s note Springer Nature remains neutral with regard to jurisdictional claims in published maps and
institutional affiliations.
Open Access This article is licensed under a Creative Commons Attribution 4.0 International
License, which permits use, sharing, adaptation, distribution and reproduction in any medium or
format, as long as you give appropriate credit to the original author(s) and the source, provide a link to the
Creative Commons licence, and indicate if changes were made. The images or other third party material in this
article are included in the article’s Creative Commons licence, unless indicated otherwise in a credit line to the
material. If material is not included in the article’s Creative Commons licence and your intended use is not
permitted by statutory regulation or exceeds the permitted use, you will need to obtain permission directly from
the copyright holder. To view a copy of this licence, visit http://creativecommons.org/licenses/by/4.0/.
© The Author(s) 2021
Scientific Reports | (2021) 11:2577 | https://doi.org/10.1038/s41598-021-82076-9 10
Vol:.(1234567890)You can also read