Impact of Cruise Activity on Freshwater Use in the Port of Palma (Mallorca, Spain) - MDPI
←
→
Page content transcription
If your browser does not render page correctly, please read the page content below

water
Article
Impact of Cruise Activity on Freshwater Use in the
Port of Palma (Mallorca, Spain)
Celso Garcia 1 , Christian Mestre-Runge 2 , Enrique Morán-Tejeda 1, * ,
Jorge Lorenzo-Lacruz 3 and Dolores Tirado 4
 1   Department of Geography, University of the Balearic Islands, 07122 Palma, Spain; celso.garcia@uib.es
 2   Department of Horticulture, Fruit Growing Botany and Gardening, University of Lleida, 25198 Lleida, Spain;
     cristian.mestre@hbj.udl.cat
 3   Department of Human Sciences, University of La Rioja, 26006 Logroño, Spain; jorge.lorenzo@unirioja.es
 4   Department of Applied Economics, University of the Balearic Islands, 07122 Palma, Spain;
     dolores.tirado@uib.es
 *   Correspondence: e.moran@uib.es; Tel.: +34-971-173482

 Received: 4 February 2020; Accepted: 9 April 2020; Published: 11 April 2020

 Abstract: Lack of knowledge about freshwater use in ports of tourist destinations hinders accurate
 assessment of water availability and water planning. In this study, freshwater use in the Port of Palma
 (Spain) is analyzed by sector (commercial, mixed, navy and recreational) for the period 2007–2018.
 This study shows the dynamics of consumption and evaluates the effects of increased cruise tourism
 from 2007 to 2018 in the port. Water data supplied by the Port Authority of the Balearic Islands for
 each sector, together with water volumes recharged by ships, allow a detailed analysis of the water
 used by merchants and cruise lines. Results reveal a significant increase in freshwater withdrawals
 by cruise ships in the Port of Palma in the last ten years, closely related to the boom of cruise activity.
 Water use and recharge by cruise ships increased in both the high and low tourist seasons. Homeport
 cruises have a significant effect on the increase of freshwater withdrawals, as each homeport cruise
 ship recharged a mean volume of 628 m3 per mooring. This paper proposes a water withdrawal
 indicator of liters loaded per passenger at the port. Given the current lack of restriction on the number
 of cruise ships per day docking in the Port of Palma, cruise activity may well become a threat to
 water availability during drought episodes and another environmental cost to add to the already
 questioned cruise tourism activity of the island.

 Keywords: cruise tourism; freshwater withdrawals; Port of Palma; Mediterranean

1. Introduction
     Freshwater supply was not one of the top 10 environmental priorities of European ports for
2018 [1], and it has not been a priority since 1996, when water was considered an environmental issue
(or constraint) for port development [2]. The first three priorities for port authorities have been the
same since 2016: air quality, energy consumption and noise. However, freshwater withdrawal is one of
the environmental monitoring indicators reported by 72% of European ports in 2018, the fourth behind
waste, energy consumption and water quality [1].
     Mediterranean ports have witnessed an important increase in the cruise tourism industry over
the last 15 years [3]. Although it is recognized as a dynamic sector with economic benefits, it also has
social and environmental costs [4–10], with historical town centers and tourist resources overwhelmed
by massive numbers of tourists in just a few hours [11]. The Mediterranean Sea is the second most
travelled area in cruise routes after the Caribbean. In 2018, the 10 major MedCruise Ports, in terms of
cruise passengers, hosted a total of 17 million passenger visits and had 5875 cruise berths, increasing

Water 2020, 12, 1088; doi:10.3390/w12041088                                        www.mdpi.com/journal/water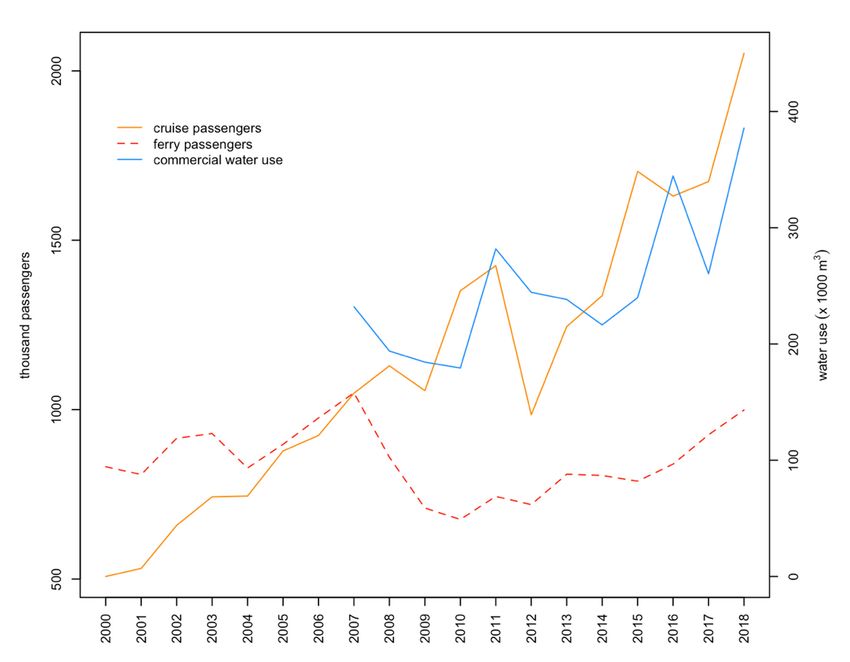
Water 2020, 12, 1088                                                                                  2 of 11

10.4% and 3.6%, respectively, compared with the previous year [12]. The Balearic Islands reached first
position among visited Mediterranean ports in 2018, with 859 cruise berths, a 26.7% increase over 2014;
and it was the third top destination in 2018, with 2,431,153 total cruise passenger visits, increasing
53.2% in the last four years. This archipelago also tops the list of main European cruise ports classified
as scale (stopover included in an itinerary). In 2018, it received 1.57 million passengers, and, from 2014
to 2018, the number of passengers increased 60.4%. As a homeport (departure and/or end point of
the cruise itinerary), it received around 850,000 passengers in 2018, 41.5% more than in 2014 [12], as it
holds a competitive advantage in attracting homeport traffic through a specialization strategy [13].
      Despite the large freshwater volume required by ships in general, and cruises in particular, there is
a lack of information, from a scientific view, on the impact this activity may have on freshwater
resources, as there are no references to this topic in the relevant literature. Regardless of the many areas
of interest, the number of scientific papers addressing cruise tourism does not match the importance of
this type of tourism [14]. Although cruise tourism can be studied from the aspect of environmental
impact caused by the number and size of ships and the cultural implications on destination ports [15],
there has been no research done on the implications of cruise tourism on freshwater resources.
      It is recognized that these luxury floating cities consume more resources than normal consumption
patterns [16], and this overconsumption creates pressure in areas with fewer freshwater resources,
but there is no literature specific to the cruise industry [17]. Some of the main cruise lines report water
withdrawal per guest night on board [18], trying to reduce environmental impact and being socially
responsible, but there is a lack of transparency regarding how much water they recharge at home
ports. This is especially critical in small ports or islands with limited freshwater resources where, on
heavy cruise days, the water demand increases [19]. There is a need to specify a water consumption
indicator for cruise water consumption at ports that will allow comparison to local consumption
volumes, in order to identify potential conflicts [19].
      However, this is not an easy task; there is difficulty obtaining water use data from ports due to a
lack of transparency in data management and the management of freshwater in ports. For example,
in Spain, water is supplied by the water company to the port authority, and they sell part of this water
to cruise and ferry vessels. Such gaps in knowledge may affect the capacity of water managers to
accurately account for all water uses taking place in the territory and, consequently, in the design of
sustainable water planning. This can be especially relevant in sensitive areas with inherent freshwater
availability issues, such as the Balearic Islands [20–22].
      Water supply in these Mediterranean islands has been negatively impacted by the rapid
development of tourism, with an increase of residential and seasonal population [23–25]. This may
all be aggravated by the consequences of climate change in the region. Projections show a decrease
in freshwater availability due to decreasing precipitation and increasing evapotranspiration [26,27],
with Mediterranean islands among the areas expected to be particularly affected by these changing
conditions [28].
      Given the background, this study proposes the first assessment of water use by ports, in the context
of increasing cruise activity in a hot-spot area of both tourism increase and freshwater vulnerability.
From the five ports of the Balearic Islands, the Port of Palma was selected because it is the largest and
is a world leader in cruise passenger traffic. It is well equipped to play host to the world’s largest
cruise ships [29]. The island received 11,950,342 tourists in 2018, with 10.4 million people from other
countries. The highest number of people on the island was recorded on 7 August 2018 at 1,457,173 [30].
      The aim of this paper is to show the dynamics of water use in the port and its service areas between
2007 and 2018, and to outline how the increase in cruise ships and passengers have affected the water
supply in the port of the city of Palma, one of the main touristic destinations in the Mediterranean with
limited freshwater resources.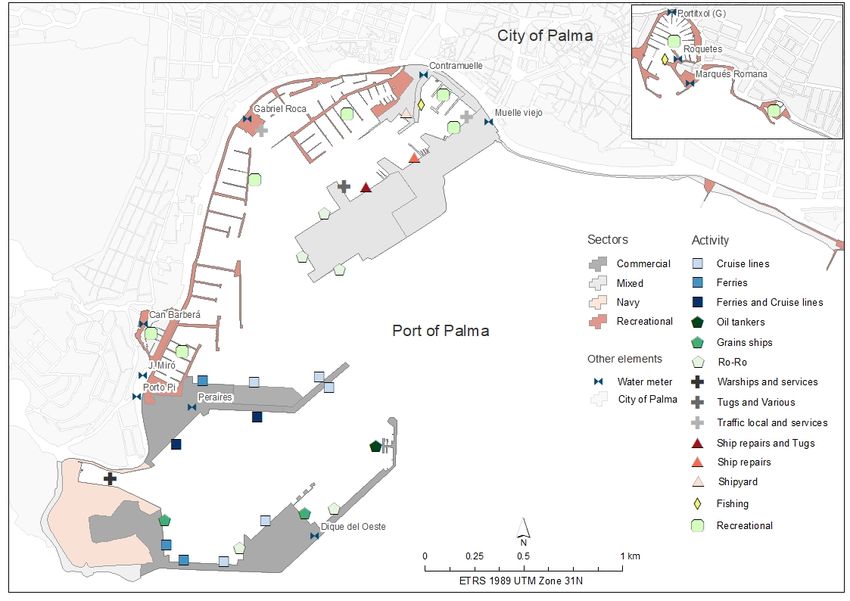
Water 2020, 12, 1088 3 of 11
Water 2020, 12, x 3 of 12
2. Study Area
2. Study Area
The Port of Palma is a commercial, passenger, recreational and fishing port located in the city of
The Port of Palma is a commercial, passenger, recreational and fishing port located in the city of
Palma (Mallorca, Balearic Islands, Spain) in the western sector of the Mediterranean Sea (Figure 1).
Palma (Mallorca, Balearic Islands, Spain) in the western sector of the Mediterranean Sea (Figure 1).
Since the middle of the 20th century, this port has been managed by the Port Authority of the Balearic
Since the middle of the 20th century, this port has been managed by the Port Authority of the Balearic
Islands
Islands (APB)
(APB) and and has
has undergone
undergone continuous
continuous expansion, adapting to
expansion, adapting to the
the requirements
requirements of of nautical
nautical
tourism
tourism and the transit of goods and passengers. The current land area, water areas and depot areas
and the transit of goods and passengers. The current land area, water areas and depot areas
are
are 340
340 ha,
ha, with
with 13.7
13.7 kmkm ofof berthing
berthing length
length and
and aa maximum
maximum draught
draught ofof 16
16 m. The entrance
m. The entrance to the port
to the port
is oriented ENE, with a width of
is oriented ENE, with a width of 790 m [29].790 m [29].
The
The Port
Port ofof Palma
Palma is the main
is the main point
point of of entry
entry and
and exit
exit of
of goods
goods from
from Mallorca,
Mallorca, with
with more
more import
import
than
than export.
export. TheThe imbalance
imbalance between
between imports
imports (69.5%)
(69.5%) andand exports
exports (30.5%)
(30.5%) [29]
[29] characterizes
characterizes Mallorca
Mallorca
as
as an island dependent
an island dependent on foreign trade,
on foreign trade, duedue to
to the
the effect
effect of
of insularity.
insularity. Historical
Historical series
series of mercantile
of mercantile
data
data indicate
indicate thethe port
port has
has experienced
experienced significant
significant growth
growth since
since 1994,
1994, especially
especially in
in the
the general
general goods
goods
market.
market. Conversely, the percentage variation ratio indicates a decrease in the cargo derived
Conversely, the percentage variation ratio indicates a decrease in the cargo derived from
from
solid and liquid goods since 2005. This port is well connected with other national
solid and liquid goods since 2005. This port is well connected with other national ports (Barcelona, ports (Barcelona,
Valencia,
Valencia, Ibiza,
Ibiza, Mahon,
Mahon, Dénia)
Dénia) byby some
some regular
regular lines.
lines. Regarding
Regarding Atlantic
Atlantic and
and Mediterranean
Mediterranean cruisecruise
lines,
lines, Palma has positioned itself as a hybrid cruise port (homeport and transit) due
Palma has positioned itself as a hybrid cruise port (homeport and transit) due to
to its
its functional
functional
capacity
capacity (transport
(transport services, intermediation services,
services, intermediation services, hotels,
hotels, port
port and
and land
land services
services such
such as as water
water
supply,
supply,greygreywaterwaterandandsolidsolid
wastewaste
collection, etc.) [31],
collection, and[31],
etc.) also and
due to its adequate
also due to itsportadequate
infrastructure
port
(passenger
infrastructure terminal, quay length
(passenger for berthing
terminal, quay lengthand unberthing
for berthing of cruise ships). In addition,
and unberthing of cruisefactors such
ships). In
as the connectivity between the port and the international airport of Palma via
addition, factors such as the connectivity between the port and the international airport of Palma via major roads, plus its
geographical
major roads, plus location (less than two
its geographical hours(less
location by plane
than twofrom central
hours Europe),
by plane frommake Palma
central Europe),a favored
make
homeport for cruise ships.
Palma a favored homeport for cruise ships.
Figure 1. Location of the Port of Palma in (A) the western Mediterranean, (B) the island of Mallorca
Figure
and (C)1.the
Location of the and
city of Palma Portits
of connection
Palma in (A) thethe
with western Mediterranean, (B) the island of Mallorca
airport.
and (C) the city of Palma and its connection with the airport.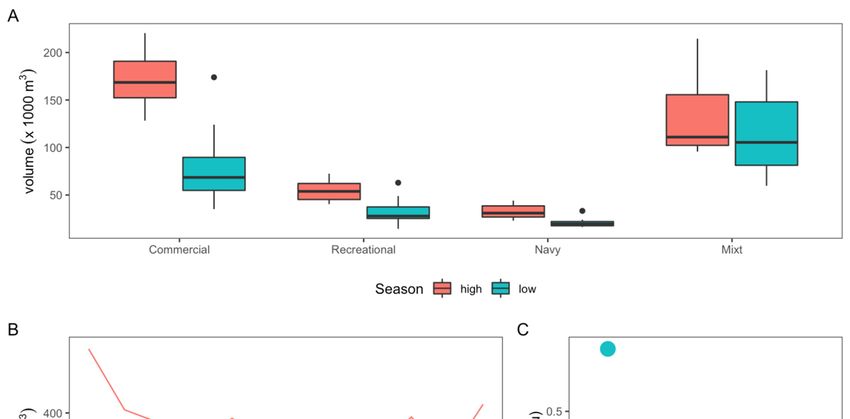
Water 2020, 12, 1088 4 of 11
Water 2020, 12, x 4 of 12
3. Materials and Methods
3. Materials and Methods
High spatial resolution cartography was carried out using a Geographic Information System
High spatial resolution cartography was carried out using a Geographic Information System
(GIS) to characterize the functionality of the Palma port. Using spatial data from the National
(GIS) to characterize
Geographic Institute the functionality
of Spain [32] andofhigh-resolution
the Palma port. Using spatial data
orthophotography (yearfrom
2018,the National
geometric
Geographic
resolution 15 Institute of the
cm/pixel), Spain [32]areas
service and ofhigh-resolution orthophotography
the port were digitalized. The various (year
port 2018, geometric
activities were
resolution 15 cm/pixel), the service areas of the port were digitalized. The
digitalized and geolocated using information provided by the APB’s Environmental Sustainability various port activities were
digitalized
Report [29]. and geolocated using information provided by the APB’s Environmental Sustainability
ReportIn[29].
each commercial and naval station wharf, APB has water intakes to supply freshwater to
In each commercial
merchant, warfare, and
service navaland
vessels station
land wharf,
services.APB has water supply
Its freshwater intakescapacities
to supplyvary freshwater
from 12 to
merchant, warfare, service vessels and land services. Its freshwater
m /hour/quays to 720 m /hour/quays. APB also supplies freshwater to recreational, fishing and
3 3 supply capacities vary from
m /hour/quaysservices
3
12complementary to 720 m 3 /hour/quays.
areas. In order to APB also water
obtain supplies usefreshwater
by sector into the
recreational, fishingthe
Port of Palma, and
complementary
activities wereservices areas.
classified in In order
four to obtain water
categories: use by sector
commercial, mixed,in navy
the Portand of Palma, the activities
recreational. The
commercial
were classifiedcategory includes ferries
in four categories: and cruise
commercial, lines,
mixed, andand
navy the recreational.
mixed sectorThe includes ship repairs,
commercial category
local traffic
includes andand
ferries services,
cruiseland
lines,services,
and thetugsmixedand sector
various, Ro-Ro, ship repairs
includes repairs,and
localtugs, andand
traffic shipyards
services,
(Figure
land 2). tugs and various, Ro-Ro, ship repairs and tugs, and shipyards (Figure 2).
services,
TheAPB
The APB hashas eleven
eleven waterwatermetersmeters
thatthat record
record waterwater consumption
consumption at areas.
at these these areas.
Water Water is
is supplied
supplied by Palma’s municipal water company EMAYA. All water volumes,
by Palma’s municipal water company EMAYA. All water volumes, registered at each water meter in a registered at each water
meter in bill,
bimonthly a bimonthly
were cededbill,bywere
the APBcededforbythethe APB 2008-2018
period for the period 2008-2018
and were and were
seasonally seasonally
aggregated using
high (May through October) and low (November through April) tourist seasons as reference. as
aggregated using high (May through October) and low (November through April) tourist seasons
reference.
Basic data plotting was done to visualize the evolution of water use in the Port of Palma, and the
Basic data plotting was done to visualize the evolution of water use in the Port of Palma, and
Mann–Kendall test, with pre-whitening auto-correlation algorithm removal [33], was applied to data
the Mann–Kendall test, with pre-whitening auto-correlation algorithm removal [33], was applied to
to explore for significant monotonic trends during the study period.
data to explore for significant monotonic trends during the study period.
Figure 2. Classification of sectors in the Port of Palma according to activities and linked to the water
Figureinstalled.
meters 2. Classification of sectors in the Port of Palma according to activities and linked to the water
meters installed.
One of the main difficulties of data collection was to obtain water withdrawal by ship typology.
One of in
This research thethe
main
Portdifficulties of data collection
of Palma required was several
contact with to obtain water withdrawal
companies to obtain by ship
some typology.
data on water
This research in the Port of Palma required contact with several companies to obtain some data on
recharge by their ships during stays in the port. These data further helped to interpret these results.Water 2020, 12, x 5 of 12
Water
water2020, 12, 1088
recharge 5 of 11
by their ships during stays in the port. These data further helped to interpret these
results.
4. Results
4. Results
4.1. Evolution of Water Use in the Port of Palma by Sectors
4.1. Evolution of Water Use in the Port of Palma by Sectors
Water withdrawal in the four sectors showed a clearly seasonal pattern, with a maximum peak
Water withdrawal in the four sectors showed a clearly seasonal pattern, with a maximum peak
during the high tourist season period (May–October) and a minimum during the low tourist season
during the high tourist season period (May–October) and a minimum during the low tourist season
period (November–April) (Figure 3A), although differences between high and low seasons were not
period (November–April) (Figure 3A), although differences between high and low seasons were not
equal
equalamongst
amongstsectors.
sectors.The
The commercial
commercial sector was the
sector was the largest
largestconsumer
consumerduring
duringthetheperiod
period2007-2018
2007-2018
but also showed more seasonal dependence. The mixed sector showed less difference
but also showed more seasonal dependence. The mixed sector showed less difference between between seasons
and, consequently,
seasons larger consumption
and, consequently, than the
larger consumption commercial
than sectorsector
the commercial during the low
during the season. It also
low season. It
showed more interannual variability, as indicated by the length of boxes and whiskers
also showed more interannual variability, as indicated by the length of boxes and whiskers of the of the boxplot.
The recreational
boxplot. and the navyand
The recreational sectors
the showed the lowest
navy sectors showedand least variableand
the lowest water withdrawal
least variable but still
water
with differences
withdrawal butbetween
still withthe two seasons.
differences between the two seasons.
Figure 3. (A) Boxplots showing the distribution of water use by sectors and seasons during the period
Figure 3. (A) Boxplots showing the distribution of water use by sectors and seasons during the period
2007–2018. (Solid lines: median; boxes: first and third quartiles; whiskers: 10th and 90th percentiles;
2007–2018. (Solid lines: median; boxes: first and third quartiles; whiskers: 10th and 90th percentiles;
dots: 5th and 95th percentiles). (B) Trend of temporal evolution for the period 2007–2018 of water
dots: 5th and 95th percentiles). (B) Trend of temporal evolution for the period 2007–2018 of water
withdrawals for the high and low tourist seasons. (C) Results of the Mann–Kendall trend test in the
withdrawals for the high and low tourist seasons. (C) Results of the Mann–Kendall trend test in the
four sectors, classified by high and low tourist season, with y axis showing Kendall tau coefficient.
four sectors, classified by high and low tourist season, with y axis showing Kendall tau coefficient.
The temporal dynamic of the total water consumed by the Port of Palma for the high and
The temporal dynamic of the total water consumed by the Port of Palma for the high and low
low seasons showed a general decrease since 2007 (Figure 3B), showing minimum consumption in
seasons showed a general decrease since 2007 (Figure 3B), showing minimum consumption in 2013–
2013–2014. However, the general reduction in the consumed water had some peak values in the series
2014. However, the general reduction in the consumed water had some peak values in the series (e.g.,
(e.g., 2011, 2016) and a clear recovery in 2018. This is especially remarkable for the low tourist season,
2011, 2016) and a clear recovery in 2018. This is especially remarkable for the low tourist season, with
with values in 2018 overcoming the values of 2007, and is also getting closer to the volumes consumed
values in 2018 overcoming the values of 2007, and is also getting closer to the volumes consumed in
in the high season. The observed decreasing trend is, however, masking differences in the trends of
the high season. The observed decreasing trend is, however, masking differences in the trends of
consumed water by the different sectors (Figure 3C). The Kendall’s coefficient showed a significant
increase in water consumed by the commercial sector (i.e., ferries and cruisers) for both the low andWater 2020, 12, x 6 of 12
Water 2020, 12,water
consumed 1088 by the different sectors (Figure 3C). The Kendall’s coefficient showed a significant 6 of 11
increase in water consumed by the commercial sector (i.e., ferries and cruisers) for both the low and
high
high seasons (Figure 3C).
seasons (Figure 3C). The
The increase
increaseininwater
wateruse
userecorded
recordedforforthe
thelow
lowseason
seasonis is considerable
considerable andandis
is an indicator of how the number of cruises and ferries has grown in months like November,
an indicator of how the number of cruises and ferries has grown in months like November, March and March
and
AprilApril
duringduring
recentrecent
years.years.
UnlikeUnlike commercial
commercial water water use, recreational,
use, recreational, navy andnavy
mixedandsectors
mixed showed
sectors
showed either no trend or decreasing trends that were significant during the
either no trend or decreasing trends that were significant during the low tourist season.low tourist season.
4.2.
4.2. Water
Water Withdrawal
Withdrawal by
by Cruise
Cruise Ships
Ships
The
The evolution
evolution of of movement
movement of of passengers
passengers has has grown
grown substantially
substantially since
since 2000,
2000, except
except for
for aa
remarkable
remarkable decrease
decrease between
between 20072007 and
and 2010
2010 for
for ferry
ferry passengers
passengers andand in
in 2012
2012 for
for cruise
cruise passengers
passengers
(Figure 4). In recent years, although the trend in passenger traffic has been
(Figure 4). In recent years, although the trend in passenger traffic has been positive, due inpositive, due in part
parttoto
a
boom in the cruise market, it is observable that the number of ferry passengers
a boom in the cruise market, it is observable that the number of ferry passengers has not grown athas not grown at the
same rate.rate.
the same The decrease in water
The decrease withdrawals
in water since 2007
withdrawals outlined
since in the above
2007 outlined in thesection
abovecan be partially
section can be
explained by the important reduction in the number of ferry passengers. When
partially explained by the important reduction in the number of ferry passengers. When the dynamic the dynamic of
passengers was compared with the water consumed in the commercial sector, the
of passengers was compared with the water consumed in the commercial sector, the reduction between reduction between
2007
2007 and
and 2010
2010 was
was significant
significant and
and could
could bebe aa consequence
consequence of of the
the decrease
decrease in
in the
the number
number ofof ferry
ferry ships
ships
and passengers. From 2010 onwards, water withdrawals in the sector increased,
and passengers. From 2010 onwards, water withdrawals in the sector increased, in general terms, in general terms,
with
with aa positive
positive relationship
relationship withwith the increase of
the increase of cruise
cruise and
and ferry
ferry passengers
passengers inin the
the last
last years.
years. The
The
important
important increase in number of cruise ships and recovery of the number of ferries seemingly has an
increase in number of cruise ships and recovery of the number of ferries seemingly has an
impact
impact on
on the
the water
water used
used in
in the
the Port
Port of
of Palma.
Palma.
Figure 4. Historical series of dynamic of passengers and ships from cruisers and ferries, along with the
Figure 4. Historical
water use in the portseries
by theofcommercial
dynamic ofsector.
passengers and ships from cruisers and ferries, along with
the water use in the port by the commercial sector.
Table 1 shows monthly water withdrawals by ship typology and number of ships for the year
2016 Table
(data 1
forshows
other monthly
years were not withdrawals
water available or not
by possible to obtain).
ship typology Total water
and number use infor
of ships thethe
Port of
year
Palma wasfor
627,300 3
2016 (data otherm . Half
years wereof this
not volume
availablecorresponds to consumption
or not possible by merchant
to obtain). Total water useships and
in the from
Port of
Palma wasand
the mixed 627,300 m3. Halfsectors.
commercial of this Seasonality
volume corresponds tofor
was higher consumption by merchant
the cruises and lowest forships and from
the merchants.
In terms of water loaded by the different ships, there were three distinct categories:Water 2020, 12, 1088 7 of 11
Table 1. Water withdrawals by merchants and cruise ships for the year 2016.
Total Water
Total Water Average Water Total Water Total Water Average Water Total Water Average Water
Withdrawals by Number of Number of
Withdrawals Number of Withdrawals by Withdrawals Withdrawals Withdrawals Withdrawals Withdrawals
Month Merchants Ships (Mixt Transit Homeport
Port of Palma, Merchant Ships Merchant Ship, by Cruise by Transit by Transit by Homeport by Homeport
and Commercial Cruises Cruises
m3 m3 Ship, m3 Cruise, m3 Cruise, m3 Cruise, m3 Cruise, m3
Sectors), m3
Jan 47,080 40,969 162 252.9 0 8 0 0
Feb 22,870 14,324 165 86.8 2400 11 2400 218.2 0
March 29,850 19,228 178 108.0 2930 16 2930 183.1 0
April 25,200 12,753 182 70.1 6780 33 1870 56.7 12 4910 409.2
May 46,390 14,871 182 81.7 19,760 42 4070 96.9 24 15,690 653.8
June 57,700 27,852 202 137.9 18,320 28 2820 100.7 22 15,500 704.5
July 74,810 38,402 213 180.3 19,300 38 2590 68.2 21 16,710 795.7
Aug 62,770 29,223 204 143.3 19,630 41 5100 124.4 22 14,530 660.5
Sept 98,710 69,699 181 385.1 14,550 41 3250 79.3 20 11,300 565.0
Oct 55,050 23,845 170 140.3 20,710 48 870 18.1 32 19,840 620.0
Nov 73,720 63,859 169 377.9 2780 32 330 10.3 4 2450 612.5
Dec 33,150 27,432 163 168.3 0 7 0 0
627,300 382,457 177.7 127,160 26,230 95.6 100,930 627.6
Standard deviation 107.4 62.7 104.8Water 2020, 12, 1088 8 of 11
(1) the homeport cruises with the largest volumes, between 796 m3 in July to 409 m3 in April,
and mean water withdrawals of 628 m3 ;
(2) the merchants, from mixed and commercial sectors, with mean water withdrawals of 178 m3
by ship, with a peak value of 545 m3 ; and
(3) the transit cruises, with a higher number than the homeport but with the lowest consumption.
The mean volume recharged for the 2016 was 69 m3 with a peak of 218 m3 .
The internal reports of the Port Authority of the Balearic Islands allocate a mean volume of 385 m3
for each homeport cruise arriving to the port. Results showed that the volume was about 20% higher.
5. Discussion and Implications
Water volumes used by the commercial sector in the Port of Palma showed a positive trend over
the last 10 years. Although this evolution is marked by strong seasonality, water use also increased
during the low tourist seasons. The increase of cruise passengers, and specifically the significant
increase of homeport cruises, is remarkable. Data show that this type of cruise uses more water than
other type of vessels in the Port of Palma. The increase in both the carrying capacity of cargo ships
and the capacity of cruise ships explains the increase in commercial traffic and passenger numbers,
without an increase of the number of ships. This is consistent with previous research, where the
accessibility of tourist offerings is a crucial factor [31,34,35], and ‘island fever’ is a major influence for
cruise passengers [36].
Homeports have a different socio-economic and environmental impact than transit cruise ships.
On one hand, homeports have a more severe negative effect on the environment, as they require
transport logistics to be considered (including airplanes, shuttles from airport–port–airport, more CO2
emissions derived from modes of transport, and water). On the other hand, most homeport passengers
do not have time to visit the city, so the economic benefit is less than that of transit cruises. However,
tour operators such as TUI GROUP are betting on consolidating the Port of Palma as a hub port. Palma
has excellent air connections with the British and German markets; therefore, flight prices are much
cheaper than other destinations such as Barcelona, with which Palma has a competitive homeport
relationship [3].
Another reason for the increasing attractiveness of the Port of Palma for homeport cruises and for
recharging water in their ships may be the water price. In 2016, the APB sold 1 m3 of water to cruise
ships for 1.62 €. Although the price increased to 2.62 €/m3 in 2017, it is still a very competitive price for
cruise ships in comparison with other Spanish ports [37]. The APB is excluded from an increasing
block system (the more you consume the more you pay), and it pays only 0.93 €/m3 to the local water
company [38].
The mean water volume loaded by each homeport cruise in 2016 (628,000 liters) can be used as a
water withdrawal indicator when it is divided by the mean passenger number per cruise (the mean
passenger number per cruise ship was 2202 [12]), giving a value of 285.5 liters loaded per passenger.
If some cruise companies, for example TUI, estimate freshwater withdrawals of 162 liters per cruise
passenger night, a value of 180 liters loaded per passenger can be established as a maximum freshwater
volume allowed to load, and this can be considered as a reasonable recommendation to the water
managers at the Port of Palma. In order to establish the most appropriate value, the Port Authority
of the Balearic Islands should make public the water volumes loaded by all ships during the last
years. Liters loaded by passenger seems an optimal water use indicator that can be used in other
ports. This indicator could then be compared with volumes consumed by other touristic activities (like
hotels), or with water withdrawals per capita among the local population, in order to identify potential
conflicts and to establish priorities by the water managers.
The 380,000 m3 of water consumed by the commercial sector in 2018 is an important amount
of water in the municipality of Palma. It represents 80,000 m3 more than the water consumed by
38 four-star hotels offering 6242 rooms per day in the municipality (including hotels in the city center
and in the touristic area of Playa de Palma). In 2018 more than 29 million passengers passed throughWater 2020, 12, 1088 9 of 11
the airport of Palma. AENA, the airport operator in Spain, recognized total water withdrawals of
484,000 m3 in the airport in 2018. It is evident that the increasing cruise activity in the western
Mediterranean ports has an impact on freshwater resources and especially on islands where water
is scarce and intense droughts occur [20–22,39]. The threat of climate change, with longer and more
intense dry periods, emphasizes the rational use of water for activities such as cruise ship tourism that
has a growing social context in the Balearic Islands (e.g., more than 10,000 Majorcan residents signed
a petition calling for a limit of one cruise ship a day docking in Palma, and there have been several
anti-cruise ship protests).
Port authorities should be more transparent and publish the water volumes consumed by the
different commercial activities, as a step in valuing the resource and improving the efficiency of its use.
In this particular study, although the Port Authority shared the data, the main limitation was obtaining
actual total water volumes used in the port. The Port Authority publishes water withdrawals in its
sustainability reports that do not include the water sold to other ships, like cruises, but it was freshwater
supplied by the water company to the Port of Palma and used. The autonomous government of the
Balearic Islands asked the Port Authority of the Balearic Islands to regulate the number of cruise ships
per day docking in Port of Palma and negotiate a moratorium with the major cruise lines, especially
during the tourist season. The president of the Port Authority responded to the regional government,
saying this would be not possible until 2022 due to reservations already made by some ship lines and
for legal assurance. The same request for a cruise regulation at the Port of Palma was made by local
associations and NGOs in 2018, with no answer.
It is unclear how this situation will be solved between the regional government and the Port
Authority, but what is clear from this study is that the increasing homeport cruise ships are demanding
more water every year and increasing the pressure on the already limited water resources of the
island. In 2019, 598 cruise ships arrived in the Port of Palma, and it seems this value will be similar
over the next two years, but probably with more passengers. In 2016, the number of cruises was 487.
Water volumes loaded by ships will increase and will represent high pressure by this touristic sector on
water demand in the city of Palma. Further research is needed in other Mediterranean ports to clarify
the volumes of water loaded by cruises and reported as a water withdrawal indicator (liters loaded per
passenger). Water prices established by each port authority should be published, as it seems that the
price per m3 in the Port of Palma is one of the cheapest in the Mediterranean.
Furthermore, under climate change scenarios (less availability of freshwater in the Mediterranean
region for upcoming decades [26,27]), and taking into account the projected occurrence of more
frequent and severe drought episodes in the region, cruise activity in the Port of Palma must rely on
stricter regulation and on the introduction of cruise traffic limitations. Otherwise, the continuation
of this activity, as it is currently, may no longer be possible, since it will directly clash with water
priority interests.
Author Contributions: Conceptualization, C.G. and D.T.; data curation, C.M.-R. and C.G.; formal analysis,
C.M.-R., E.M.-T. and J.L.-L.; investigation, C.G.; writing—original draft preparation, C.G.; writing—review and
editing, C.G., C.M.-R., E.M.-T., J.L.-L. and D.T. All authors have read and agreed to the published version of
the manuscript.
Funding: This research received no external funding.
Acknowledgments: The Port Authority of the Balearic Islands kindly supplied all the water volumes consumed
by the Port of Palma. We would like to acknowledge its support whenever it was needed, answering emails
quickly and send the data. Special thanks goes to Julio Galán, Josep Aubareda, Jaime Gili and Jorge Martín. We
are grateful to the anonymous reviewers and the editor Emmanuel Reynard for their constructive comments that
helped improve the final manuscript.
Conflicts of Interest: The authors declare no conflicts of interest.Water 2020, 12, 1088 10 of 11
References
1. ESPO Environmental Report 2018. EcoPortsinSights 2018. Available online: https://www.espo.be/media/
ESPOEnvironmentalReport2018.pdf (accessed on 10 March 2020).
2. Puig, M.; Wooldridge, C.; Michail, A.; Darbra, R.M. Current status and trends of the environmental
performance in European ports. Environ. Sci. Policy 2015, 48, 57–66. [CrossRef]
3. Esteve-Perez, J.; Garcia-Sanchez, A. Dynamism patterns of western mediterranean cruise ports and the
coopetition relationships between major cruise ports. Polish Marit. Res. 2018, 25, 51–60. [CrossRef]
4. Carić, H. Cruising Tourism Environmental Impacts: Case Study of Dubrovnik, Croatia. J. Coast. Res. 2011,
61, 104–113. [CrossRef]
5. Legoupil, T. Los conflictos que genera el turismo de cruceros en Barcelona y otros puertos Mediterráneos.
Biblio 3W. Rev. Bibliogr. Geogr. Cienc. Soc. 2013, 18, 13.
6. Dragović, B.; Tzannatos, E.; Tselentis, V.; Meštrović, R.; Škurić, M. Ship emissions and their externalities in
cruise ports. Transp. Res. Part D Transp. Environ. 2018, 61, 289–300. [CrossRef]
7. Carić, H. Challenges and prospects of valuation—Cruise ship pollution case. J. Clean. Prod. 2016, 111,
487–498. [CrossRef]
8. Deidun, A.; Vella, P. Marine Ecological Impact Considerations for Cruise Liner Facility Development at Two
Coastal Sites in the Maltese Islands. J. Coast. Res. 2011, 61, 114–122. [CrossRef]
9. Asero, V.; Skonieczny, S. Cruise Tourism and Sustainability in the Mediterranean. Destination Venice.
In Mobilities, Tourism and Travel Behavior—Contexts and Boundaries; InTechOpen limited: London, UK, 2018;
pp. 93–106.
10. Marques, M. The Cruise Industry in the World. In Managing, Marketing, and Maintaining Maritime and Coastal
Tourism; Mónica Morais de Brito, D.A., Patuleia, M., Eds.; IGI Global: Hershey, PA, USA, 2020; pp. 223–232.
11. Rosa-Jiménez, C.; Perea-Medina, B.; Andrade, M.J.; Nebot, N. An examination of the territorial imbalance of
the cruising activity in the main Mediterranean port destinations: Effects on sustainable transport. J. Transp.
Geogr. 2018, 68, 94–101. [CrossRef]
12. Medcruise Cruise Activities in MedCruise Ports. Statistics Report 2018; MedCruise Association: Santa Cruz
de Tenerife, Spain, 2019.
13. Karlis, T.; Polemis, D. Cruise homeport competition in the Mediterranean. Tour. Manag. 2018, 68, 168–176.
[CrossRef]
14. Vega-Muñoz, A.; Arjona-Fuentes, J.M.; Ariza-Montes, A.; Han, H.; Law, R. In search of ‘a research front’ in
cruise tourism studies. Int. J. Hosp. Manag. 2019, 102353. [CrossRef]
15. Papathanassis, A.; Beckmann, I. Assessing the “poverty of cruise theory” hypothesis. Ann. Tour. Res. 2011,
38, 153–174. [CrossRef]
16. Véronneau, S.; Roy, J. Global service supply chains: An empirical study of current practices and challenges
of a cruise line corporation. Tour. Manag. 2009, 30, 128–139. [CrossRef]
17. Bonilla-Priego, M.J.; Font, X.; del Pacheco-Olivares, M.R. Corporate sustainability reporting index and
baseline data for the cruise industry. Tour. Manag. 2014, 44, 149–160. [CrossRef]
18. TOUI Group 2018 Sustainability Report. Available online: https://www.tuigroup.com/damfiles/default/
tuigroup-15/de/nachhaltigkeit/berichterstattung-downloads/2019/nachhaltigkeitsbericht-de-en/TUI_
CSR18_EN.pdf-1e195dc4f0aff3763334c790e5417049.pdf (accessed on 9 March 2020).
19. Stefanidaki, E.; Lekakou, M. Cruise carrying capacity: A conceptual approach. Res. Transp. Bus. Manag.
2014, 13, 43–52. [CrossRef]
20. Viola, F.; Sapiano, M.; Schembri, M.; Brincat, C.; Lopez, A.; Toscano, A.; Diamadopoulos, E.; Charalambous, B.;
Molle, B.; Zoumadakis, M.; et al. The state of water resources in major Mediterranean islands. Water Resour.
2014, 41, 639–648. [CrossRef]
21. Lorenzo-Lacruz, J.; Moran-Tejeda, E. Spatio-temporal patterns of meteorological droughts in the Balearic
Islands (Spain). Geogr. Res. Lett. 2016, 42, 49. [CrossRef]
22. Lorenzo-Lacruz, J.; Garcia, C.; Morán-Tejeda, E. Groundwater level responses to precipitation variability in
Mediterranean insular aquifers. J. Hydrol. 2017, 552. [CrossRef]
23. Hof, A.; Blázquez-Salom, M. Changing tourism patterns, capital accumulation, and urban water consumption
in Mallorca, Spain: A sustainability fix? J. Sustain. Tour. 2015, 23, 770–796. [CrossRef]Water 2020, 12, 1088 11 of 11
24. Deyà-Tortella, B.; Garcia, C.; Nilsson, W.; Tirado, D. Analysis of Water Tariff Reform on Water Consumption
in Different Housing Typologies in Calvi. Water 2017, 9, 425. [CrossRef]
25. Garcia, C.; Servera, J. Impacts of tourism development on water demand and beach degradation on the
island of Mallorca (Spain). Geogr. Ann. Ser. A-Phys. Geogr. 2003, 85, 287–300. [CrossRef]
26. Giorgi, F.; Lionello, P. Climate change projections for the Mediterranean region. Glob. Planet. Chang. 2008, 63,
90–104. [CrossRef]
27. García-Ruiz, J.M.; López-Moreno, J.I.; Vicente-Serrano, S.M.; Lasanta-Martínez, T.; Beguería, S. Mediterranean
water resources in a global change scenario. Earth-Sci. Rev. 2011, 105, 121–139. [CrossRef]
28. Diffenbaugh, N.S.; Pal, J.S.; Giorgi, F.; Gao, X. Heat stress intensification in the Mediterranean climate change
hotspot. Geophys. Res. Lett. 2007, 34, 1–6. [CrossRef]
29. Memoria de Sostenibilidad. Available online: https://www.portsdebalears.com/es/memoria-sostenibilidad-
2018 (accessed on 27 January 2020).
30. IBESTAT Indicador de Pressió Humana. Available online: https://ibestat.caib.es/ibestat/estadistiques/
poblacio/estudis-demografics/indicador-pressio-humana-iph/e91ffb58-6bdd-457c-bd25-ed2a201f57ae
(accessed on 10 March 2020).
31. Gui, L.; Paolo Russoz, A. Cruise ports: A strategic nexus between regions and global lines-evidence from the
mediterranean. Marit. Policy Manag. 2011. [CrossRef]
32. IGN Plan Nacional de Ortofotografía Aérea. Available online: https://pnoa.ign.es/ortofotos (accessed on
27 January 2020).
33. Yue, S.; Pilon, P.; Phinney, B. Canadian streamflow trend detection: Impacts of serial and cross-correlation.
Hydrol. Sci. J. 2003, 48, 51–64. [CrossRef]
34. Bagis, O.; Dooms, M. Turkey’s potential on becoming a cruise hub for the East Mediterranean Region:
The case of Istanbul. Res. Transp. Bus. Manag. 2014, 13, 6–15. [CrossRef]
35. Pino, G.; Peluso, A.M. The development of cruise tourism in emerging destinations: Evidence from Salento,
Italy. Tour. Hosp. Res. 2018, 18, 15–27. [CrossRef]
36. Castillo-Manzano, J.I.; Fageda, X.; Gonzalez-Laxe, F. An analysis of the determinants of cruise traffic:
An empirical application to the Spanish port system. Transp. Res. Part E 2014, 66, 115–125. [CrossRef]
37. Boulben el Ghachaoui, S. Análisis Económico y Comparativo de la Producción de Agua Dulce Mediante un Generador
a Bordo de un Buque Mercante; Universitat Politècnica de Catalunya: Barcelona, Spain, 2013.
38. EMAYA Water Tariffs. Available online: http://www.caib.es/eboibfront/es/2016/10595/589329/publicacion-
nuevas-tarifas-de-emaya-2017 (accessed on 31 January 2020).
39. Ramis, C.; Romero, R.; Homar, V.; Alonso, S.; Jansà, A.; Amengual, A. On the drought in the Balearic Islands
during the hydrological year 2015–2016. Nat. Hazards Earth Syst. Sci. 2017, 17, 2351–2364. [CrossRef]
© 2020 by the authors. Licensee MDPI, Basel, Switzerland. This article is an open access
article distributed under the terms and conditions of the Creative Commons Attribution
(CC BY) license (http://creativecommons.org/licenses/by/4.0/).You can also read