Genetic Traces of the Francisella tularensis Colonization of Spain, 1998-2020 - MDPI
←
→
Page content transcription
If your browser does not render page correctly, please read the page content below
microorganisms
Article
Genetic Traces of the Francisella tularensis
Colonization of Spain, 1998–2020
Kerstin Myrtennäs 1, * , Raquel Escudero 2 , Ángel Zaballos 2 , Rosa González-Martín-Niño 2 ,
Miklós Gyuranecz 3 and Anders Johansson 4
 1   Division of CBRN Defence and Security, Swedish Defence Research Agency (FOI), 90182 Umeå, Sweden
 2   Instituto de Salud Carlos III, Centro Nacional de Microbiología, 28220 Madrid, Spain;
     rescude@isciii.es (R.E.); azaballos@isciii.es (Á.Z.); rmgonzalez@isciii.es (R.G.-M.-N.)
 3   Institute for Veterinary Medical Research, Centre for Agricultural Research, Hungária körút 21,
     1143 Budapest, Hungary; m.gyuranecz@gmail.com
 4   Department of Clinical Microbiology, Umeå University, SE-901 87 Umeå, Sweden;
     anders.f.johansson@umu.se
 *   Correspondence: kerstin.myrtennas@foi.se

 Received: 23 October 2020; Accepted: 12 November 2020; Published: 14 November 2020

 Abstract: More than 1000 humans have acquired the febrile disease tularemia in Spain since the first
 notification of human cases in 1997. We here aimed to study the recent molecular evolution of the
 causative bacterium Francisella tularensis during disease establishment in Spain. Single-nucleotide
 polymorphisms (SNPs) and variable-number tandem repeats (VNTRs) were analyzed in whole-genome
 sequences (WGS) of F. tularensis. Short-read WGS data for 20 F. tularensis strains from humans infected
 in the periods 2014–2015 and 2018–2020 in Spain were generated. These data were combined with
 WGS data of 25 Spanish strains from 1998 to 2008 and two reference strains. Capillary electrophoresis
 data of VNTR genetic regions were generated and compared with the WGS data for the 11 strains
 from 2014 to 2015. Evolutionary relationships among strains were analyzed by phylogenetic methods.
 We identified 117 informative SNPs in a 1,577,289-nucleotide WGS alignment of 47 F. tularensis genomes.
 Forty-five strains from Spain formed a star-like SNP phylogeny with six branches emerging from a
 basal common node. The most recently evolved genomes formed four additional star-like structures
 that were derived from four branches of the basal common node. VNTR copy number variation was
 detected in two out of 10 VNTR regions examined. Genetic clustering of strains by VNTRs agreed
 with the clustering by SNPs. The SNP data provided higher resolution among strains than the VNTRs
 data in all but one cases. There was an excellent correlation between VNTR marker sizing by capillary
 electrophoresis and prediction from WGS data. The genetic data strongly support that tularemia,
 indeed, emerged recently in Spain. Distinct genetic patterns of local F. tularensis population expansions
 imply that the pathogen has colonized a previously disease-free geographical area. We also found that
 genome-wide SNPs provide higher genetic resolution among F. tularensis genomes than the use of
 VNTRs, and that VNTR copy numbers can be accurately predicted using short-read WGS data.

 Keywords: Spain; tularemia;                Francisella;    SNP; VNTR; NGS; sequencing;       colonization;
 evolution; epidemiology

1. Introduction
     Francisella tularensis causes the zoonotic disease tularemia. In Europe, the F. tularensis subspecies
holarctica is the causative agent often resulting in a febrile, long-lasting disease characterized by lymph
node enlargement among humans (type B tularemia) but with a rate of mortality less than one percent.
In North America, type B tularemia exists side by side with type A tularemia, a disease that is caused

Microorganisms 2020, 8, 1784; doi:10.3390/microorganisms8111784          www.mdpi.com/journal/microorganisms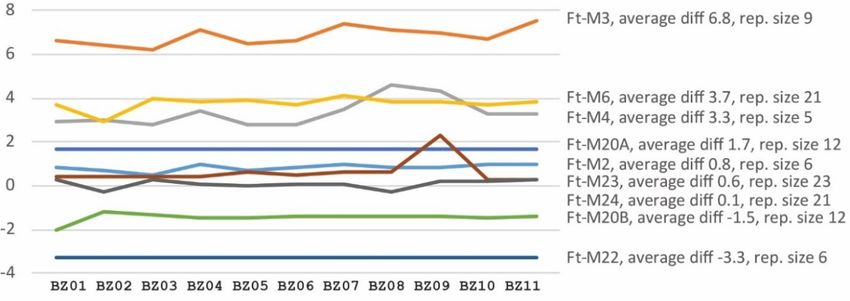
Microorganisms 2020, 8, 1784                                                                              2 of 14

by the F. tularensis subspecies tularensis, with a mortality among humans of several percent. Infected
insect or tick bites or direct contact with sick small mammals are common routes of infection for
humans in both types of tularemia [1]. It appears that F. tularensis can persist locally somewhere in the
environment between seasonal outbreaks of disease [2–6]. The advancement of genetic typing methods
for F. tularensis has shown that the evolution of F. tularensis is clonal, that the subspecies holarctica
evolved recently, and that this subspecies has successfully spread across large geographical distances
in Europe [7–12]. The limited genetic variation and the clonal inheritance pattern of this bacterium are
helpful properties in the interpretation of the genetic kinship of F. tularensis. Commonly used genetic
markers for evolutionary and epidemiology studies of F. tularensis include multi-locus variable-number
tandem repeats (VNTRs) [13–15] and single-nucleotide polymorphisms (SNPs) mapped in a few genes
or at the whole genome scale [7–12]. It has been argued that markers with a more rapid evolution,
such as VNTRs, could be especially useful for tracking the recent evolution of F. tularensis [13], but it is
unknown if this property of VNTRs provides as much discrimination as the more recent approach of
mapping SNPs in the full genome of the bacterium using whole-genome sequencing (WGS) [14,16].
     In Spain, tularemia was first reported in 1997 when an outbreak affected 585 humans [17]. More than
1000 patients have since been reported, with a geographical focus of disease in the autonomous community
of Castilla y León. All the infections in humans and animals in Spain appear to be caused by a single,
genetically extremely-coherent subpopulation of F. tularensis subspecies holarctica [16]. This situation with
intense disease activity and a recent disease introduction should provide an excellent opportunity for
investigating bacterial evolution in a natural environment. Bacteria cultured from infected individuals in
recurrent outbreaks in Spain can provide evolutionary snap-shots of an F. tularensis population of very
recent common ancestry.
     The choice of genetic markers for evolutionary and epidemiology studies of F. tularensis has,
to some extent, been influenced by the technology available for mapping the markers. VNTRs were
popular markers when capillary electrophoresis for detecting VNTR copy-number variation became
widely available in the late 1990s [14,18]. A few years later, when short-read WGS, which was ideal to
reliably map SNPs, became cheaper and widely available, VNTRs were more or less abandoned [8].
     Here, we describe the recent molecular evolution of F. tularensis in Spain by utilizing short-read
WGS data. We have investigated the relationship between two types of genetic markers, VNTRs and
SNPs, in these data. In addition, we investigated the reliability of predicting VNTR copy numbers
from WGS data by comparison with capillary electrophoresis data.

2. Materials and Methods

2.1. Strains
     Twenty F. tularensis strains isolated from humans in 2014–2015 and 2018–2020 and 25 strains
isolated in 1998 and 2007–2008 in the autonomous community of Castila y León, Spain, were included
(Table 1). The latter 25 strains were previously genome-sequenced [16] (summarized in Appendix A
Table A1). In addition, reference strains from Italy (FSC031; O-407) and France (FTNF002-00 (FTA)
GenBank acc. no. CP000803.1.) were included.

                Table 1. Francisella tularensis strains from 20 human specimens in Spain, 2014–2020.

             ID                 Source               Transmission Related to         Year     Province
           BZ01                Skin ulcer                    Crayfish                2014      Palencia
           BZ02                Skin ulcer                    Crayfish                2014      Palencia
           BZ03                Skin ulcer           Crayfish/rodents/gardening       2014      Palencia
           BZ04                Skin ulcer           Crayfish/countryside walks       2014      Palencia
           BZ05                  Blood                  Rodent/agriculture           2014      Palencia
           BZ06                Skin ulcer                    Crayfish                2014      Palencia
           BZ07                  Blood                    Country house              2014      Palencia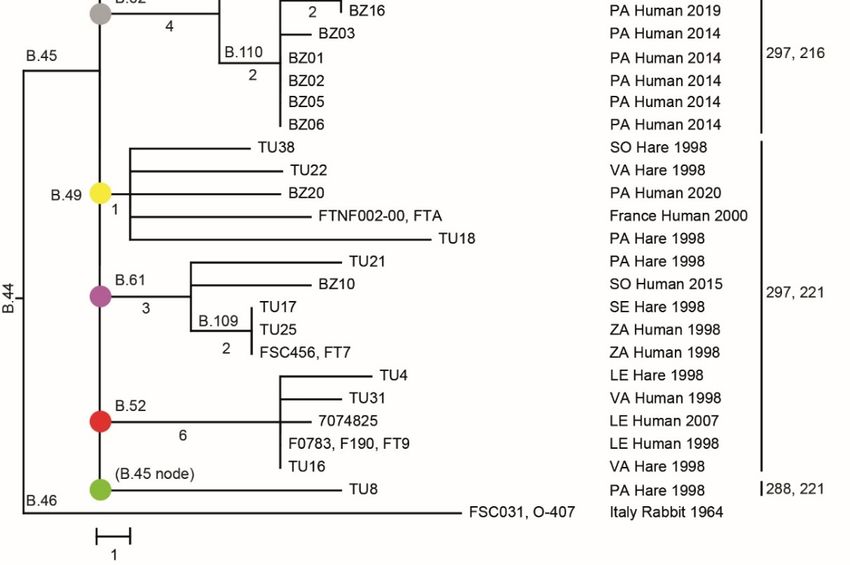
Microorganisms 2020, 8, 1784                                                                         3 of 14

                                                 Table 1. Cont.

             ID                Source              Transmission Related to      Year    Province
                       Transbronchial needle
           BZ08                                          Environment            2014     Burgos
                      aspiration of lymph node
           BZ09               Skin ulcer                  Hunting               2014      Leon
           BZ10               Skin ulcer                  Hunting               2015      Soria
           BZ11                 Blood                   Not available           2015     Palencia
           BZ12                 Blood                     Farming               2018     Palencia
           BZ13             Skin abscess                  Crayfish              2019     Burgos
           BZ14                 Blood                    Gardening              2019     Palencia
           BZ15         Lymph node abscess              Not available           2019      León
           BZ16         Lymph node abscess                Crayfish              2019     Palencia
           BZ17               Skin ulcer                  Crayfish              2019     Burgos
           BZ18               Skin ulcer                  Hunting               2019     Palencia
           BZ19                 Blood                   Not available           2020     Palencia
           BZ20         Lymph node abscess            Countryside walks         2020     Palencia

2.2. Genome Sequencing
     The 20 strains isolated in 2014–2015 and 2018–2020 were cultivated on cysteine heart agar
supplemented with 9% chocolatized red blood cells (CHAB). DNA was prepared and purified using
the QIAamp DNA mini kit (Qiagen, Hilden, Germany). A library was prepared using the Nextera
XT kit and sequenced at the Centro Nacional de Microbiología-Instituto de Salud Carlos III, Genomic
Unit, on a MiSeq instrument (Illumina Inc., San Diego, CA, USA), which produced 2 × 300 bp pair-end
read data. The genomes were assembled using ABySS 1.5.1 [19] and submitted to GenBank under
BioProject accession number PRJNA548692.

2.3. Taxonomic Classification
     Each genome was assigned to a genetic clade using CanSNPer [20,21]. Upon detection of a new
clade with at least two taxa, this clade was given a new taxonomic canSNP index following the scheme
at Github [20]. One SNP per branch was selected to define the whole branch.

2.4. Sizing of PCR Products Targeting VNTRs with Capillary Electrophoresis and Genome Sequencing
     PCR product capillary electrophoretic sizing, or fragment analysis for short, of ten VNTRs (Ft-M2,
Ft-M3, Ft-M4, Ft-M5, Ft-M6, Ft-M10, Ft-M20, Ft-M22, Ft-M23, and Ft-M24) was performed at the
Institute for Veterinary Medical Research, Hungarian Academy of Science, on an ABI Prism 3100
Genetic Analyzer (Applied Biosystems, Foster City, CA, USA) using primers described in Appendix A
Table A2, and under the following conditions: the PCRs were done in single-plex in a 25-µL volume
using 0.5–2 µL of each primer, 1 µL DNA template, and a reaction mixture with 5 µL 5× Colorless
GoTaq Flexi Buffer (Thermo Fisher Scientific, Waltham, MA, USA), 2 µL 25 mM MgCl2 (Thermo
Fisher Scientific), 0.8 µL 10 mM dNTP (Thermo Fisher Scientific), and 0.2–0.4 µL GoTaq Polymerase
(5 unit/µL) (Thermo Fisher Scientific). The cycling conditions were 94 ◦ C for 5 min and then 35 cycles
with denaturation at 94 ◦ C for 30 s, primer annealing at 58 ◦ C for 30 s, and extension at 72 ◦ C for 30 s.
The program ended with a final extension at 72 ◦ C for 30 s [21]. The PCR product size was determined
with Peak ScannerTM Software v.1.0 (Applied Biosystems). These ten markers have previously been
used to subtype the subspecies holarctica from Europe [13]. The marker Ft-M20 was targeted using two
assays—Ft-M20A and Ft-M20B.
     Sizing of PCR products was performed using an in-house Python script by mapping the primer
sequences to each genome.
Microorganisms 2020, 8, 1784                                                                      4 of 14

2.5. Phylogenetics and Phylogeography
     Single-nucleotide polymorphisms and genetic distances among the strains were determined using
a whole-genome alignment produced by progressiveMauve with default settings. A neighbor-joining
tree based on the core of the 47 genomes was constructed in MEGAX (Tamura et al.) with the number
of differences method and complete deletion. The SNP phylogeny was compared with VNTR marker
patterns. The geographical and temporal distributions of F. tularensis strains belonging in different
phylogenetic clades were analyzed for the seven provinces of Spain experiencing tularemia outbreaks.

3. Results

3.1. Genome Sequencing, Assembly and SNP Identification
      We performed short-read sequencing and created new genome assemblies for 20 F. tularensis
isolates cultured from diagnostic specimens of humans infected in Spain in 2014–2015 and 2018–2020.
The assemblies typically consisted of 100 contigs with ends corresponding to the multiple copy insertion
sequence elements ISFtu1 or ISFtu2 or the multiple copy ribosomal operon of F. tularensis (Appendix A,
Table A3). The mean sequence depth (genome coverage) ranged from 89 to 578. These new sequence
data were analyzed together with previously published genome sequence assemblies of 25 F. tularensis
genomes from Spain using a common analysis pipeline. This resulted in a core genome of 1,577,289 nt,
including genes and intergenic regions excluding multiple copy insertion sequence elements and
ribosomal operons representing 45 genomes from Spain and two closely related reference genomes from
Italy and France. The core genome size corresponds to 88% of the total reference genome of the strain
SCHU S4, including its multiple copy insertion sequence elements and ribosomal operons. We found
117 SNPs in the core genome of the 47 genomes analyzed in this work (Figure 1), corresponding to a
core genome identity of 99.9925%.

3.2. Taxonomic Classification
     To facilitate future comparisons with genomes included in this study, all genomes were assigned
to the general taxonomic system built on canSNPs of F. tularensis. To this end, 34 SNPs defined 13
genetic clades having more than one member among the 47 strains, i.e., these canSNPs were not
strain-specific (Appendix A, Table A4). Five of the 13 genetic clades were new to this study and the
four branches leading to these new clades were indexed from B.107 to B.110 and B.315. One canonical
SNP per new branch was selected to represent each branch as follows: B.107 (canSNP 520,520), B.108
(1,327,297), B.109 (1,082,513), B.110 (1,301,561), and B.315 (1,721,277), with the positions in brackets
referring to the genome FTNF002-00 (FTA) with GenBank acc. no. CP000803.1. The canSNP typing
scheme is available at Github [20], including the five new canSNPs described in this work.

3.3. Analysis of VNTRs by Short Read Genome Sequencing and Capillary Electrophoresis
     To investigate if VNTR copy numbers in F. tularensis genomes can be predicted using short-read
genome sequence data, we compared PCR product capillary electrophoretic VNTR sizing versus sizes
from short-read data. We found that only two VNTR markers out of the ten VNTR markers tested by
capillary electrophoresis varied between the 47 F. tularensis strains (Appendix A, Tables A5 and A6).
Data for the two variable markers, that are named Ft-M3 and Ft-M4, can be found in Table 2 for
the 11 genomes with WGS data generated in this study. No variation was observed for any other
marker among the 47 strains (Ft-M2, Ft-M5, Ft-M6, Ft-M10, Ft-M20A, Ft-M20B, Ft-M22, Ft-M23, and
Ft-M24 were invariable). Comparison of VNTR sizes predicted from capillary electrophoresis fragment
analysis versus WGS data revealed that the size estimates were consistent across different genomes
(Figure 2 and Appendix A Table A7). The analysis showed that translation from VNTR sizes obtained
by fragment analysis to true VNTR sizes in the WGS data needs marker-specific correction of the
former, and that this is especially important for markers with a short repeat size (
Microorganisms 2020, 8, x FOR PEER REVIEW 5 of 14 fragment analysis versus WGS data revealed that the size estimates were consistent across different genomes (Figure 2 and Appendix A Table A7). The analysis showed that translation from VNTR sizes Microorganisms 2020, 8, 1784 5 of 14 obtained by fragment analysis to true VNTR sizes in the WGS data needs marker-specific correction of the former, and that this is especially important for markers with a short repeat size (
Microorganisms 2020, 8, 1784 6 of 14
(Figure 1). Four additional polytomies were present among the downstream branching patterns of the
tree. The SNP inheritance pattern along the different branching structures of the tree was strictly clonal,
i.e., there were no SNPs that were inconsistent with the tree structure. The genetic clustering by VNTR
markers agreed to the clustering by SNPs, although the VNTR markers in all but one cases resulted in a
lower resolution among taxa (Figure 1, strains 3640 and 6434). There were, in total, 23 SNP genotypes
Microorganisms 2020, 8, x FOR PEER REVIEW 6 of 14
that matched six VNTR genotypes.
Table 2. Capillary electrophoresis sizing of VNTR markers Ft-M3 and Ft-M4 in relation to nucleotide
Table 2. Capillary electrophoresis sizing of VNTR markers Ft-M3 and Ft-M4 in relation to nucleotide
size data determined by WGS of 11 F. tularensis genomes from 2014 to 2015, Spain.
size data determined by WGS of 11 F. tularensis genomes from 2014 to 2015, Spain.
Ft-M3 Ft-M4
(9 bp Ft-M3
Repeat Size) Ft-M4Size)
(5 bp Repeat
(9 bp Repeat Size) (5 bp Repeat Size)
ID No. Repeats Assay WGS No. Repeats Assay WGS
IDBZ01 No. Repeats
8 Assay
303.6 WGS
297 No. Repeats
1 Assay
218.9–219.9 WGS
216
BZ01
BZ02 8 8 303.6
303.4 297
297 11 218.9–219.9
219.0 216216
BZ02
BZ03 8 8 303.4
303.2 297
297 11 219.0
218.8–219.8 216216
BZ03
BZ04 8 9 303.2
313.1 297
306 21 218.8–219.8
224.4 221216
BZ04 9 313.1 306 2 224.4 221
BZ05 8 303.5 297 1 218.8–219.8 216
BZ05 8 303.5 297 1 218.8–219.8 216
BZ06
BZ06 8 8 303.6
303.6 297
297 11 218.8–219.8
218.8–219.8 216216
BZ07
BZ07 9 9 313.4
313.4 306
306 22 224.5
224.5 221221
BZ08
BZ08 9 9 313.1
313.1 306
306 22 225.6
225.6 221221
BZ09
BZ09 9 9 313.0
313.0 306
306 22 225.3
225.3 221221
BZ10
BZ10 8 8 303.7
303.7 297
297 22 224.3
224.3 221221
BZ11
BZ11 9 9 313.5
313.5 306
306 22 224.3
224.3 221221
Figure 2. Difference
Figure between
2. Difference between VNTR
VNTRPCRPCRproduct
productsizes determined
sizes determinedbybycapillary
capillaryelectrophoresis
electrophoresisand
andby
WGS data. Eleven F. tularensis strains from 2014 to 2015 are named along the X-axis. Dissimilarities
by WGS data. Eleven F. tularensis strains from 2014 to 2015 are named along the X-axis. Dissimilarities
in the sizesize
in the estimates
estimates(no.
(no.ofofnucleotides)
nucleotides)are
are shown
shown on the Y-axis.
on the TheFt-M5
Y-axis. The Ft-M5andandFt-M10
Ft-M10data
dataareare
incomplete
incomplete because these VNTR loci are adjacent to a large insertions-sequence element at the end of of
because these VNTR loci are adjacent to a large insertions-sequence element at the end
contigs in the
contigs WGS
in the WGS data.
data.
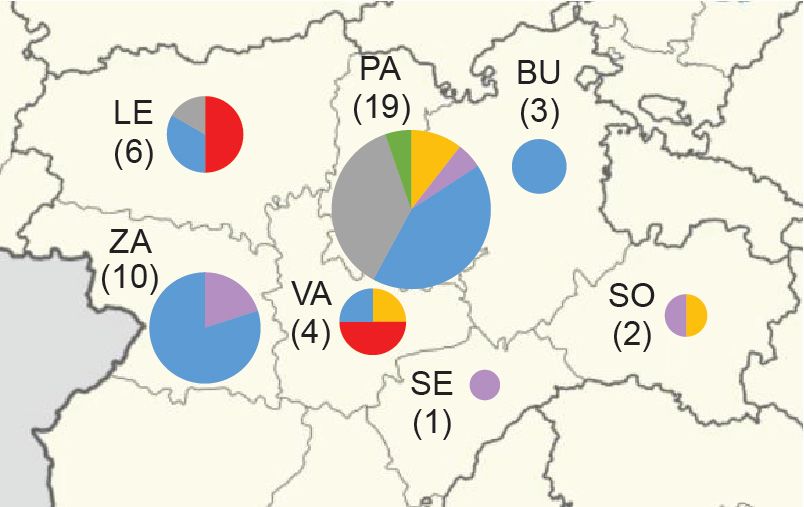
3.5. Phylogeography
3.4. Phylogenetic Analysis Using SNP or VNTR Data
The phylogeography
The phylogenetic tree of six
basedmajor clades
on 117 coreincluding 45 F. tularensis
SNPs displayed a star-likestrains
shapewith
witha known
multipleplace
hard of
isolation in seven Spanish provinces is shown in Figure 3. The total diversity
polytomies, of which the most basal polytomy had six tree branches corresponding to genetic at the clade level and
their spatiotemporal distribution is illustrated in Figures 1 and 4. Most strains
distances ranging from 1 to 8 nt, emerging from a common node representing the most recent and the largest genetic
diversity
common were from the
ancestor province
(Figure 1). Fourof Palencia.
additionalWe found that
polytomies F. tularensis
were strains the
present among belonging to two
downstream
distinct clades,
branching B.108 and
patterns B.110,
of the tree.caused
The SNP theinheritance
2014–2015 pattern
human along
tularemia outbreaks
the different in Palencia.
branching Notably,
structures
we of
found thatwas
the tree a single strain
strictly ancestral
clonal, to B.110,
i.e., there were named
no SNPsPA-21739,
that werewas isolated from
inconsistent withathe
human in Palencia
tree structure.
as early as 2007.clustering
The genetic In 2018–2019, strainsmarkers
by VNTR of a newagreed
subclade, B.315,
to the which isbyclosely
clustering SNPs,related to B.110,
although caused
the VNTR
newmarkers in allinbut
outbreaks one cases
Palencia. Inresulted
contrastintoa this
lower resolution
regional among
pattern of taxa (Figure
genetic 1, strains 3640
homogeneity overand
time,
6434). There were, in total, 23 SNP genotypes that matched six VNTR genotypes.
Palencia strains from 2020 were genetically more diverse, belonging in B.49 and B.56. The diversity
3.5. Phylogeography
The phylogeography of six major clades including 45 F. tularensis strains with a known place of
isolation in seven Spanish provinces is shown in Figure 3. The total diversity at the clade level and
their spatiotemporal distribution is illustrated in Figure 1 and Figure 4. Most strains and the largestMicroorganisms 2020, 8, x FOR PEER REVIEW 7 of 14
two distinct clades, B.108 and B.110, caused the 2014–2015 human tularemia outbreaks in Palencia.
Notably, we found that a single strain ancestral to B.110, named PA-21739, was isolated from a human
Microorganisms 2020, 8,
in Palencia as1784
early as 2007. In 2018–2019, strains of a new subclade, B.315, which is closely related to 7 of 14
B.110, caused new outbreaks in Palencia. In contrast to this regional pattern of genetic homogeneity
over time, Palencia strains from 2020 were genetically more diverse, belonging in B.49 and B.56. The
was apparently present
diversity was in Palencia
apparently present already in 1998,
in Palencia as we
already found
in 1998, single
as we isolates
found single obtained from hares in
isolates obtained
three diverse major
from hares in clades, B.49,major
three diverse B.61, clades,
and B.45.
B.49,The
B.61,largest genetic
and B.45. distance
The largest within
genetic a clade
distance with
within a strains
clade with strains from Spain was 15 SNPs and was found between two strains
from Spain was 15 SNPs and was found between two strains from Palencia in 1998 and 2020 (clade from Palencia in 1998
and 2020 (clade B.49). The human epidemiological data connected to the 20 F. tularensis strains from
B.49). The human epidemiological data connected to the 20 F. tularensis strains from 2014–2015 and
2014–2015 and 2018–2020 suggested that the disease had been acquired during outdoor activities
2018–2020 suggested
(Table 1).
that the disease had been acquired during outdoor activities (Table 1).
Figure 3.Figure 3. Phylogeography
Phylogeography of 45
of 45 F. tularensisstrains
F. tularensis strains with
witha aknown
knownplace of isolation
place in seven
of isolation in Spanish
seven Spanish
provinces from 1998 to 2020. Major phylogenetic clades are labelled by colors corresponding to Figure
provinces from 1998 to 2020. Major phylogenetic clades are labelled by colors corresponding to Figure 1.
1. Province labels are Burgos (BU), León (LE), Palencia (PA), Segovia (SE), Soria (SO), Valladolid (VA),
Province labels are Burgos (BU), León (LE), Palencia (PA), Segovia (SE), Soria (SO), Valladolid (VA),
and Zamora (ZA). The number of genomes is within round brackets.
and Zamora
Microorganisms (ZA).
2020, ThePEER
8, x FOR number of genomes is within round brackets.
REVIEW 8 of 14
Figure4.4.Timing
Figure Timing and
and size
size of
of F.
F. tularensis
tularensis genetic
genetic clades.
clades. Horizontal
Horizontallines represent
lines thethe
represent different
different
phylogenetic clades over time. The circle size represents the number of genomes, with grey shades
phylogenetic clades over time. The circle size represents the number of genomes, with grey shades
distinguishing different provinces. The major phylogenetic clades are color-coded on the Y-axis,
distinguishing different provinces. The major phylogenetic clades are color-coded on the Y-axis,
corresponding to Figure 1. Provinces are Burgos (BU), León (LE), Palencia (PA), Segovia (SE), Soria
corresponding to Figure 1. Provinces are Burgos (BU), León (LE), Palencia (PA), Segovia (SE), Soria (SO),
(SO), Valladolid (VA), and Zamora (ZA).
Valladolid (VA), and Zamora (ZA).
4. Discussion
The introduction of tularemia into Spain offered an opportunity to study the recent molecular
evolution of F. tularensis in relation to disease emergence in a new geographical area. We found an
evolutionary pattern strongly suggesting recent pathogen population expansion in Spain. The data
are consistent with epidemiological records of recent disease import into Spain and show that the F.Microorganisms 2020, 8, 1784 8 of 14
4. Discussion
The introduction of tularemia into Spain offered an opportunity to study the recent molecular
evolution of F. tularensis in relation to disease emergence in a new geographical area. We found an
evolutionary pattern strongly suggesting recent pathogen population expansion in Spain. The data
are consistent with epidemiological records of recent disease import into Spain and show that the
F. tularensis population size has rapidly increased locally, now causing disease among large numbers of
humans and small mammals. We also found that two types of evolutionary marker in the F. tularensis
genomes, SNPs and VNTRs, essentially tell the same story.
The analysis of 20 new F. tularensis genomes from 2014 to 2015 and 2018 to 2020 and 25 older
genomes of strains from 1998 and 2007–2008, revealed a star-like phylogeny with six branches emerging
from a common basal node, a pattern supporting a recent pathogen population expansion. A basal
star-like structure was accompanied by additional star-like branching structures further out on the
tree branches signifying that the initial population expansion was followed by additional population
expansions within the country. We previously reported a star-like phylogeny for F. tularensis in an
investigation of disease introduction from more Eastern countries into Western Europe as a whole, but it
was not as pronounced as observed here [16]. Other recent reports of the migration pattern of F. tularensis
in Europe include studies from France, Switzerland, Germany, and Austria [22–25]. The star-like
phylogenetic pattern seen here is an example of rapidly increasing biodiversity at the subspecies level of
a genetically monomorphic infectious agent. The phenomenon as such, however, is more often described
at a higher taxonomic level in eukaryotic species and is named evolutionary radiation, one of the
examples being Darwin’s finches. In the current work, we have captured bacterial subpopulations that
are in very early stages of increasing biodiversity connoted by star-like structures in analyses of bacterial
WGS data. Evolutionary theory predicts that the number of star-like structures (evolutionary radiations)
will be reduced with evolutionary time, as genetic variants within an evolutionary radiation become
extinct by random and selection effects; see Simões et al. for a review of the current understanding of
genetic radiation patterns [26]. Indeed, star-like structures appear to get lost over time in F. tularensis.
In countries with long-term tularemia endemicity, e.g., in Sweden, Norway, or Turkey [7,11,12], having
large disease outbreaks since many decades, F. tularensis WGS star phylogenies are rare and found at
the tree tips only. In these countries, phylogenies are characterized by long tree branches between major
genetic groups of strains, each major group having many unique genotypes. In line with evolutionary
predictions, these long tree branches represent the few bacterial genetic lineages that did not become
extinct during long-term evolution. A recent genome comparison of 350 F. tularensis strains from France,
where tularemia emerged between 1940 and 1950, provides additional support for this scenario with
star-like phylogeny formation followed by random extinction of genetic variants over longer time
frames [25]. The comprehensive analysis of F. tularensis genomes from France showed the emergence of
longer tree branches separating star-like structures at the tip of the phylogenetic tree. The stars at the
tree-tips among the genomes from France generally represented strains of recent origin, isolated after
1990. Taken together, these earlier findings from Sweden, Norway, Turkey, and France coupled to the
present findings from Spain support that WGS analyses of F. tularensis provide some information about
how long tularemia has been endemic in a particular geographical area.
A probable explanation of the rapid expansion of F. tularensis populations in Castilla-y-León, Spain,
is that human activities have created excellent opportunities for pathogen expansion. The F. tularensis
subspecies holarctica is known to be associated with water [27], and common disease transmission
paths to humans include vector bites, crayfish fishing, and contact with infected mammals [27–29].
The natural climate of Castilla-y-León, however, is hostile to F. tularensis subspecies holarctica, with hot
and dry summers and mesic habitats that restrict the abundance of ticks. To solve the problem of
agricultural drought, an extensive network of irrigation water canals and ditches have been established
from the 1970s to 1990s. This solution, at the same time, provides an excellent habitat for F. tularensis
subspecies holarctica to survive and replicate [30]. The irrigation system has caused an explosion of voles
in the irrigated fields. As voles easily get tularemia, these animals can serve to amplify the expansion ofMicroorganisms 2020, 8, 1784 9 of 14
F. tularensis populations. The beginning of the tularemia outbreak in Spain in 1997 coincides with this
change in the local ecology. Additional sampling in irrigation channels, rivers, and lagoons and animals
in 2016–2017 has confirmed the presence of F. tularensis in water, sediments, hares, and ticks in the local
area (personal communications, M Dolores Vidal, Instituto de Salud Carlos III, Madrid, Spain).
We also wanted to investigate if WGS data are suitable for predicting VNTR copy numbers in
F. tularensis because these markers are known to evolve fast and may complement SNPs as markers of
recent evolution. Our results show that capillary electrophoresis sizing is not any longer necessary for
obtaining VNTR data in F. tularensis. Both SNP and VNTR data can be extracted from the same WGS
short reads, meaning that draft sequencing provides a simpler, faster, and cheaper method for VNTR
typing. Our work further illustrates the need for marker-specific correction when using capillary
electrophoresis sizing of VNTRs, which, if not performed, complicates comparison between studies.
Finally, we found, contradictory to the assumption that VNTRs evolve faster than SNPs and, therefore,
should be better for resolving recent evolution, that the use of SNPs across the whole F. tularensis
genome gave a higher typing resolution than VNTRs in all but one cases. One simple explanation
for the observation is that SNPs across the genomes occur in higher numbers, i.e., 117 different SNPs
compared with 10 VNTR regions.
5. Conclusions
The phylogenetic analysis strongly supported a recent rapid expansion of F. tularensis populations
in Spain, consistent with the recent disease introduction into the country and that human activities
may have facilitated this expansion. The use of whole-genome SNPs provided higher resolution than
the use of multiple VNTRs for depicting F. tularensis evolution. We found that VNTR copy numbers of
F. tularensis can be accurately predicted using short-read WGS data but provide little extra information
for epidemiological studies.
Author Contributions: Conceptualization, A.J.; methodology, R.E. provided study materials, carried out the
MLVA, prepared the sequencing libraries; R.G.-M.-N. contributed to the preparation of the sequencing libraries.
Á.Z. performed the sequencing. M.G. contributed to the MLVA analysis.; formal analysis, K.M. performed the
bioinformatics analyses.; resources, A.J. and K.M.; data curation, K.M.; writing—original draft preparation, A.J. and
K.M.; writing—review and editing, A.J. and K.M., R.E. contributed in reviewing the manuscript; visualization,
K.M.; supervision, A.J.; project administration, K.M. All authors have read and agreed to the published version of
the manuscript.
Funding: This research was funded by the Ministerio de Economía y Competitividad, Government of
Spain/FEDER, RESERTULA (CLG2015-66962-C2-2-R) project; the Ministerio de Ciencia e Innovación, project
PID2019-109327RB-I00; MedVetNet Association (ref STM2015-1), and the Swedish Ministry of Foreign Affairs, FOI
project no. A4952.
Acknowledgments: We thank Zsuzsa Kreizinger at the Institute for Veterinary Medical Research, Hungarian
Academy of Sciences, for supportive MLVA work, and Mª Antonia García Castro at the Complejo Asistencial
Universitario de Palencia for providing the isolates.
Conflicts of Interest: The authors declare no conflict of interest.
Appendix A
Table A1. Twenty-five strains isolated in 1998 and 2007–2008 in the autonomous community of Castilla
y León, Spain.
ID Source Province Year of Isolation Accession 1 Clade
F0783, FT9, F190 Human León 1998 SAMN03773734 B.52
TU4 Hare León 1998 SAMN03773884 B.52
TU21 Hare Palencia 1998 SAMN03773885 B.61
TU39 Hare Zamora 1999 SAMN03773886 B.48
TU8 Hare Palencia 1998 SAMN03773887 B.45
TU17 Hare Segovia 1998 SAMN03773888 B.61Microorganisms 2020, 8, 1784 10 of 14
Table A1. Cont.
ID Source Province Year of Isolation Accession 1 Clade
TU18 Hare Palencia 1998 SAMN03773889 B.49
TU16 Hare Valladolid 1998 SAMN03773890 B.52
TU38 Hare Soria 1998 SAMN03773891 B.49
TU23 Vole Zamora 1998 SAMN03773892 B.48
TU22 Hare Valladolid 1998 SAMN03773893 B.49
TU31 Human Valladolid 1998 SAMN03773894 B.52
TU13 Hare Zamora 1998 SAMN03773895 B.48
TU25 Human Zamora 1998 SAMN03773896 B.61
VA-23287 Human Valladolid 2007 SAMN03773897 B.56
ZA-07/2645 Human Zamora 2008 SAMN03773898 B.57
7072002 Human León 2007 SAMN03773899 B.56
6434 Vole Zamora 2007 SAMN03773900 B.56
3640 Hare Zamora 2008 SAMN03773901 B.56
ZA-26454 Human Zamora 2007 SAMN03773902 B.57
PA-21739 Human Palencia 2007 SAMN03773903 B.62
ZA-20206 Human Zamora 2007 SAMN03773904 B.56
7074825 Human León 2007 SAMN03773905 B.52
PA-22442 Human Palencia 2007 SAMN03773906 B.56
FSC456, FT7 Human Zamora 1998 SAMN03774111 B.61
1 Dwibedi et al., [16].
Table A2. Primers for PCR product sizing using capillary electrophoresis.
Primer Sequence Fluorescence Dye Melting Point
Ft-M03_F gcacgcttgtctcctatcatcctctggtagtc HEX 64.7 ◦ C
Ft-M03_R gaacaacaaaagcaacagcaaaattcacaaaa 59.4 ◦ C
Ft-M04_F gcgcgctatctaactaatttttatattgaaacaatcaaat FAM 59.3 ◦ C
Ft-M04_R gcaaatataccgtaatgccacctatgaaaactc 60.2 ◦ C
Ft-M05_F gtttgttacgccaataaacaaaaagtgtaaataatg NED 57.6 ◦ C
Ft-M05_R gctcagctcgaactccgtcataccttcttc 64.1 ◦ C
Ft-M10_F gctaattttttcatatttatctccatttttacttttttgc HEX 57 ◦ C
Ft-M10_R gctcagctcgaactccgtcataccttcttc 64.1 ◦ C
Ft-M20A_F gtatatcttggaataagccggagttagatggttct FAM 61.1 ◦ C
FtM20A_R gcaataactttatcacccttattgtagactgcttctgc 62.1 ◦ C
Ft-M20B_F gggtgataaagttattgttaatggtgtgacttatgaa 59.5 ◦ C
Ft-M20B_R gtaactacttgaccgccagtatatgcttgacct HEX 63 ◦ C
Ft-M06_F gtttttggtgaactgccaacaccataactt NED 61.1 ◦ C
Ft-M06_R gcaattcagcgaaaccctatcttagcctc 62 ◦ C
Ft-M02_F gctgctgtggctgtaaatgttgctatgct FAM 64.1 ◦ C
Ft-M02_R gcagggcacaattcttgaccatcagg 63.3 ◦ C
Ft-M22_F gtggaaatgcaaaaacaatatcgaggaacttta FAM 59.1 ◦ C
Ft-M22_R gttttttctcgtccgctgttagtgattttacatc 60.5 ◦ C
Ft-M23_F gctggattattaaagcatatgacagacgagtagg NED 60.6 ◦ C
Ft-M23_R gttccctcaggtttatccaaagttttaatgttttatt 59 ◦ C
Ft-M24_F gaatcttaatccatacggtcctaataatattcctgtcaat NED 59.8 ◦ C
Ft-M24_R gttggtacttatgggctatagcggatattatttcagt 61.2 ◦ C
Table A3. Genome information for 20 new genomes from Spain, 2014–2015 and 2018–2020.
Total No. Total No. Mean Sequence BioSample
ID N50 Clade Subclade Path
Bases Contigs Depth Accession *
BZ01 1,810,591 95 27699 455 SAMN12071621 B.62 B.62–B.110
BZ02 1,821,580 95 27699 431 SAMN12071622 B.62 B.62–B.110
BZ03 1,825,760 111 23863 466 SAMN12071623 B.62 B.62–B.110
BZ04 1,823,438 98 26961 481 SAMN12071624 B.48 B.48–B.108
BZ05 1,809,217 97 25525 410 SAMN12071625 B.62 B.62–B.110Microorganisms 2020, 8, 1784 11 of 14
Table A3. Cont.
Total No. Total No. Mean Sequence BioSample
ID N50 Clade Subclade Path
Bases Contigs Depth Accession *
BZ06 1,825,942 105 25544 574 SAMN12071626 B.62 B.62–B.110
BZ07 1,812,133 98 26732 550 SAMN12071627 B.48 B.48–B.108
BZ08 1,818,495 94 27699 559 SAMN12071628 B.48 B.48–B.108
BZ09 1,825,893 108 25990 424 SAMN12071629 B.48 B.48–B.108
BZ10 1,811,236 88 33271 417 SAMN12071630 B.61 B.61
BZ11 1,808,131 92 29735 514 SAMN12071631 B.48 B.48–B.108
BZ12 1,830,400 100 26972 340 SAMN16515973 B.48 B.48–B.56
BZ13 1,756,606 218 15177 269 SAMN16515974 B.48 B.48–B.108
BZ14 1,775,418 201 15465 282 SAMN16515975 B.48 B.48–B.108
BZ15 1,818,738 99 26747 242 SAMN16515976 B.62 B.62–B.110–B.315
BZ16 1,813,941 97 26857 281 SAMN16515977 B.62 B.62–B.110–B.315
BZ17 1,819,785 97 27089 331 SAMN16515978 B.48 B.48–B.108
BZ18 1,708,033 369 7369 231 SAMN16515979 B.48 B.48–B.108
BZ19 1,833,295 94 27956 103 SAMN16515980 B.48 B.48–B.56
BZ20 1,834,431 89 29599 89 SAMN16515981 B.49 B.49
* BioProject no. PRJNA548692.
Table A4. Thirty-four identified canonical SNPs for clades in Figure 1 with more than two members.
The clades are in the same order as they appear in Figure 1. The position in the reference genome
of FTNF002-00 (FTA) is indicated. Members of clades are shown. The canonical SNPs selected to
represent the branches for five new clades, B.107–B.110 and B.315, are indicated in bold.
Clade Genomes No. SNPs SNP Position (Anc/Der)
BZ04:BZ07:BZ08:BZ09:BZ11:
BZ12:BZ13:BZ14:BZ17:BZ18: 170,704 (C/T);258,998 (G/T);
BZ19:TU39:TU23:TU13: 736,278 (G/A);1,075,715 (C/T);
B.48 8
VA-23287:ZA-07/2645:7072002: 1,194,117 (G/A);1,225,490 (G/A);
6434:3640:ZA-26454: 1,558,703 (C/T);1,746,518 (C/T)
ZA-20206:PA-22442
BZ04:BZ07:BZ08:BZ09:BZ11:
B.108 1 1,327,297 (C/T)
BZ13:BZ14:BZ17:BZ18
668,630 (T/C);1,747,062
B.57 ZA-07/2645:ZA-26454 3
(G/T);1,860,651 (G/A)
BZ12:BZ19:VA-23287:
B.56 7072002:6434:3640:ZA-20206: 1 827,994 (G/A)
PA-22442
B.107 7072002:ZA-20206 1 520,520 (C/T)
BZ01:BZ02:BZ03:BZ05:BZ06: 155,417 (G/A);411,903 (C/T);
B.62 4
BZ15:BZ16:PA-21739 505,602 (C/T);691,772 (C/T)
BZ01:BZ02:BZ03:BZ05:BZ06:
B.110 2 1,301,561 (G/A);1,742,563 (G/A)
BZ15:BZ16
B.315 BZ15:BZ16 2 975,621 (G/C);1,721,277 (T/C)
235,472 (G/A);1,009,840
B.61 BZ10:TU21:TU17:TU25:FSC456 3
(G/T);1,332,119 (G/A)
B.109 TU17:TU25:FSC456 2 1,082,513 (T/C);1,171,726 (G/A)
B.49 BZ20:TU18:TU38:TU22:FTNF002 1 224,367 (G/A)
238,894 (C/T);324,043 (C/T);
B.52 F0783:TU4:TU16:TU31:7074825 6 1,009,935 (C/T);1,130,906 (C/T);
1,151,666 (T/C);444,395 (C/T)Microorganisms 2020, 8, 1784 12 of 14
Table A5. Sizes of PCR Fragments targeting ten VNTR markers determined by capillary electrophoresis.
ID Ft-M2 Ft-M3 Ft-M4 Ft-M5 Ft-M6 Ft-M10 Ft-M20A Ft-M20B Ft-M22 Ft-M23 Ft-M24
BZ01 339.8 303.6 218.9–219.9 299.6 275.7 199.6 307.7 151.0 174.7 327.4 400.3
BZ02 339.7 303.4 219.0 300.0 274.9 199.6 307.7 151.8 174.7 327.4 399.7
BZ03 339.5 303.2 218.8–219.8 300.3 276.0 199.6 307.7 151.7 174.7 327.4 400.3
BZ04 340.0 313.1 224.4 300.3 275.8 199.6 307.7 151.5 174.7 327.4 400.1
BZ05 339.7 303.5 218.8–219.8 300.0 275.9 199.6 307.7 151.5 174.7 327.6 400.0
BZ06 339.8 303.6 218.8–219.8 300.1 275.7 199.6 307.7 151.6 174.7 327.5 400.1
BZ07 340.0 313.4 224.5 300.3 276.1 199.6 307.7 151.6 174.7 327.6 400.1
BZ08 339.8 313.1 225.6 299.7 275.8 199.6 307.7 151.6 174.7 327.6 399.7
BZ09 339.8 313.0 225.3 300.2 275.8 199.6 307.7 151.6 174.7 327.3 400.2
BZ10 340.0 303.7 224.3 300.2 275.7 199.6 307.7 151.5 174.7 327.3 400.2
BZ11 340.0 313.5 224.3 300.1 275.8 199.6 307.7 151.6 174.7 327.3 400.3
Table A6. Sizing of PCR fragments targeting ten VNTR markers from genomes.
ID Ft-M2 Ft-M3 Ft-M4 Ft-M5 Ft-M6 Ft-M10 Ft-M20A Ft-M20B Ft-M22 Ft-M23 Ft-M24
BZ01 339 297 216 - 272 - 306 153 178 327 400
BZ02 339 297 216 - 272 - 306 153 178 327 400
BZ03 339 297 216 298 272 - 306 153 178 327 400
BZ04 339 306 221 298 272 197 306 153 178 327 400
BZ05 339 297 216 - 272 - 306 153 178 327 400
BZ06 339 297 216 298 272 197 306 153 178 327 400
BZ07 339 306 221 - 272 - 306 153 178 327 400
BZ08 339 306 221 289 * 272 188 * 306 153 178 327 400
BZ09 339 306 221 - 272 - 306 153 178 325 400
BZ10 339 297 221 298 272 197 306 153 178 327 400
BZ11 339 306 221 - 272 - 306 153 178 327 400
* BZ08 Ft-M5 and Ft-M10 hit is not 100% length. -: The size could not be determined.
Table A7. Differences between size (Table A5) and genomic size (Table A6) of PCR products.
ID Ft-M2 Ft-M3 Ft-M4 Ft-M6 Ft-M20A Ft-M20B Ft-M22 Ft-M23 Ft-M24
BZ01 0.8 6.6 2.9 3.7 1.7 −2 −3.3 0.4 0.3
BZ02 0.7 6.4 3 2.9 1.7 −1.2 −3.3 0.4 −0.3
BZ03 0.5 6.2 2.8 4 1.7 −1.3 −3.3 0.4 0.3
BZ04 1 7.1 3.4 3.8 1.7 −1.5 −3.3 0.4 0.1
BZ05 0.7 6.5 2.8 3.9 1.7 −1.5 −3.3 0.6 0
BZ06 0.8 6.6 2.8 3.7 1.7 −1.4 −3.3 0.5 0.1
BZ07 1 7.4 3.5 4.1 1.7 −1.4 −3.3 0.6 0.1
BZ08 0.8 7.1 4.6 3.8 1.7 −1.4 −3.3 0.6 −0.3
BZ09 0.8 7 4.3 3.8 1.7 −1.4 −3.3 2.3 0.2
BZ10 1 6.7 3.3 3.7 1.7 −1.5 −3.3 0.3 0.2
BZ11 1 7.5 3.3 3.8 1.7 −1.4 −3.3 0.3 0.3
Median diff. 0.8 6.7 3.3 3.8 1.7 −1.4 −3.3 0.4 0.1
Average diff. 0.8 6.8 3.3 3.7 1.7 −1.5 −3.3 0.6 0.1
Repeat size 6 9 5 21 12 12 6 23 21
References
1. Keim, P.; Johansson, A.; Wagner, D.M.; Epidemiology, M. Molecular epidemiology, evolution, and ecology of
Francisella. Ann. N. Y. Acad. Sci. 2007, 1105, 30–66. [CrossRef] [PubMed]
2. Parker, R.R.; Steinhaus, E.A.; Kohls, G.M.; Jellison, W.L. Contamination of natural waters and mud with
Pasteurella tularensis and tularemia in beavers and muskrats in the northwestern United States. Bull. Natl.
Inst. Health 1951, 193, 1–161. [PubMed]
3. Broman, T.; Thelaus, J.; Andersson, A.-C.; Bäckman, S.; Wikström, P.; Larsson, E.; Granberg, M.; Karlsson, L.;
Bäck, E.; Eliasson, H.; et al. Molecular Detection of Persistent Francisella tularensis Subspecies holarctica in
Natural Waters. Int. J. Microbiol. 2011, 2011, 1–26. [CrossRef] [PubMed]
4. Schulze, C.; Heuner, K.; Myrtennäs, K.; Karlsson, E.; Jacobs, D.; Kutzer, P.; Große, K.; Forsman, M.; Grunow, R.
High and novel genetic diversity of Francisella tularensis in Germany and indication of environmental
persistence. Epidemiol. Infect. 2016, 144, 3025–3036. [CrossRef]Microorganisms 2020, 8, 1784 13 of 14
5. Janse, I.; Maas, M.; Rijks, J.M.; Koene, M.; van der Plaats, R.Q.; Engelsma, M.; van der Tas, P.; Braks, M.;
Stroo, A.; Notermans, D.W.; et al. Environmental surveillance during an outbreak of tularaemia in hares,
the Netherlands, 2015. Eurosurveillance 2017, 22, 30607. [CrossRef]
6. Janse, I.; van der Plaats, R.Q.J.; Van Passel, M.W.J. Environmental surveillance of zoonotic Francisella
tularensis in the Netherlands. Front. Cell. Infect. Microbiol. 2018, 8, 140. [CrossRef]
7. Vogler, A.J.; Birdsell, D.; Price, L.B.; Bowers, J.R.; Beckstrom-Sternberg, S.M.; Auerbach, R.K.;
Beckstrom-Sternberg, J.S.; Johansson, A.; Clare, A.; Buchhagen, J.L.; et al. Phylogeography of Francisella
tularensis: Global expansion of a highly fit clone. J. Bacteriol. 2009, 191, 2474–2484. [CrossRef]
8. Svensson, K.; Granberg, M.; Karlsson, L.; Neubauerova, V.; Forsman, M.; Johansson, A. A real-time PCR
array for hierarchical identification of Francisella isolates. PLoS ONE 2009, 4, e8360. [CrossRef]
9. Svensson, K.; Bäck, E.; Eliasson, H.; Berglund, L.; Granberg, M.; Karlsson, L.; Larsson, P.; Forsman, M.;
Johansson, A. Landscape Epidemiology of Tularemia Outbreaks in Sweden. Emerg. Infect. Dis. 2009, 15,
1937–1947. [CrossRef]
10. Chanturia, G.; Birdsell, D.N.; Kekelidze, M.; Zhgenti, E.; Babuadze, G.; Tsertsvadze, N.; Tsanava, S.;
Imnadze, P.; Beckstrom-Sternberg, S.M.; Beckstrom-Sternberg, J.S.; et al. Phylogeography of Francisella
tularensis subspecies holarctica from the country of Georgia. BMC Microbiol. 2011, 11, 139. [CrossRef]
11. Gyuranecz, M.; Birdsell, D.N.; Splettstoesser, W.; Seibold, E.; Beckstrom-sternberg, S.M.; Makrai, L.; Fodor, L.;
Fabbi, M.; Vicari, N.; Johansson, A.; et al. Phylogeography of Francisella tularensis subsp. holarctica, Europe.
Emerg. Infect. Dis. 2012, 18, 290–293. [CrossRef] [PubMed]
12. Karlsson, E.; Svensson, K.; Lindgren, P.; Byström, M.; Sjödin, A.; Forsman, M.; Johansson, A.; Karlsson, E.;
Svensson, K.; Lindgren, P.; et al. The phylogeographic pattern of Francisella tularensis in Sweden indicates a
Scandinavian origin of Eurosiberian tularaemia. Environ. Microbiol. 2013, 15, 634–645. [CrossRef] [PubMed]
13. Johansson, A.; Farlow, J.; Larsson, P.; Dukerich, M.; Chambers, E.; Bystrom, M.; Fox, J.; Chu, M.; Forsman, M.;
Sjostedt, A.; et al. Worldwide Genetic Relationships among Francisella tularensis Isolates Determined by
Multiple-Locus Variable-Number Tandem Repeat Analysis. J. Bacteriol. 2004, 186, 5808–5818. [CrossRef]
[PubMed]
14. Johansson, A.; Forsman, M.; Sjöstedt, A. The development of tools for diagnosis of tularemia and typing of
Francisella tularensis. APMIS 2004, 112, 898–907. [CrossRef]
15. Timofeev, V.; Bakhteeva, I.; Titareva, G.; Kopylov, P.; Christiany, D.; Mokrievich, A.; Dyatlov, I.; Vergnaud, G.
Russian isolates enlarge the known geographic diversity of Francisella tularensis subsp. mediasiatica.
PLoS ONE 2017, 12, e0183714. [CrossRef]
16. Dwibedi, C.; Birdsell, D.; Lärkeryd, A.; Myrtennäs, K.; Öhrman, C.; Nilsson, E.; Karlsson, E.; Hochhalter, C.;
Rivera, A.; Maltinsky, S.; et al. Long-range dispersal moved Francisella tularensis into Western Europe from
the East. Microb. Genom. 2016, 2. [CrossRef]
17. Eiros Bouza, J.M.; Rodríguez-Torres, A. Tularemia. Rev. Clin. Esp. 1998, 198, 785–788.
18. Farlow, J.; Smith, K.L.K.L.; Wong, J.; Abrams, M.; Lytle, M.; Keim, P. Francisella tularensis strain typing using
multiple-locus, variable-number tandem repeat analysis. J. Clin. Microbiol. 2001, 39, 3186–3192. [CrossRef]
19. Li, R.; Zhu, H.; Ruan, J.; Qian, W.; Fang, X.; Shi, Z.; Li, Y.; Li, S.S.; Shan, G.; Kristiansen, K.; et al. ABySS:
A parallel assembler for short read sequence data. Genome Res. 2009, 19, 1117–1123. [CrossRef]
20. Lärkeryd, A.; Myrtennäs, K.; Karlsson, E.; Dwibedi, C.K.; Forsman, M.; Larsson, P.; Johansson, A.; Sjödin, A.
CanSNPer: A hierarchical genotype classifier of clonal pathogens. Bioinformatics 2014, 30, 1762–1764.
[CrossRef]
21. Kreizinger, Z. Comparative Characterisation of Members of the Family Francisellaceae. Ph.D. Thesis,
Szent István University, Doctoral School of Veterinary Science, Gödöllo, Hungary, 2016.
22. Wittwer, M.; Altpeter, E.; Pilo, P.; Gygli, S.M.; Beuret, C.; Foucault, F.; Ackermann-Gäumann, R.; Karrer, U.;
Jacob, D.; Grunow, R.; et al. Population Genomics of Francisella tularensis subsp. holarctica and its
Implication on the Eco-Epidemiology of Tularemia in Switzerland. Front. Cell. Infect. Microbiol. 2018, 8, 1–16.
[CrossRef] [PubMed]
23. Appelt, S.; Köppen, K.; Radonić, A.; Drechsel, O.; Jacob, D.; Grunow, R.; Heuner, K. Genetic Diversity and
Spatial Segregation of Francisella tularensis Subspecies holarctica in Germany. Front. Cell. Infect. Microbiol.
2019, 9. [CrossRef] [PubMed]
24. Seiwald, S.; Simeon, A.; Hofer, E.; Weiss, G.; Bellmann-Weiler, R. Tularemia Goes West: Epidemiology of an
Emerging Infection in Austria. Microorganisms 2020, 8, 1597. [CrossRef] [PubMed]Microorganisms 2020, 8, 1784 14 of 14
25. Kevin, M.; Girault, G.; Caspar, Y.; Cherfa, M.A.; Mendy, C.; Tomaso, H.; Gavier-Widen, D.; Escudero, R.;
Maurin, M.; Durand, B.; et al. Phylogeography and Genetic Diversity of Francisella tularensis subsp.
holarctica in France (1947–2018). Front. Microbiol. 2020, 11, 1–17. [CrossRef] [PubMed]
26. Simões, M.; Breitkreuz, L.; Alvarado, M.; Baca, S.; Cooper, J.C.; Heins, L.; Herzog, K.; Lieberman, B.S.
The Evolving Theory of Evolutionary Radiations. Trends Ecol. Evol. 2016, 31, 27–34. [CrossRef]
27. Anda, P.; Segura del Pozo, J.; Díaz García, J.M.; Escudero, R.; García Peña, F.J.; López Velasco, M.C.;
Sellek, R.E.; Jiménez Chillarón, M.R.; Sánchez Serrano, L.P.; Martínez Navarro, J.F. Waterborne outbreak of
tularemia associated with crayfish fishing. Emerg. Infect. Dis. 2001, 7, 575–582. [CrossRef]
28. Allue, M.; Sopeña, C.R.; Gallardo, M.T.; Mateos, L.; Vian, E.; Garcia, M.J.; Ramos, J.; Berjon, A.C.; Viña, M.C.;
Garcia, M.P.; et al. Tularaemia outbreak in Castilla y León, Spain, 2007: An update. Eurosurveillance 2008, 13,
18948. [CrossRef] [PubMed]
29. Mörner, T. The ecology of tularaemia. Rev. Sci. Tech. 1992, 11, 1123–1130. [CrossRef]
30. Luque-Larena, J.J.; Mougeot, F.; Arroyo, B.; Vidal, M.D.; Rodríguez-Pastor, R.; Escudero, R.; Anda, P.;
Lambin, X. Irruptive mammal host populations shape tularemia epidemiology. PLoS Pathog. 2017, 13, 1–5.
[CrossRef]
Publisher’s Note: MDPI stays neutral with regard to jurisdictional claims in published maps and institutional
affiliations.
© 2020 by the authors. Licensee MDPI, Basel, Switzerland. This article is an open access
article distributed under the terms and conditions of the Creative Commons Attribution
(CC BY) license (http://creativecommons.org/licenses/by/4.0/).You can also read