Simulation of Fall Armyworm Spodoptera frugiperda Attacks and the Compensative Response of Quality Protein Maize Zea mays, var. Mudishi-1 and ...
←
→
Page content transcription
If your browser does not render page correctly, please read the page content below
Open Access Library Journal
                                                                                                          2021, Volume 8, e7217
                                                                                                         ISSN Online: 2333-9721
                                                                                                           ISSN Print: 2333-9705

Simulation of Fall Armyworm (Spodoptera
frugiperda) Attacks and the Compensative
Response of Quality Protein Maize (Zea
mays, var. Mudishi-1 and Mudishi-3)
in Southwestern DR Congo

Jean Pierre Kabongo Tshiabukole1,2*, Gertrude Pongi Khonde1,2, André Matondo Phongo1,
Nlandu Ngoma1, Amand Mbuya Kankolongo1,2, Roger Kizungu Vumilia3,
Antoine Mumba Djamba2
1
  National Maize Program, National Institute for Agronomic Study and Research, Gandajika, DRC
2
  Faculties of Agricultural Sciences of the National Pedagogical University, Gandajika, DRC
3
  INERA DG, University of Kinshasa, Gandajika, DRC

How to cite this paper: Tshiabukole,          Abstract
J.P.K., Khonde, G.P., Phongo, A.M.,
Ngoma, N., Kankolongo, A.M., Vumilia,         In this paper, to assess the varietal ability to compensate defoliation damage
R.K. and Djamba, A.M. (2021) Simulation       caused by the fall armyworm, a trial was carried out at the INERA Mvuazi
of Fall Armyworm (Spodoptera frugiperda)      research center. The aim of this study was to determine the limit threshold of
Attacks and the Compensative Response of
                                              damage that could cause the significant loss of the harvest of the quality pro-
Quality Protein Maize (Zea mays, var.
Mudishi-1 and Mudishi-3) in Southwestern      tein maize distributed in the Democratic Republic of the Congo. To do this,
DR Congo. Open Access Library Journal, 8:     three factors including two varieties (Mudishi-1 and Mudishi-3) of quality
e7217.                                        protein maize, four rating damage and two growth stages were used into a
https://doi.org/10.4236/oalib.1107217         factorial design with 3 replications. Simulation of damage caused by FAW
                                              consisted of cutting of blades for all visible leaves of plants. Damage rates si-
Received: February 4, 2021
Accepted: March 28, 2021                      mulating leaf destroying were 0%, 25%, 50%, 75% and 100%, occurring at two
Published: March 31, 2021                     growth stages: stage V3 (2 to 4 weeks after emergence) and stage V7 (flower-
                                              ing stage). Results showed that damage factor combined with growth stage
Copyright © 2021 by author(s) and Open
                                              factor significantly influenced (p < 0.05) the yield component variables in-
Access Library Inc.
This work is licensed under the Creative
                                              cluding yield losses, harvest rate, ear sizes, number of ears harvested and yield
Commons Attribution International             as well as the market quality of the ears, based on appearance quotation.
License (CC BY 4.0).                          Damage rate more than 50%, at all growth stages studied, caused grain losses
http://creativecommons.org/licenses/by/4.0/   upper than 50% regardless of variety. However, damage less than 50% at V3
               Open Access                    stage resulted in grain losses under 10%. At the end of this study, we showed
                                              that the varieties of maize QPM (Mudishi-1 and Mudishi-3) would be able to
                                              compensate the damage caused by the FAW and achieve its yield, if the at-
                                              tacks damaging 25% of the leaves occur during V3.

DOI: 10.4236/oalib.1107217       Mar. 31, 2021                   1                                   Open Access Library Journal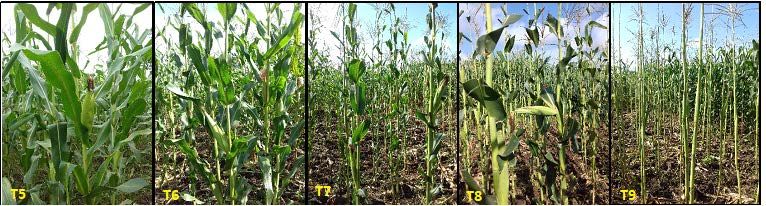
J. P. K. Tshiabukole et al.

                               Subject Areas
                               Agricultural Science

                               Keywords
                               QPM, Yield Losses, Growth Stage, FAW, Rate Damage

                             1. Introduction
                             Fall armyworm (FAW) Spodoptera frugiperda, is a lepidopteran pest native to
                             the tropical and subtropical regions of the Americas [1] [2].
                                FAW larval stage can completely defoliate seedling and early-vegetative stage
                             of maize plants, stunt plant growth, or kill seedlings [3] [4] giving them a shred-
                             ded appearance [5] when it is not properly managed. FAW prefers maize, but
                             can feed on more than 80 additional plant species, including rice, sorghum, mil-
                             let, sugarcane, vegetables such as cabbage, salad, eggplant, pepper and cotton [5]
                             [6]. The pest feeds inside whorls and can destroy silks, panicles and developing
                             grains reducing yields through direct losses, exposure of ears to infections and
                             loss of quality and quantity of grain [5]. But the foliar damage caused by FAW in
                             many cases does not result in dramatic yield reduction [7]. A quantification of
                             the potential yield losses is still speculative, as many variables come into play
                             between FAW infestation and yield reduction [6].
                                Different levels of damages have been reported from different countries [8] [9]
                             [10]. But rarely, those damages levels are related to the yield losses except some
                             scanty studies [7] [11] [12]. Yield loss could be lower due to climatic factors, the
                             constitution of natural enemies or improved management [13].
                               Fall armyworm (FAW) Spodoptera frugiperda (J.E. Smith) invaded Africa in
                             2016 [14] [15]. Native to tropical and subtropical regions of the Americas [16],
                             FAW presence is now confirmed in 45 African countries [13]. It is causing sig-
                             nificant damage to maize crops, threatening therefore, the livelihood of farmers
                             who rely on maize production [17].
                               [18] estimated the impact of FAW between 22% and 67% of the yield respec-
                             tively in Ghana and Zambia, resulting in losses in millions of US dollars. Simi-
                             larly, [19] estimated the impact of FAW at 32% of yields in Ethiopia and 47% in
                             Kenya. These estimations, however, are based on socio-economic surveys fo-
                             cused on farmers’ perceptions, but not on rigorous field scouting methods [11].
                             Average loss of maize reported by farmers in Ghana was 26.6% and 35% in
                             Zambia. This is much less than what was reported in 2017.
                                According to an unpublished survey report from the Ministry of Agriculture,
                             Fisheries and Livestock (MINAGRI), 800,000 ha of maize fields had been devas-
                             tated by this pest in 87 of 150 territories in 2017. Based on a rough estimate of
                             around 500 hectares affected by territory, the DRC could see up to 25,000 hec-
                             tares of maize affected, representing more than US$20 million in losses for local

DOI: 10.4236/oalib.1107217                         2                                  Open Access Library Journal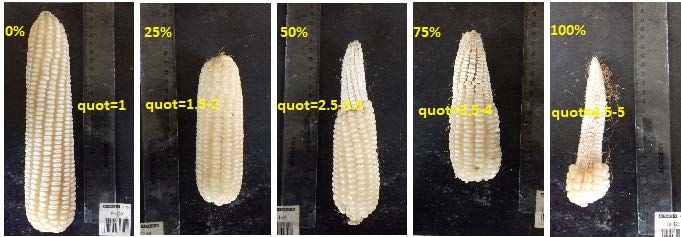
J. P. K. Tshiabukole et al.

                                         populations [6]. Following the financial statistics, these losses represent a signif-
                                         icant risk in terms of food and nutritional insecurity because they also represent
                                         250 million meals [6].
                                            The response of maize yield to damage caused by FAW has been studied in
                                         the field several times on the American continent. A review of the study on the
                                         response of maize yield to damage caused by FAW has shown that, although
                                         cause for concern, the damage of FAW in maize is not devastating. Despite FAW
                                         attacks, damaged maize plants are able to compensate for leaf damage, especially
                                         if nutrition and moisture soil conditions are good [20]. Although some studies
                                         have shown yield reductions of more than 50% due to FAW, the majority of tri-
                                         als have shown yield reductions of less than 20%, even with a high FAW infesta-
                                         tion, up to 100% of infested plants [21].
                                            The aim of the present study is to assess the ability to compensate for leaf dam-
                                         age caused by FAW at two growth stages of quality protein maize under growing
                                         conditions in south-west DRC.

                                         2. Materials and Method
                                         2.1. Experimental Site, Analyzes and Characteristics of Soils
                                         Trial was conducted during the 2018-2019 growing season, from October 25,
                                         2018 to March 14, 2019 at Mvuazi research center of the National Institute for
                                         Agronomic Study. Mvuazi is located at 14˚54' East longitude and 5˚21' South la-
                                         titude, at 470 m of altitude (Figure 1).
                                           The soil of Mvuazi belongs to the Sudano-Guinean climatic zone of AW4 type
                                         [23]. This soil is characterized by a low organic matter content and a low water
                                         retention capacity, resulting to a low availability of nitrogen [24] and the orthic
                                         soil type [25] (Table 1). The climatic data recorded during the experimental pe-
                                         riod are presented in Table 2.

                                         2.2. Plant Material
                                         Varieties Mudishi-1 (M1) and Mudishi-3 (M3) selected by the National Maize

Table 1. Selected chemical and physical parameters for soils of experimental site.

  Parameters
                 Soil pH    P1 (ppm)    K (ppm)       Ca (ppm)         Mg (ppm)      Mn (ppm)    S (ppm)      Cu (ppm)     B (ppm)
  (u [10]Nit )

    Results        5.76        14         105            1505             229           55          23          12.30         0.21

  Guide Low        6.00        30         268            1651             165           100         20           2.00         1.00

  Guide high       7.00       100         537            2064             264           250        200          10.00         2.00

  Parameters
                 Zn (ppm)   Na (ppm)    Fe (ppm) CEC (meq/100 g) OC (meq /100 g)      Silt (%)   Sand (%)     Clay (%)       N (%)
  (u [10]Nit )

    Results        7.98        47         194           13.76             4.07          13          49           39           0.21

  Guide Low        4.00        0          150           15.00                           30          30           20           0.20

  Guide high      20.00       158         350           30.00                           50          55           55           0.50

DOI: 10.4236/oalib.1107217                                       3                                       Open Access Library Journal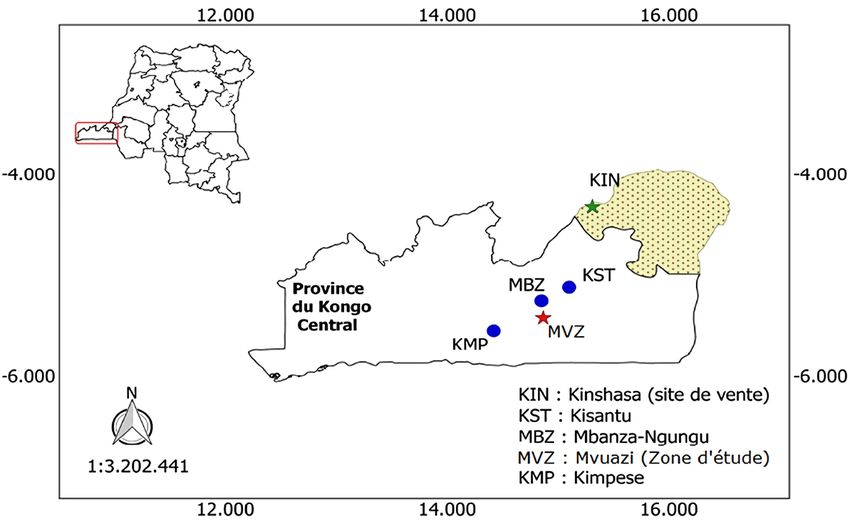
J. P. K. Tshiabukole et al.

                             Table 2. Climatic data recorded during the experimental period.

                                       Year                2018      2018       2018        2019         2019         2019

                                      Month            October     November December      January      February      March

                                    TMax (˚C)              30.76     30.95      29.63      21.68         30.95        31.98

                                    TMin (˚C)              20.3      21.55      21.46      28.10         21.33        21.23

                                    Rain (mm)              179.1    252.90     197.70      100.90        435.30       60.50

                              Nber. of rain [18]Days        9        10.00      7.00        6.00         16.00        3.00

                                   Rel. hum (%)            74.85     79.96      82.41      80.32         81.99        74.24

                                   T.mean (˚C)             25.52     26.23      32.56      26.05         26.11        26.36

                             Tmax = Temperature maximal, Tmin = Temperature mi[10]Nimal, Rain = Rainfall, Rel.Hum = Relative
                             humidity, T.mean = Temperature mean.

                               Figure 1. Geographic location of the INERA Mvuazi Research Center (source: [22]).

                             Program of INERA, are cultivated in the most of agro-ecological zones of the
                             DRC. They are preferred for their resistance to leaf diseases, to root and stem
                             lodging, their yield potential of 4 to 6 t/ha [26] and their high rate in lysine and
                             tryptophan [27].

                             2.3. Experimental Design and Treatments
                             The factorial experimental design with 3 replications and 3 factors was used
                             (Figure 2). The first factor (percentage of damage by cutting the blade of leaves)
                             consisted of five levels, namely 0% (no damage, which corresponds to the con-
                             trols), 25% (leaves having lost the 25% of the blade), 50% (leaves having lost the
                             half of the blade), 75% (leaves having lost 75% of the blade) and 100% (leaves
                             having lost all of the blade). The second factor (growth stage) consisted of two
                             levels: V3 and VT as defined by McWilliams et al. (1999), V3 which corresponds
                             to defoliation at the 2 - 4 week after emergence and VT which corresponds to
                             defoliation at the stage of flowering. The third factor (variety) was made up of
                             two levels: M1 and M3. The maize plants have been sown at 0.75 m × 0.50 m
                             spacing with 2 seeds per hill in the 1.50 m × 2 m plots.

DOI: 10.4236/oalib.1107217                             4                                      Open Access Library Journal
J. P. K. Tshiabukole et al.
Figure 2. Simulation of defoliation by cutting the blade at 0%, 25%, 50%, 75% and 100%
at stage VT.
The combination of percentage of damage (factor in sub-sub-plot), stages of
growth (factor in sub-plot) and variety (factor in plot) allowed a total of twenty
(20) treatments:
T0.1 (M1:0%:V3), T0.2 (M3:0%:V3), T1.1 (M1:25%:V3), T1.2 (M3:25%:V3),
T2.1 (M1:50%:V3), T2.2 (M3:50%:V3), T3.1 (M1:75%:V3), T3.2 (M3:75%:V3),
T4.1 (M1:100%:V3), T4.2 (M3:100%:V3), T5.1 (M1:0%:VT), T5.2 (M3:0%:VT),
T6.1 (M1:25%:VT), T6.2 (M3:25%:VT), T7.1 (M1:50%:VT), T7.2 (M3:50%:VT),
T8.1 (M1:75%:VT), T8.2 (M3:75%:VT, T9.1 (M1:100%:VT), T9.2 (M3:100%:VT).
2.4. Data Collection
Data collected concerned observations made on some parameters relating to
yield performance were:
- Number of plants per useful plot (without borders)
- Number of ears harvested per useful plot
- Percentage of harvest: Number of ears of corn harvested from number of
plants per plot multiplied by one hundred
- Percentage of marketable ears based on quotation of appearance: number of
healthy ears (not attacked) on number of ears harvested multiplied by one
hundred, the quotation scale of appearance of ear is from 1 to 5 where 1 =
excellent, 2 = good, 3 = fairly good, 4 = not good and 5 = poor) [26]
- Ear diameter (mm)
- Ear length (cm)
- Yield: was measured in kilogram/m2 following the formula here beyond.
Yield = (FW * (100 − FGM/100 − DGM) * (GW/EW) * (1/UA)) (1)
where:
FW: Field Weigh
FGM: Field Grain Moisture
DGM: Dry Grain Moisture
GW: Grain Weigh
EW: Ear Weigh
UA: Useful Area
- Grain loss (%): weight of the grains of a treatment with damage on weight of
grains of the control without damage multiplied by a hundred.
Statistical analyzes:
DOI: 10.4236/oalib.1107217 5 Open Access Library JournalJ. P. K. Tshiabukole et al.
The collected data were analyzed using packages agricolae and FactomineR of
R3.1.3 software to determine difference among treatments by analysis of va-
riance following the linear model (aov (y~Trait3*Trait2* Trait1+error (repli-
cation/Trait princ)) with respect to various growing and yield parameters. The
means of treatment that exhibited significant differences were separated using
the least significant difference (LSD) post-hoc test. A principal component anal-
ysis (PCA) to detect the correlations between the variables studied.
3. Results and Discussion
3.1. Analysis of Variance of Study Parameters
Table 3 shows the effects of factors and their interaction on characteristics pa-
rameters observed during plant growth and yield parameters.
With regard to Table 3, it can be seen that the damage caused by defoliation,
the growth stage and their combined effect influenced significantly (p < 0.05) the
number of ears harvested, the ear sizes (diameter and length), the harvest rate,
the percentage of marketable ears, the yield and the yield losses. No significant
difference (p > 0.05) was observed between treatments for the number of plants
per plot. However, the variety factor and most of its effects interacting with the
other factors did not directly influence (p > 0.1) the yield as well as the compo-
nents of the yield (loss, harvest rate, marketable ears, size of ears).
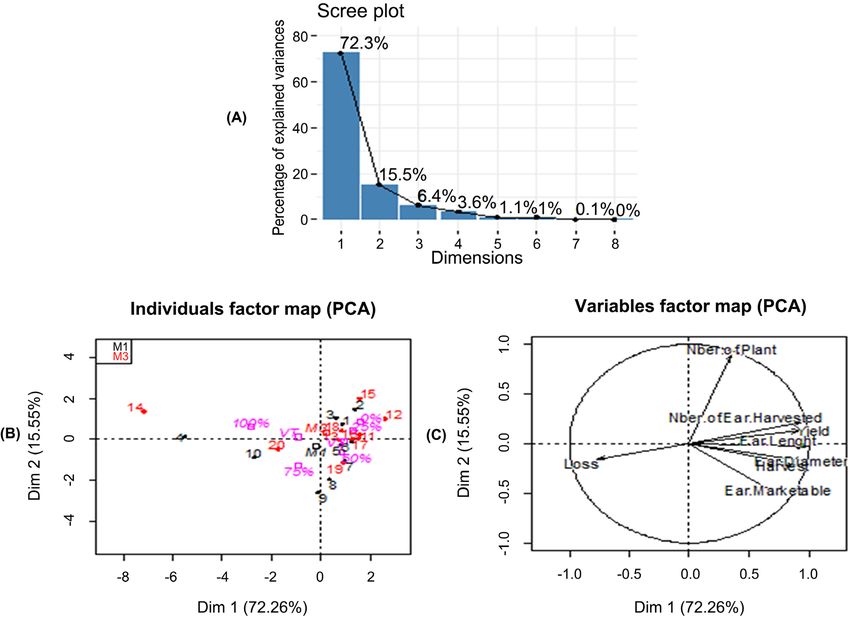
3.2. Principal Component Analysis (PCA)
PCA was performed on 8 active variables characterizing the treatments based on
the data of the combination of factors. More than 87% of variability are
represented on the plane formed by two exes Dim1 and Dim2 (Figure 3(A)).
Dim1 is characterized by strong correlations between variables. This dimension
benefits from the strong contributions of variables linked to productivity, in-
cluding loss, yield, harvest rate, ear size, number of ears harvested. Losses are
greatest when yields are low, however the other variables correlate positively
with each other variables. Dim2 is characterized only by the number of plants
Table 3. Analysis of variance.
Nber of Ear Ear Diameter Ear Lenght
Factors Nber of Plant Ear Market % Harvest % Yield (kg /m2) Loss %
Harvested (mm ) (cm )
Var 0.108 0.004835** 0.41 0.772865 0.85085 0.0160* 0.157555 0.1931
Dmg 0.112 1.14e−07*** 1.21e−08*** 7.18e−07*** 0.00125** 1.54e−15*** 0.000187*** 1.12e−07***
Gstp 0.831 0.000534*** 0.000154*** 0.000282*** 0.00884** 5.89e−10*** 0.000953*** 0.0124*
Var * Dmg 0.500 0.593354 0.512405 0.513076 0.31872 0.6571 0.631025** 0.6244.
Var * Gstp 0.943 0.277669 0.615947 0.285471 0.84882 0.0969. 0.978240 0.1523
Dmg * Gstp 0.631 5.53e−06*** 8.67e−08*** 3.03e−07*** 0.00846** 1.35e−13*** 0.000456*** 0.0441*
Var * Dmg * Gstp 0.732 0.545530 0.279982 0.701105 0.48768 0.6835 0.807966 0.4680
Sig[10]Nif. codes: 0 “***” 0.001 “**” 0.01 “*” 0.05 “.” 0.1 “ ” 1, Var = Variety; Dmg = Damage; Gstp = Growht stape; V3: 3 to 4 weeks after sowing; VT: Flo-
wering stage.
DOI: 10.4236/oalib.1107217 6 Open Access Library JournalJ. P. K. Tshiabukole et al.
Figure 3. A. Scree plot, B. Individuals factor map and C. variable factor map according to PCA.
per plot (Figure 3(C)). Less dispersion of varieties was observed around two
axes (Figure 3(B)). However, there was a large dispersion of the damage rate
factor compared to two axes. Based on the contributions of the factors on Dim1
(Figure 3(B)), it seems that the two varieties M1 and M3 combine similar values
of the variables studied. However, there is a wide dispersion in damage rates.
3.3. Number of Plants per Plot
For all factors taken individually and in interaction of factors, the number of
plants per plot varied from 5.33 to 9.66 plants respectively for T3.1 and T1.2
(Table 4). The results of analysis of variance showed non-significant effects (p >
0.05) of factors and interactions between factors on the number of plant per plot.
However, there were noticeable variations between the factors resulting in a
large coefficient of variation. These variations should be linked to variety effects
(p = 0.1) by looking at Table 3.
3.4. Number of Ears Harvested
Regardless of variety, the number of ears harvested per plot varied significantly
between the factors and interactions studied. The highest number, 9.66 ears per
m2, was recorded at T1.1 and the lowest number, 0 ears per m2, was recorded at
T9.2. In general, the low numbers of ears harvested were recorded for two varie-
ties subjected to 100% of defoliation at flowering stage (VT). High numbers of
DOI: 10.4236/oalib.1107217 7 Open Access Library JournalJ. P. K. Tshiabukole et al.
Table 4. Comparative study of growing, yield and yield losing variables.
Nber of Nber of Ear Ear Diameter Ear Lenght Ear Marketable
Treatment Harvest (%) Yield (kg /m2) Loss (%)
Plant/plot Harv/plot (mm ) (cm ) (%)
T0.1 7.66abcd 7.00abcdef 46.82a 15.79a 40.52cde 92.50bcd 0.24ab 0.00g
T0.2 7.33abcd 8.33abc 44.66a 15.53a 55.92abcde 114.28a 0.27ab 0.00g
T1.1 7.33abcd 6.33bcdef 48.07a 14.29ab 72.22abcd 86.90bcde 0.22ab 8.44fg
T1.2 9.66a 9.66a 44.47a 15.37a 61.85abcde 100.00abc 0.28ab 43.31cdef
T2.1 6.66bcd 6.66bcdef 46.06a 13.45abc 84.12ab 100.00abc 0.22ab 8.00fg
T2.2 8.00abcd 8.00abcd 46.52a 14.65ab 84.12ab 100.00abc 0.27ab 49.83cdef
T3.1 5.33d 4.66ef 46.50a 13.39abc 90.47a 92.59bcd 0.20bc 55.33bcde
T3.2 7.00abcd 7.00abcdef 47.16a 15.81a 90.47a 100.00abc 0.27ab 75.88abcd
T4.1 8.33abc 7.00abcdef 43.69a 15.12a 50.99bcde 85.00cde 0.28ab 38.30cdefg
T4.2 7.33abcd 7.33abcde 45.33a 15.70a 57.61abcde 100.00abc 0.22ab 34.17defg
T5.1 8.66ab 8.33abc 48.69a 16.49a 45.50bcde 95.83bcd 0.22ab 0.00g
T5.2 8.66ab 9.00ab 48.61a 17.29a 76.38abc 100.33ab 0.35a 0.00g
T6.1 7.66abcd 7.33abcde 48.41a 16.35a 73.33abc 95.23bcd 0.29ab 50.53cdef
T6.2 7.66abcd 7.33abcde 48.63a 16.39a 73.14abc 94.44bcd 0.30ab 21.70efg
T7.1 5.66cd 5.66cdef 46.15a 14.59ab 77.77abc 100.00abc 0.18bcd 25.26efg
T7.2 8.00abcd 8.33abc 46.46a 14.48ab 60.33abcde 100.33ab 0.20bc 41.62cdefg
T8.1 6.00bcd 4.33f 37.06a 8.95cd 30.00ef 74.60e 0.05de 76.91g
T8.2 7.00abcd 5.33def 41.21a 10.33bc 50.00bcde 79.36de 0.07cde 78.73abc
T9.1 7.00abcd 0.33g 16.90b 5.00b 33.33def 3.70f 0.01e 93.89ab
T9.2 7.33abcd 0.00g 0.00c 0.00e 0.00f 0.00f 0.00e 100.00a
CV 24.3 25.65 16.95 21.10 39.20 12.22 41.41 64.60
LSD 2.9 2.7 11.77 4.68 39.10 17.36 0.14 42.78
ears harvested were associated with low damage rates at three weeks after sowing
(V3). No damage (0%) to flowering resulted in the maintenance of a high num-
ber of ears harvested per plot. Decrease in number of grain on the ear (cob) was
probably the result of floral primordial or a slight pollination of the dichogamy
[28]. Both varieties had a high yield in treatments without defoliation. This situ-
ation can be explained by the fact that in maize, the grain yield is determined by
the quantity of silk and by the length of the period during which the sensitivity is
very high [29] [30] [31].
3.5. Diameter and Length of the Ear (Cob)
The averages of diameters of the ears were appreciably affected by the factors
caused damage, stage of growth and their interaction. These averages varied be-
tween 0 mm and 47.1 mm respectively for T4.2 and T3.2. Low values of ear di-
ameter were recorded for high damage rates during the flowering stage (VT).
Similarly to the ear diameter, the ear length was significantly influenced by the
DOI: 10.4236/oalib.1107217 8 Open Access Library JournalJ. P. K. Tshiabukole et al.
same factors. Length values varied between 0 and 17.29 cm respectively for T9.2
and T5.2. [32] [33] observed that defoliation decreases the size of the ears and it
seems that the weight of the grains is more dependent on the genetic factor than
on the environmental factor. Following [33], ear length and weight had a posi-
tive and significant correlation with all treatment. However, [34] observed that
defoliation had non-significant effect on ear length.
Based on results, length ear decreased by 12% to 100% in VT treatments,
where as other treatments do not have significant effect on ear length (Table 4).
These results are in agreement with the finding of [35]. It is indicated that ear
length is most affect by some factor such as defoliation time, intensity of defolia-
tion and position of leaves on the plant [36] [37].
3.6. Marketable Ear Rate
Marketable ear rates varied between 0% and 90.47% respectively for T9.2 and
T3.1, T3.2. Most of the healthy ears were harvested under V3. Figure 4 shows
the appearance quotations of the ears rated from 1 to 5 compared to the treat-
ment corresponding to flowering stage. The ears of the plants that did not loosed
leaves (0%) had a quote = 1, which is marketable. Plants treated with 25% dam-
age produced ears with a quote score of 1.5 to 2. Plants treated with 50% damage
showed ears quoted 2.5 to 3.5. As for the plants treated at 75% of damage, the
quotation was 3.5 to 4, while the full defoliated plants (100%), ears had a quota-
tion greater than 4.5, reducing significantly the rate of ear marketable.
3.7. Harvest Rate
Regarding Table 4, is appears that the best harvest rates were recorded after
treatments before flowering stage or at V3. The damage caused at stage V3 had
no negative effects (p > 0.05) on the production of grain. Low harvest rates
(0.00% and 3.70%) were recorded respectively in treatments T9.2 and T9. [35]
also reported damage to the silk of maize at 50% until 10 days later, which re-
duced yield by reducing the number of ears after 20 days or more, the yield was
reduced by reducing the weight of a thousand grains. Various reports also indi-
cated that a partial defoliation of about 25% to 33% did not change the weight of
the seeds at any stage of seed development.
Figure 4. Damage rate (0%, 25%, 50%, 75%, 100%) and ear quotation (quot = 1 to 5).
DOI: 10.4236/oalib.1107217 9 Open Access Library JournalJ. P. K. Tshiabukole et al.
3.8. Grain Yield
Estimated per m2, this yield varied between 0.00 kg/m2 and 0.35 kg/m2 respec-
tively for T9.2 and T5.2 (Table 4). The best productivity was recorded at the
control treatment corresponding to 0% damage at V3 and VT. Productivity per
m2 was significantly affected (p < 0.05) by damage rate and growth stage. Varie-
ties used did not influenced the yield after two periods of simulated attack.
Several biotics and abiotics stresses affect the yield of maize through defolia-
tion. [38] reported that the critical rate of defoliation in maize was 50%; this rate
did not affect grain yield and its components.
In accordance with the study made by [39] on sunflowers (Helianthus annuus
L.), the yield has been greatly reduced by defoliation at the pre-flowering stage.
This is similar to complete defoliation was more detrimental and caused yield
loss of 6.4% to 82% compared to partial defoliation with loss of yield of 1.5% to
32.7%. These losses varied with the time of application of the treatment.
Still according to [35], the yield component most affected by leaf loss, for the
entire treatment period, was the grain weight decrease from 12.7% to 53%.
However, the number of grains was considerably reduced by 62.3% when all the
leaves were removed 10 days after the appearance of the silk. Thus, the partial
leaf removal affected the number of grains much less, approximate decline, 20%.
According to [33], the maize plant in complete defoliation had the lowest grain
yield, ear weight, number of rows per ear, ear weight and 100 grain weight, but
had a percentage, higher grain germination rate and high vigor.
According to [40], the reduction in grain yield was associated with the num-
ber of defoliated leaves and this reduction was linked to the decrease in grain
number. Based on the results of the trial, early defoliation in the reproductive
phase causes yield losses by reducing the number of grains [41].
3.9. Grain Yield Losses
The average of grain yield losses (loss) varied between 0% and 100% regardless
to varieties. These values corresponded respectively for 0% of damage and 100%
of damage occurring at two growth stages. The losses observed were associated
with the high damage rates and they are more accentuated with the damage
caused during the flowering stage (VT).
According to [42], percentage yield loss is depending on factors such as on the
amount of removed leaves, leaf position on plant and also defoliation time. This
hypothesis can be explain by [43], who suggested that the near leaves to ear are
main factor of increasing dry matters and growth rate during the development.
This study showed that a significant loss of leaves at the beginning of silk and
up to at least 10 days after 50% of silk had resulted in a reduction in grain yield
due to the reduction in the number of grains and regardless of the severity, de-
foliation in the days after the appearance of the silk considerably reduced the
accumulated dry matter [35]. However, the yield declines associated with less
severe leaf loss or leaf loss at least 20 days after 50% silk were largely related to a
DOI: 10.4236/oalib.1107217 10 Open Access Library JournalJ. P. K. Tshiabukole et al.
decrease in grain weight. In addition to providing a better understanding of the
patterns of dry matter accumulation, these data can be useful for individuals
who are required to estimate grain yield after significant loss, due to natural
causes, of the leaf area of the plant [35].
4. Conclusion
Results of this study showed that cutting of leaves decreases yield because of
diminishing of number of grains. In addition, some variables including ear (cob)
sizes, percentage of harvest and rate of ear harvested, are decreased at upper
than 25% of defoliation. According to stage of growth imposed on plant, (V3) or
(VT), the most change caused by defoliation seen on traits related to yield such
as rate of ear harvested, rate of ear marketable and this cause to decrease in yield.
This indicates the early reproductive phase specially flowering and pollination is
more sensible to any harmful factor to leaves. Concerning the simulation of
FAW attacks, the defoliation around 75% or total defoliation at 100% at stage V3
and VT would be the critical threshold, because they induce negative effects on
the yield causing losses of more than 50%. Full defoliation severely reduced the
grain yield and affected its marketability. However, simulations of less than 50%
of damage, occurring at growth stage V3, caused losses of less than 10%. Varie-
ties Mudishi-1 and Mudishi-3 would be able to compensate for losses due to
damage up to 25%, occurring at stage V3.
Acknowledgements
The author would like to acknowledge the staff of the National Institute for
Agricultural Study and Research (INERA-Mvuazi) for their assistance during the
execution of the research.
Conflicts of Interest
The authors declare no conflicts of interest regarding the publication of this
paper.
References
[1] Sparks, A.N. (1979) A Review of the Biology of the Fall Armyworm. The Florida
Entomologist, 62, 82-87. https://doi.org/10.2307/3494083
[2] Pashley, D.P. (1988) Current Status of Fall Armyworm Host Strains. The Florida
Entomologist, 71, 227-234. https://doi.org/10.2307/3495425
[3] Buntin, G.D. (1986) A Review of Plant Response to Fall Armyworm, Spodoptera
frugiperda (J. E. Smith), Injury in Selected Field and Forage Crops. The Florida En-
tomologist, 69, 549. https://doi.org/10.2307/3495389
[4] Wyckhuys, K.A.G. and O’Neil, R.J. (2006) Population Dynamics of Spodoptera fru-
giperda Smith (Lepidoptera: Noctuidae) and Associated Arthropod Natural Ene-
mies in Honduran Subsistence Maize. Crop Protection, 25, 1180-1190.
https://doi.org/10.1016/j.cropro.2006.03.003
[5] FAO and CABI (2019) Community-Based Fall Armyworm (Spodoptera frugiperda)
DOI: 10.4236/oalib.1107217 11 Open Access Library JournalJ. P. K. Tshiabukole et al.
Monitoring, Early Warning and Management, Training of Trainers Manual. 1st
Edition, Food and Agriculture Organization of the United Nations, Rome.
[6] FAO (2017) Note d’information du Groupe Inter Bailleurs pour l’Agriculture et le
Développement Rural en République démocratique du Congo sur la che[10]Nille
légionnaire d’automne.
http://cd.one.un.org/content/unct/rdc/fr/home/actualites/attaque-de-che[10]Nilles-
legionnaires-sur-les-cultures-de-mais.html
[7] Hruska, A.J. and Gladstone, S.M. (1988) Effect of Period and Level of Infestation of
the Fall Armyworm, Spodoptera frugiperda, on Irrigated Maize Yield. The Florida
Entomologist, 71, 249. https://doi.org/10.2307/3495428
[8] Aguire, L.A., Hernández-Juàrez, A., Flores, M., Cerna, E., Landeros, J., Frías, G.A.
and Harris, M. K. (2016) Evaluation of Foliar Damage by Spodoptera frugiperda
(Lepidoptera: Noctuidae) to Genetically Modified Corn (Poales: Poaceae) in Mex-
ico. Florida Entomologist, 99, 276-280. https://doi.org/10.1653/024.099.0218
[9] Cruz, I., Figueiredo, M.L.C., Oliveira, A.C. and Vasconcelos, C.A. (1999) Damage of
Spodoptera frugiperda (Smith) in Different Maize Genotypes Cultivated in Soil un-
der Three Levels of Aluminium Saturation. International Journal of Pest Manage-
ment, 45, 293-296. https://doi.org/10.1080/096708799227707
[10] Ni, X., Xu, W., Blanco, M.H. and Williams, W.P. (2014) Evaluation of Fall Army-
worm Resistance in Maize Germplasm Lines Using Visual Leaf Injury Rating and
Predator Survey. Insect Science, 21, 541-555.
https://doi.org/10.1111/1744-7917.12093
[11] Baubron, F., Zaman-Allah, M.A., Chaipa, I., Chari, N. and Chinwada, P. (2019)
Understanding the Factors Influencing Fall Armyworm (Spodoptera frugiperda J.E.
Smith) Damage in African Smallholder Maize Fields and Quantifying Its Impact on
Yield. A Case Study in Eastern Zimbabwe. Crop Protection, 120, 141-150.
https://doi.org/10.1016/j.cropro.2019.01.028
[12] Midega, C.A.O., Pittchar, J.O., Pickett, J.A., Hailu, G.W. and Khan, Z.R. (2018) A
Climate-Adapted Push-Pull System Effectively Controls Fall Armyworm, Spodop-
tera frugiperda (J E Smith), in Maize in East Africa. Crop Protection, 105, 10-15.
https://doi.org/10.1016/j.cropro.2017.11.003
[13] CABI (2019) Fall Armyworm (FAW) in “Invasive Species Compendium”.
https://www.cabi.org/isc/fallarmyworm
[14] Goergen, G., Kumar, P.L., Sankung, S.B., Togola, A. and Tamò, M. (2016) First Re-
port of Outbreaks of the Fall Armyworm Spodoptera frugiperda (J E Smith) (Lepi-
doptera, Noctuidae), A New Alien Invasive Pest in West and Central Africa. PLoS
ONE, 11, e0165632. https://doi.org/10.1371/journal.pone.0165632
[15] Nagoshi, R.N., Meagher, R.L. and Hay-Roe, M. (2012) Inferring the Annual Migra-
tion Patterns of Fall Armyworm (Lepidoptera: Noctuidae) in the United States from
Mitochondrial Haplotypes. Ecology and Evolution, 2, 1458-1467.
https://doi.org/10.1002/ece3.268
[16] Abrahams, P., Bateman, M., Beale, T., Clottey, V., Cock, M., Colmenarez, Y., Cor-
niani, N., Day, R., Early, R., Godwin, J., Gomez, J., Moreno, G.P., Murphy, S.T.,
Oppong-Mensah, B., Phiri, N., Pratt, C., Richards, G., Silvestri, S. and Witt, A.
(2017) Fall Armyworm: Impacts and Implications for Africa. Outlooks on Pest
Management, 28, 196-201.
[17] Day, R., Abrahams, P., Bateman, M., Beale, T., Clottey, V., Cock, M., Colmenarez,
Y., Natalia, C., Early, R., Godwin, J., Gomez, J., Moreno, P.G., Murphy, S.T., Op-
pong-Mensah, B., Phiri, N., Pratt, C., Richards, G., Silvestri, S. and Witt, A. (2017)
DOI: 10.4236/oalib.1107217 12 Open Access Library JournalJ. P. K. Tshiabukole et al.
Fall Armyworm: Impacts and Implications for Africa. Outlooks on Pest Manage-
ment, 28, 196-201. https://doi.org/10.1564/v28_oct_02
[18] Kumela, T., Simiyu, J., Sisay, B., Likhayo, P., Mendesil, E., Gohole, L. and Tefera, T.
(2019) Farmers’ Knowledge, Perceptions, and Management Practices of the New
Invasive Pest, Fall Armyworm (Spodoptera frugiperda) in Ethiopia and Kenya. In-
ternational Journal of Pest Management, 65, 1-9.
https://doi.org/10.1080/09670874.2017.1423129
[19] FAO (2018) Gestion intégrée de la chenille légionnaire d’automne sur le maïs. Un
guide pour les champs-écoles des producteurs en Afrique. Organisation des Nations
Unies pour l’alimentation et l’agriculture, Rome, 136.
[20] Prasanna, B.M., Huesing, J.E., Eddy, R. and Peschke, V.M. (2018) Fall Armyworm
in Africa: A Guide for Integrated Pest Management. 2018. Vii, 109 pages: il. México.
CIMMYT. USAID.
[21] Tshaibukole, J.P.K. (2018) Evaluation de la sensibilité aux stress hydriques du maïs
(Zea mays L.) cultivé dans la savane du Sud-Ouest de la RD Congo, cas de Mvuazi.
Université Pédagogique Nationale, Democratic Republic of the Congo.
[22] Köppen, W. (1936) Das Geographische System der Klimate. In: Köppen W. and
Geiger, H., Eds., Handbuch der Klimatologie, Gebr, Borntraeger, Berlin, 1-44.
[23] Fakorede, M.A.B., Badu-Apraku, B., Kamara, A.Y., Menkir, A., and Ajala, S.O. (2003)
Maize Revolution in West and Central Africa. An Overview Proceedings of a Re-
gional Maize Workshop, IITA-Cotonou, Republic of Benin, date, 14-1.
[24] FAO (1997)
[25] Kabongo, T., Pongi, K., Mumba, J., Mbuya, K., Kizungu, V. and Kabwe, K. (2016) A
Evaluation of Maize Sensitivity in Southwestern Savannah Area of DR Congo. Afri-
can Journal of Agricultural Science and Technology, 4, 812-817.
[26] Mbuya, K., Nkongolo, K.K., Narendrula, R., Kalonji-Mbuyi, A. and Kizungu, R.V.
(2010) Participatory Selection and Characterization of Quality Protein Maize
(QPM) Varieties in Savanna Agroecological Region of DR-Congo. Journal of Plant
Breeding and Crop Science, 2, 325-332.
[27] Dhopte, A.M. (1984) Effect of Simulated Damage Done to Maize Plants by Voedeer
(Caprolus). Field Crops Research, 37, 111-114.
[28] Jones, R.J. and Simmons, S.R. (1983) Effect of Altered Source-Sink Ratio on Growth
of Maize Kernels. Crop Science, 23, 129-134.
https://doi.org/10.2135/cropsci1983.0011183X002300010038x
[29] Minami, M. (1991) Analytical Studies on High Yielding Ability of Hybrid Maize
(Zea mays L.) from the Standing Point of Development Morphology. Journal of the
Faculty of Agriculture Shinshu University, 24, 155-164.
[30] Mouhamed, S.G.A. and Ouda, S.A.H. (2006) Predicting the Role of Some Weather
Parameters on Maize Productivity under Different Defoliation Treatments. Journal
of Applied Sciences Research, 2, 920-925.
[31] Maposse, I.C. and Nhampalele, V.V. (2009) Performance of Cowpea Varieties un-
der Different Defoliation Regimes for Multiple Uses. 9th African Crop Science,
Conference Proceedings, Cape Town, South Africa, 28 September-2 October 2009,
279-281.
[32] Heidari, H. (2015) Effect of Defoliation Based on Leaf Position on Maize Yield,
Yield Components and Produced Seed Germination. Bulg. Bulgarian Journal of
Agricultural Science, 21, 801-805.
[33] Heidari, H., Bahraminejad, S., Maleki, G. and Papzan, A.H. (2009) Response of
DOI: 10.4236/oalib.1107217 13 Open Access Library JournalJ. P. K. Tshiabukole et al.
Cumin (Cuminum cyminum L.) to Sowing Date and Plant Density. Research Jour-
nal of Agriculture and Biological Sciences, 5, 597-602.
[34] Fasae, O.A., Adu, F.I., Aina, A.B.J. and Elemo, K.A. (2009) Effects of Defoliation
Time of Maize on Leaf Yield, Quality and Storage of Maize Leafs as Dry Season Fo-
rage for Ruminant Production. Revista Brasileira de Ciências Agrárias, 4, 353-357.
[35] Egharevba, P.N., Horrocks, R.D. and Zuber, M.S. (1976) Dry Matter Accumulation
in Maize in Response to Defoliation1. Agronomy Journal, 68, 40-43.
https://doi.org/10.2134/agronj1976.00021962006800010011x
[36] Thomison, P.R. and Nafziger, E.D. (2003) Defoliation Affects Grain Yield, Protein,
and Oil of TopCross High-Oil Corn. Crop Management, 2, 1-9.
https://doi.org/10.1094/CM-2003-1027-01-RS
[37] Tilahum, A. (1993) Quantitative and Physiological Traits in Maize (Zea mays). As-
sociated with Different Levels of Moisture, Plant Density and Leaf Defoliation in
Ethiopia. IARP, 74-80.
[38] Zewdu, T. and Asregid, D. (2001) Effect of Growing Annual Forage Legumes with
Maize and Maize Leaf Defoliation on Grain and Stover Yield Components and Un-
dersown Forage Production. Seven Eastern and Southern Africa Regional Maize
Conference, Southern Africa, August 2001, 487-490.
[39] Erbas, S. and Baydar, H. (2007) Defoliation Effects on Sunflower (Helianthus an-
nuus L.) Seed Yield and Oil Quality. Turkish Journal of Biology, 31, 115-118.
[40] Allison, J.C.S. and Watson, D.J. (1966) The Production Distribution of Dry Matter
in Maize after Flowering. Annals of Botany, 30, 365-381.
https://doi.org/10.1093/oxfordjournals.aob.a084082
[41] Siahkouhian, S., Shakiba, M.R., Salmasi, S.Z., Golezani, K.G. and Toorchi, M. (2012)
Defoliation Effects on Yield Components and Grain Quality of Three Corn Culti-
vars. International Conference on Environment, Agriculture and Food Sciences,
Phuket, 11-12 August 2012.
[42] Shapiro, C.A., Peterson, T.A. and Flowerday, A.D. (1986) Yield Loss due to Simu-
lated Hail Damage on Corn: A Comparison of Predicted and Actual Values. Agrono-
my Journal, 78, 585-589.
https://doi.org/10.2134/agronj1986.00021962007800040006x
[43] Barimavandi, A.R., Sedaghathoor, S. and Ansari, R. (2010) Effect of Different De-
foliation Treatments on Yield and Yield Components in Maize (Zea mays L.) Culti-
var of S.C704. Australian Journal of Crop Science, 4, 9-15.
DOI: 10.4236/oalib.1107217 14 Open Access Library JournalYou can also read