SURFACE PLASMON RESONANCE ENHANCEMENT OF PHOTOLUMINESCENCE INTENSITY AND BIOIMAGING APPLICATION OF GOLD NANOROD@CDSE/ZNS QUANTUM DOTS - JOURNALS
←
→
Page content transcription
If your browser does not render page correctly, please read the page content below
Surface plasmon resonance enhancement of
photoluminescence intensity and bioimaging
application of gold nanorod@CdSe/ZnS quantum dots
Siyi Hu1, Yu Ren2, Yue Wang2, Jinhua Li2, Junle Qu3, Liwei Liu*3, Hanbin Ma*1
and Yuguo Tang1

  Full Research Paper                                                                                                    Open Access

  Address:                                                              Beilstein J. Nanotechnol. 2019, 10, 22–31.
  1CAS Key Laboratory of Bio-Medical Diagnostics, Suzhou Institute of   doi:10.3762/bjnano.10.3
  Biomedical Engineering and Technology, Chinese Academy of
  Sciences, Suzhou 215163, P. R. China, 2School of Science,             Received: 20 August 2018
  Changchun University of Science and Technology, Changchun             Accepted: 16 November 2018
  130022, P. R. China and 3College of Optoelectronic Engineering,       Published: 03 January 2019
  Shenzhen University, Shenzhen 518060, P. R. China
                                                                        Associate Editor: A. J. Meixner
  Email:
  Liwei Liu* - liulw@szu.edu.cn; Hanbin Ma* - mahb@sibet.ac.cn          © 2019 Hu et al.; licensee Beilstein-Institut.
                                                                        License and terms: see end of document.
  * Corresponding author

  Keywords:
  bioimaging; gold nanorods; photoluminescence enhancement;
  quantum dots

Abstract
Biological applications of core/shell near-infrared quantum dots (QDs) have attracted broad interest due to their unique optical and
chemical properties. Additionally, the use of multifunctional nanomaterials with near-infrared QDs and plasmonic functional nano-
particles are promising for applications in electronics, bioimaging, energy, and environmental-related studies. In this work, we ex-
perimentally demonstrate how to construct a multifunctional nanoparticle comprised of CdSe/ZnS QDs and gold nanorods (GNRs)
where the GNRs were applied to enhance the photoluminescence (PL) of the CdSe/ZnS QDs. In particular, we have obtained the
scattering PL spectrum of a single CdSe/ZnS QD and GNR@CdSe/ZnS nanoparticle and comparison results show that the CdSe/
ZnS QDs have an apparent PL enhancement of four-times after binding with GNRs. In addition, in vitro experimental results show
that the biostability of the GNR@CdSe/ZnS nanoparticles can be improved by using folic acid. A bioimaging study has also been
performed where GNR@CdSe/ZnS nanoparticles were used as an optical process for MCF-7 breast cancer cells.

Introduction
In the past decades, quantum dots (QDs) have proven to be                 generation of luminescence materials, and they have been
increasingly useful for their unique features [1-5]. The light            widely used as nanoprobes for bioimaging and biosensing. As
emission from QDs can be easily tuned from the visible to the             semiconductor nanocrystals, their large surface-to-volume ratio
near-infrared (NIR) spectrum. QDs have emerged as the next                is advantageous and they show excellent quantum confinement

                                                                                                                                      22
Beilstein J. Nanotechnol. 2019, 10, 22–31.

for charge carrier and lattice mismatch. In such cases, the          tron oscillations along the long and short axes of the particle.
energy range of the QDs depends on the relative conduction and       Their surfaces can be easily modified with other chemicals due
valence band offsets for the two materials, and this character-      to the large area-to-volume ratio of GNRs. Also, there is a posi-
istic can enable many chemical materials or biomolecules to          tive charge coating on the GNR surface, so it is easily conju-
conjugate with them [6-12]. Research conducted to date shows         gated with QDs due to the negative charge of the QD surface.
that the fluorescence intensity of QDs changes when other            The excellent stability and biocompatibility of GNRs has been
chemical materials or ions are added. The CdSe/ZnS hetero-           reported by several researchers, and they are being investigated
structures of QDs are of interest due to their high quantum effi-    as a probe for photothermal therapy in nanomedicine. The pres-
ciency [13-15].                                                      ence of longitudinal surface plasmon resonance (LSPR)
                                                                     provides GNRs with richer optical properties, which lead to
Furthermore, the heterostructure formed with metals and semi-        local field, Raman, and fluorescence enhancement. When QDs
conductors, i.e., plasmonic, composite QD nanostructures,            bind with GNRs, the fluorescence intensity of the QDs is en-
provides another efficient way to tune the unique optical prop-      hanced by the near-fired plasmonic resonance from the GNR
erties. In the past decades, much attention has been given to the    surface and their photoluminescence (PL) emission increases
development of metal-enhanced optical properties. Some               [20-23].
researchers have noted that certain metal materials play a role in
the enhancement of fluorescence in QDs, especially gold              Richard A. Vaia and co-authors reported a five times higher
nanorods (GNRs) and Cu or Ca+ ion binding of QDs [16-19].            fluorescence enhancement by organizing QDs on GNRs, and
                                                                     Anjali Kshirsagar et al. reported the electronic structure of free-
GNRs possess two plasmonic resonance bands – a longitudinal          standing and gold-attached passivated CdSe nanorods [24,25].
band and a transverse band. These bands correspond to the elec-      These studies covered the synthesis of GNR@CdSe/ZnS nano-

 Figure 1: Schematic of GNR@CdSe/ZnS and GNR@CdSe/ZnS@FA.

                                                                                                                                        23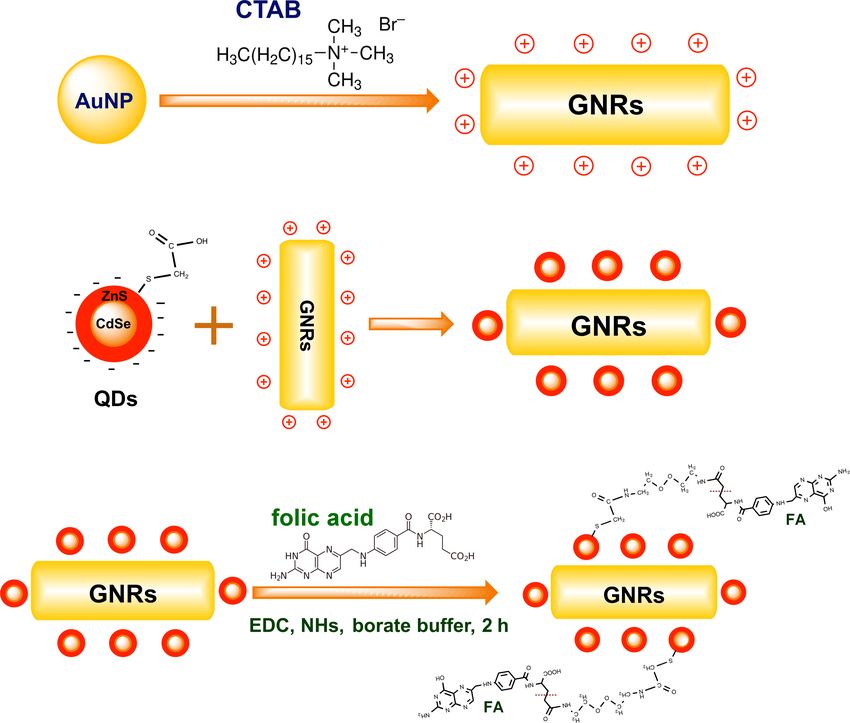
Beilstein J. Nanotechnol. 2019, 10, 22–31.

particles using different methods; however, most of these syn-                  According to current knowledge, when bulk semiconductor
thesis methods are complicated, and it is difficult to reproduce                nanomaterials are irradiated with light of a certain wavelength,
their preparation and desired applications. It is desirable to find             the valence electrons transition back to the conduction band.
a simple method to synthesize GNR@CdSe/ZnS nanoparticles                        Most of the conduction band electrons fall back into the deep
in aqueous-phase which exhibit high PL emission and optimize                    electron traps and nonradiative transitions take the form of
the bioconjugated surfaces of these nanoparticles for biological                quenching. Semiconductor QDs with relatively shallow surface
application and therapy of human diseases [26,27].                              electron traps and holes can easily capture electrons to the
                                                                                conduction band. At the same time, the transition radiation
In this work, we demonstrated a novel GNR@CdSe/ZnS multi-                       returns to the valence band, emitting a photon. The PL charac-
modal nanostructure in aqueous phase. We chose CdSe/ZnS                         teristics are, therefore, better than in materials which have deep
QDs as a PL contributor due to its high degree of brightness,                   traps in the bulk semiconductor material. This finding suggests
excellent photostability, and good spectral overlap with GNRs.                  that when metal or chemical materials are doped with QDs, the
We then used the GNRs to enhance the PL intensity of the                        number of surface trap states (which can lead to exponential PL
CdSe/ZnS QDs. The PL from GNR@CdSe/ZnS nanoparticles is                         decay) is affected by the surface passivation and by the degree
approximately four times more than that from CdSe/ZnS QDs.                      of quantum confinement. In CdSe/ZnS QDs with higher defect
Finite difference time domain (FDTD) simulations were also                      densities, binding with GNRs having very heterogeneous ener-
conducted to understand the plasmon coupling effect on PL en-                   getic metal-derived states showed that their PL could be charac-
hancement. Additionally, we investigated the PL signal from a                   terized by band edge dispersion in different sizes of CdSe/ZnS
single particle, which indicated a stronger PL intensity com-                   QDs and GNRs and that the PL contribution varied in these new
pared to that of CdSe/ZnS QDs alone. We also prepared the                       states. The physical or chemical origin of these features was not
GNR@CdSe/ZnS modified with folic acid (FA) in cell culture                      clear, and this will be a subject of future research. We chose the
for biological applications. These studies indicated that these                 longer absorption peak of the GNRs as equivalent to the QD PL
multifunctional nanoparticles were of low toxicity and had                      emission peak. When the QDs and GNRs are coupled together,
bright luminescence, which make them suitable for biosensor                     two kinds of nanostructured particles were combined by mutual
and optical detection studies.                                                  electrostatic adsorption. The PL of the QDs could then be used
                                                                                as the light source to excite the LSPR of the GNRs in a way that
Results and Discussion                                                          the QD PL is enhanced when the GNR LSPR interacts with the
The scheme for the synthesis of GNR@CdSe/ZnS and                                QD PL plane wave.
GNR@CdSe/ZnS@FA is illustrated in Figure 1. Firstly, the
CdSe/ZnS QDs bind with GNRs kept at a 5 nm distance using                       As shown in Figure 2a, from the FDTD simulation results we
the combined strong electrostatic adsorption. Secondly, FA was                  can see that (1) the highest PL enhancement, at 630 nm,
conjugated with this composite nanoparticle for biological ap-                  occurred when d (d is the dipole-source center to GNR-center
plications, where the FA renders the nanoparticle useful for the                length) was set at 25 nm and (2) there is a slight enhancement at
specific targeting of cancer cells [28,29].                                     526 nm, which is the short axis of the GNRs. That means when

 Figure 2: The simulation results of (a) photoluminescence enhancement as a function of wavelength and (b) wavelength and photoluminescence of
 GNRs under polarized light. The inset images inserted are the FDTD simulation of the electric field intensity distribution (indicated by the color bar) of
 the gold nanorods.

                                                                                                                                                              24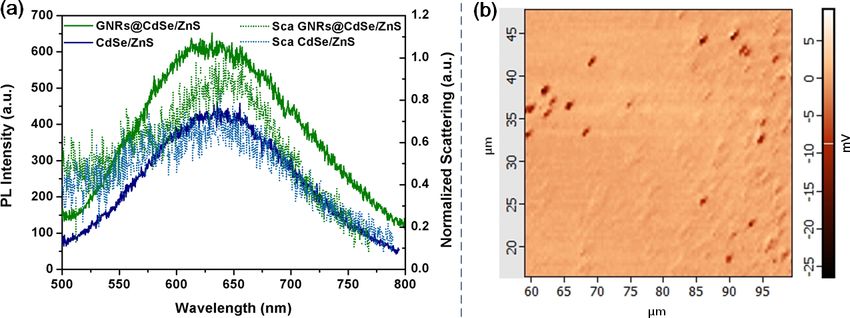
Beilstein J. Nanotechnol. 2019, 10, 22–31.
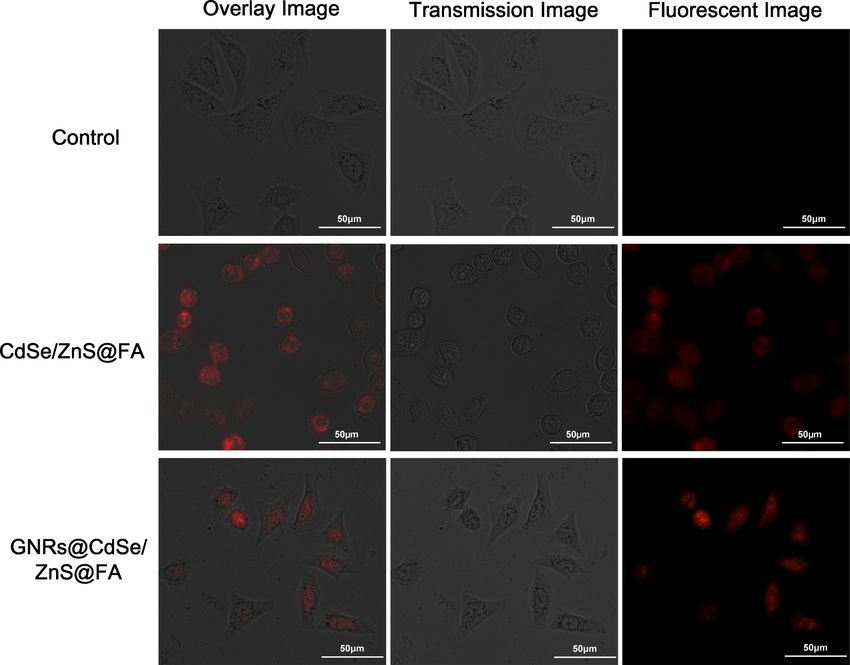
the QD emission is overlaid with the longer absorption peak of File 1, Figure S2. The aspect ratio (length/diameter) is approxi-
the GNRs, the PL enhancement will be maximized. 5 nm was mately 2.2, where the short and long axes length of the
found to be the optimal distance between GNRs and QDs. nanorods is around 17 nm and 38 nm, respectively, and the av-
erage distance between GNRs and QDs was around 5 nm, as
To more clearly determine that the dipole source is the actual shown in Figure 3b. The energy dispersive X-ray spectroscopy
source of the PL enhancement, we use light polarization (EDS) pattern of GNR@CdSe/ZnS is given in Figure 3c. The
directed along the long and short axes of the GNRs to stimulate result was consistent with the atomic ratio of the structure of
the longitudinal and transverse modes, respectively. As shown GNR@CdSe/ZnS. The presence of Cd, Au, Zn, and Se is clear,
in Figure 2b, which shows the FDTD simulation results, we can and in our work, CdCl2, Se powder, ZnCl2, and Na2S were used
see that the peak at 630 nm (corresponding to PL enhancement) as Cd, Se, Zn, and S sources, respectively. On the other hand,
comes from GNR longitudinal excitation. The peak at 526 nm the Au peak comes from the GNRs. The results agree well with
originates from the transverse mode GNR excitation. This en- the synthesis chemical ratio, as explained in the Experimental
hanced photoluminescence is due to the PL emission and LSPR section, suggesting that GNR@CdSe/ZnS nanoparticles were
of the QDs and as a far-field dipole. successfully synthesized by the described synthetic route.
The size and morphology of the GNRs and GNR@CdSe/ZnS The absorption and PL spectrum of CdSe/ZnS QDs and GNRs
was characterized using transmission electron microscopy and the PL spectra of CdSe/ZnS QDs and GNR@CdSe/ZnS
(TEM), and the results are shown in Figure 3a and 3b. The aver- were acquired at room temperature as they were prepared, and
age diameter of the CdSe/ZnS QDs is 8 ± 1 nm, where the cor- the spectrum of water was measured as a reference. Figure 4a
responding TEM image is shown in Supporting Information shows the absorption spectrum of CdSe/ZnS GNRs and
Figure 3: (a) TEM image of a GNR; (b) TEM image of GNR@CdSe/ZnS; (c) energy dispersive X-ray spectroscopy pattern of GNR@CdSe/ZnS.
25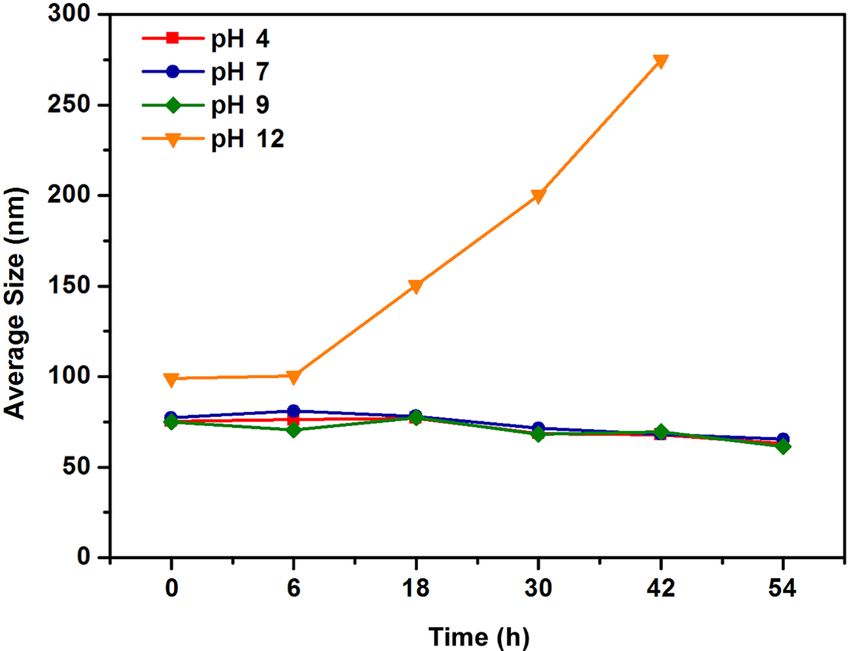
Beilstein J. Nanotechnol. 2019, 10, 22–31.

 Figure 4: (a) Absorption spectrum of CdSe/ZnS, GNRs, and GNR@CdSe/ZnS; (b) PL spectrum of CdSe/ZnS and GNR@CdSe/ZnS.

GNR@CdSe/ZnS, where it can be seen that there are two peaks             atomic force microscopy techniques. We measured the scat-
in the GNR absorption spectrum: the transverse surface                  tering and the PL emission signal from a single particle. The
plasmon resonance (TSPR) peak located at 510 nm and the                 measurements were taken under continuous wave laser excita-
LSPR peak located at 628 nm. Figure 4b shows the PL spec-               tion at a wavelength of 532 nm with a laser power of about
trum of CdSe/ZnS QDs where the peak emission is around                  100 μW. The confocal scanning PL image of GNR@CdSe/ZnS
630 nm and the GNR absorption overlaps with the emission of             is plotted in Figure 5, which was acquired from a sample region
the CdSe/ZnS QDs. The PL emission intensity of GNR@CdSe/                of 40 × 40 μm, where each dark spot corresponds to a single
ZnS was more than four times that of the CdSe/ZnS QDs, which            GNR@CdSe/ZnS nanoparticle.
implies that after binding with GNRs the PL intensity of CdSe/
ZnS QDs was enhanced.                                                   Figure 5a shows the experimental PL and scattering spectrum of
                                                                        single particles of CdSe/ZnS QDs and GNR@CdSe/ZnS.
We performed additional optical characterization of a single            Figure 5b shows optical confocal scanning images of
GNR@CdSe/ZnS nanoparticle at room temperature. We diluted               GNR@CdSe/ZnS. When the GNRs were added to the QD solu-
the GNR@CdSe/ZnS solution then placed it on glass to obtain a           tion, the PL emission intensity of GNR@CdSe/ZnS increased
single particle per 1 × 1 μm area. The experimental microspec-          two times as compared with CdSe/ZnS. Additionally, com-
troscopy equipment was used to collect the integrated, white            pared to the PL spectrum in Figure 4b, the PL enhancement of a
light, dark-field scattering, as well as the PL spectra and the         single particle is lower than that of the sample in the ensemble

 Figure 5: (a) PL and scattering spectrum from single CdSe/ZnS and GNR@CdSe/ZnS nanoparticles; (b) optical confocal scanning images of GNR@
 CdSe/ZnS.

                                                                                                                                            26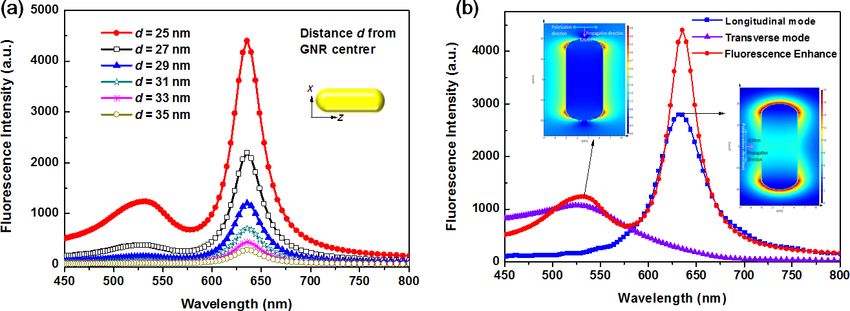
Beilstein J. Nanotechnol. 2019, 10, 22–31.

solution. Although still bright, this test also confirmed that a     To make this multifunctional nanomaterial more biocompatible
single GNR@CdSe/ZnS nanoparticle could serve as a single             and specific to the cancer cell, we conjugated the FA with
photon source.                                                       GNR@CdSe/ZnS nanoparticles. Firstly, we performed a
                                                                     colloidal stability study in which their hydrodynamic sizes were
PL lifetime is also an important parameter in studying the           monitored using the dynamic light scattering technique at room
photoelectric properties and surface chemistry of nanoparticles.     temperature. The results shown in Figure 7 indicated relatively
A multiexponential decay curve provides evidence of the pres-        stable conditions of GNR@CdSe/ZnS@FA formulations when
ence of nonradioactive or radiative recombination. The lifetime      the pH values were 4, 7, and 9, and that the samples were rela-
of GNR@CdSe/ZnS and CdSe/ZnS was obtained by using a                 tively stable in the alkaline environment. The size of
fluorescence lifetime spectrometer (FLS980) with a detection         GNR@CdSe/ZnS@FA did not show significant change during
wavelength range of 200 to 1700 nm and an excitation wave-           the measurement, but when the pH value changed to 12, the size
length of 450 nm. The spectra are shown in Figure 6.                 of GNR@CdSe/ZnS@FA increased. The size increase was
                                                                     caused by aggregation, which was due to the high pH solution
                                                                     being rich in hydroxide ions (OH − ), which facilitates the
                                                                     carboxyl groups of the surface of nanoparticles. However, still
                                                                     below 300 nm, this size is also suitable for bioimaging, and the
                                                                     results suggest that the GNR@CdSe/ZnS@FA sample could be
                                                                     applied in biological applications.

 Figure 6: Photoluminescence lifetime spectrum of CdSe/ZnS and
 GNR@CdSe/ZnS.

These lifetime measurements confirmed that the lifetime of
GNR@CdSe/ZnS was longer than that of CdSe/ZnS, as shown
by the data in Table 1. Here, B is a percentage of the lifetime
                                                                       Figure 7: The colloidal stability of GNR@CdSe/ZnS@FA.
and t is the lifetime. From Figure 4 we can see that the band
edge of the QDs is near 500 nm and the band edge of our CdSe/
ZnS sample is calculated to be about 2.48 eV, which is larger        Over the past few years, the synthesis of CdSe and CdSe/ZnS
than the value of 1.76 eV for CdSe, thus the PL of CdSe/ZnS is       QDs for in vitro imaging has received significant attention. To
surface defect emission. This greater lifetime resulted from the     confirm that GNR@CdSe/ZnS can be used in cell imaging
trapping states caused by surface defects located within the         studies, after conjugation with FA, we performed a MCF-7
bandgap, which led to a rise of nonradioactive recombination.        breast cancer cell targeting imaging study, and the results as
When the GNRs were doped with CdSe/ZnS QDs, more radia-              shown in Figure 8. Robust cellular uptake could be obtained
tive and nonradioactive processes occurred at the particle sur-      from the CdSe/ZnS@FA and GNR@CdSe/ZnS@FA treated
face, which contributed to an enhanced lifetime.                     samples. The obvious luminescence and staining appearing in

 Table 1: Lifetime data of the samples.

  Sample                    B1            t1 (ns)     B2         t2 (ns)      B3            t3 (ns)           Average lifetime (ns)

  CdSe/ZnS                  0.0702        1.1411      0.2403     14.885       0.6896        128.5203          92.2753
  GNR@CdSe/ZnS              0.0342        1.1047      0.1303     15.5347      0.8354        134.5797          114.5012

                                                                                                                                         27
Beilstein J. Nanotechnol. 2019, 10, 22–31.
Figure 8: Microscopy images of MCF-7 breast cancer cell labelled with CdSe/ZnS@FA and GNR@CdSe/ZnS@FA.
Figure 8 was due to the accumulation of functionalized nano- 3-mercaptopropionic acid (MPA, ≥99%), N-ethyl-N'-(3-
particles in the cells, and there was no sign of any damage to the dimethylaminopropyl)carbodiimide (EDC, 99%), and
cell, demonstrating passive uptake in MCF-7 breast cancer cells N-hydroxysuccinimide (NHs, 99%), cadmium chlorideanhy-
using CdSe/ZnS@FA and GNR@CdSe/ZnS@FA. However, drous (CdCl2, 99.999%), selenium powder (Se, 99.8%), sodi-
because the PL intensity and cell morphology of GNR@CdSe/ um borohydride (NaBH 4 , 99.99%), and zinc chloride an-
ZnS@FA is better than CdSe/ZnS@FA, the in vitro imaging hydrous were purchased from Sigma-Aldrich. Sodium sulphide
results confirm that these nanoparticles are suitable to be used (Na2S, 60–63%) was purchased from Acros Organics, and an-
for near-infrared imaging and cancer therapy. hydrous ethanol, sodium hydroxide (NaOH, AR) and hydro-
chloric acid (HCl, AR) were purchased from Sinopharm Chemi-
Conclusion cal Reagent Co., Ltd. All chemicals were used as received with-
We have developed a multifunctional nanomaterial out further purification. Deionized (DI) water used in all the
GNR@CdSe/ZnS and enhanced the PL intensity using the sur- studies was purified by a Milli-Q water purification system.
face plasmon resonance of GNRs. The experimental results
correlated well with the theoretical simulation. The results of Characterization
the biological detection study indicated that this nanomaterial is The PL emission spectrum of the QDs was measured with a
biocompatible and that there is significant PL signal for cell Cary Eclipse fluorescence spectrophotometer (Agilent, CA,
imaging. This research is promising for future nanophotonics USA) at an excitation wavelength of 430 nm. UV–visible
and biophotonics applications. absorption spectra were collected using a Cary 5000 spec-
trophotometer (Agilent, CA, USA). The lifetime of the nanopar-
Experimental ticles was measured with an FLS980 spectrometer (Edinburgh
Materials and instrumentation instruments, UK). The morphology and size of the GNRs and
Hexadecyltrimethylammonium bromide (CTAB, >98.0%), QDs were obtained with an FEI Tecnai G2 F20 S-TWIN TEM
L-ascorbic acid (BioUltra, ≥99.5%), silver nitrate (AgNO 3 , operating at an accelerating voltage of 200 kV, and the samples
>99%), gold(III) chloride trihydrate (HAuCl 4 ·3H 2 O, 99%), were loaded into a quartz cell for the measurements. The TEM
28Beilstein J. Nanotechnol. 2019, 10, 22–31.
specimens were prepared by drop casting the sample dispersion ring. The pH was adjusted to 10 by adding 1 M of sodium
onto an amorphous carbon-coated 300 mesh copper grid. hydroxide solution. The ZnCl2 solution was then added to the
CdSe solution at 60 °C, and after the mixture was heated to
Synthesis of GNRs 90 °C, 60 mg (2 mL) of Na2S was added to the ZnCl2-CdSe
To synthesize the GNRs, the seed-mediated growth method in solution and maintained at 98 °C for 1 h. Finally, the solution
CTAB solution was applied, as previously discussed [30,31]. was cooled to room temperature and separated by the addition
The seed solution was prepared using 5 mL of a 0.2 M CTAB of ethanol and two cycles of centrifugation.
solution and 5 mL of 0.1 mM HAuCl4. Following this, 0.6 mL
of ice-cold 0.01 M NaBH4 solution was quickly added to the Synthesis of GNR@CdSe/ZnS nanoparticles
HAuCl4− CTAB solution and vigorously stirred for 3–5 min. The GNR solution (5 mL, 5 OD/mL) was centrifuged at
This caused the solution color to change from yellow to light 8000 rpm for 10 min and the supernatant was discarded. The
brown. The solution was stored at 37 °C for 30 min before use. GNR precipitate was redispersed in HPLC water to obtain
The growth solution was prepared by mixing 800 μL of 25 mM 0.1 OD/mL. Subsequently, 1 mL of the CdSe/ZnS (1 OD/mL)
HAuCl4 and 20 mL of HPLC water. Following this, 400 μL of mixture was added to 10 mL of the GNR solution, and the mix-
4.0 mM AgNO3 solution was added to the HAuCl4 solution, ture was left under stirring overnight to obtain the GNR@CdSe/
and then 20 mL of 0.2 M CTAB and 800 μL of 0.08 M ascorbic ZnS composite nanoparticles.
acid were added. This solution was kept in a water bath at
37 °C, and the solution became clear and colorless after gentle Synthesis of GNR@CdSe/ZnS@FA
stirring. 96 μL of the seed solution was added to the growth nanoparticles
solution, and it was then left undisturbed at 37 °C for 24 h. The From the stock solution, 2 mL of 4 mg/mL aqueous
final solution was centrifuged at 8000 rpm for 10 min twice GNR@CdSe/ZnS dispersion was mixed with 400 µL of 10 mM
then redispersed in 0.02 M CTAB solution for later use. EDC solution and incubated for 2 min. 400 µL of 10 mM NHs
was then added to the mixture and stirred for 10 min. Next,
Synthesis of CdSe/ZnS QDs 1.2 mL of folic acid in DMSO solution (2 mg/mL) was added to
A selenium precursor was prepared by reducing 19.4 mg of this mixture and stirred at room temperature for 2 h to allow the
selenium powder with 40 mg of sodium borohydride (NaBH4) folic acid to covalently couple with the nanoparticles. After two
in 1 mL of nitrogen-saturated DI water at room temperature. hours of stirring, the bioconjugated nanoparticles were purified
The mixture was stirred for 1–2 h until it became colorless. (removing excess by-products) via centrifugation. The QD pre-
cipitate was redispersed in HPLC water for the bioimaging
MPA-CdSe QDs were synthesized by the previously reported studies.
method. Briefly, 366 mg of CdCl2, 440 μL of MPA, and 50 mL
of nitrogen-saturated water were loaded into a three-necked Simulation study of photoluminescence
flask under stirring. The pH was adjusted to 10 by dropwise ad- enhancement
dition of sodium hydroxide solution. The Se precursor was then The simulation study was based on Parseval’s equation, where
injected into the mixture under nitrogen atmosphere, and the the electromagnetic fields can be expressed as described in
reaction mixture was slowly heated under nitrogen atmosphere Equation 1 and Equation 2, and the dipole integral is according
to 98 °C. After 2 h, the mixture solution was collected as MPA- to the perpendicular [26].
CdSe QDs for ZnS shell-coating synthesis. The ZnCl2 was pre-
pared by loading 68 mg of ZnCl2, 100 μL of MPA, and 30 mL The normalized total output power of photoluminescence of can
of nitrogen-saturated water into a three-necked flask under stir- be expressed as [26]
(1)
(2)
29Beilstein J. Nanotechnol. 2019, 10, 22–31.
where p is the transition electric dipole moment. From the
(3) above equations, we can see the PL enhancement effected by
the F(ω) and ηa(ω). Here η0(ω) is the quantum efficiency related
to the enhancement as a reference [22,23].
For FDTD simulations we use a dipole source to simulate the
(4) QDs, which emit in the wavelength range from 450 nm to
800 nm with polarization along the long axis direction z. d is the
distance between the dipole source center and the GNR center,
and the length of the GNRs was fixed at 40 nm.
(5) In vitro cell imaging study
MCF-7 breast cancer cells (American Type Culture Collection)
were cultured with Dulbecco’s Modified Eagle’s Medium
We also simulated the PL enhancement of GNR@CdSe/ZnS (DMEM, Hyclone), supplemented with 10% fetal bovine serum
using FDTD software, and we used these simulation results to (FBS, Hyclone), penicillin (100 µg mL−1, Gibco), and strepto-
further study the PL enhancement caused by LSPR coupling mycin (100 µg mL −1 , Gibco) in a humidified environment
effect. The FDTD simulation results show that the quantum me- (37 °C, 5% CO2). Before treating with nanoparticles, the cells
chanical decay rate of the inhomogeneous environment is were seeded onto cover glass in a six-well plate with DMEM.
related to the classical power radiated by the dipole in the same The prepared CdSe/ZnS@FA QDs and GNR@CdSe/ZnS@FA
environment, which only occurs in the radiation of an atomic nanoparticles were then diluted with PBS buffer (pH 7.2) solu-
dipole transition. Specifically, we have the following relation- tion to a concentration of 500 μg/mL. Next, the cells were
ship: treated with the CdSe/ZnS@FA QDs and GNR@CdSe/
ZnS@FA nanoparticles for 4 h. After 4 h of incubation, the
treated cells were washed with PBS buffer three times. A Leica
(6) DMI 3000 inverted microscope with a 10× lens was used for the
cell imaging study, and the excitation and emission wave-
lengths were 532 nm and 630 nm, respectively.
where Γrad is the decay rate, P is the radiated power in an inho-
mogeneous environment (with the nanoparticle near the dipole
Supporting Information
source), is the decay rate, and P0 is the power radiated in a
homogeneous environment (only the dipole source). When the Supporting Information File 1
isolated emitter is coupled to the nanoantenna, its quantum effi- Relative cell viability of MCF-7 breast cancer cells treated
ciency is modified as, with different concentrations (6.25–100 μg/mL) of
GNR@CdSe/ZnS for 24 h. TEM image of CdSe/ZnS QDs.
[https://www.beilstein-journals.org/bjnano/content/
(7)
supplementary/2190-4286-10-3-S1.pdf]
In this relation, Acknowledgements
This work was supported by the National Natural Science Foun-
dation of China (Grant No. 61701493, 61722508, 61525503,
61378091, 81727804), the Postdoctoral Research Funding
Program of Jiangsu Province (2018K004B), the Advance
Research Project of Weapon and Equipment (6140414020102),
the Developing Project of Science and Technology of Jilin
The PL enhancement, S/S0, is then Province (20180519017JH). Science Foundation for Young
Scientists of Changchun University of Science and Technology
(XQNJJ-2016-10). Parts of this work were supported by the
(8) International Joint Research Center for Nanophotonics and
Biophotonics, School of Science, Changchun University of
30Beilstein J. Nanotechnol. 2019, 10, 22–31.
Science and Technology, and Nanophotonics and Biophotonics 22. Lu, G.; Zhang, T.; Li, W.; Hou, L.; Liu, J.; Gong, Q. J. Phys. Chem. C
2011, 115, 15822–15828. doi:10.1021/jp203317d
Key Laboratory of Jilin Province, P.R. China (20140622009J).
23. Zhang, T.; Lu, G.; Li, W.; Liu, J.; Hou, L.; Perriat, P.; Martini, M.;
Tillement, O.; Gong, Q. J. Phys. Chem. C 2012, 116, 8804–8812.
ORCID® iDs doi:10.1021/jp2125944
Siyi Hu - https://orcid.org/0000-0002-0686-5182 24. Nepal, D.; Drummy, L. F.; Biswas, S.; Park, K.; Vaia, R. A. ACS Nano
Junle Qu - https://orcid.org/0000-0001-7833-4711 2013, 7, 9064–9074. doi:10.1021/nn403671q
25. Saraf, D.; Kshirsagar, A. Phys. Chem. Chem. Phys. 2014, 16,
10823–10829. doi:10.1039/c4cp00069b
References
26. Chen, D.; Zhao, C.; Ye, J.; Li, Q.; Liu, X.; Su, M.; Jiang, H.;
1. Razgoniaeva, N.; Lambright, S.; Sharma, N.; Acharya, A.; Khon, E.;
Amatore, C.; Selke, M.; Wang, X. ACS Appl. Mater. Interfaces 2015, 7,
Moroz, P.; Razgoniaev, A.; Ostrowski, A.; Zamkov, M.
18163–18169. doi:10.1021/acsami.5b05805
J. Phys. Chem. C 2015, 119, 15562–15571.
27. Dai, L.; Zhang, Q.; Li, J.; Shen, X.; Mu, C.; Cai, K.
doi:10.1021/acs.jpcc.5b04608
ACS Appl. Mater. Interfaces 2015, 7, 7357–7372.
2. Prasad, P. Nanophotonics; John Wiley & Sons, Inc.: New York, NY,
doi:10.1021/acsami.5b00746
U.S.A., 2004; p 208. doi:10.1002/0471670251
28. Zhang, R.-Y.; Wang, Z.-Y.; Yang, X.-Q.; Xuan, Y.; Cheng, K.; Li, C.;
3. Hu, S.; Zeng, S.; Zhang, B.; Yang, C.; Song, P.; Hang Danny, T. J.;
Song, X.-L.; An, J.; Hou, X.-L.; Zhao, Y.-D. Nanotechnology 2018, 29,
Lin, G.; Wang, Y.; Anderson, T.; Coquet, P.; Liu, L.; Zhang, X.;
055101. doi:10.1088/1361-6528/aa9acc
Yong, K.-T. Analyst 2014, 139, 4681–4690. doi:10.1039/c4an00773e
29. Geszke, M.; Murias, M.; Balan, L.; Medjahdi, G.; Korczynski, J.;
4. Liu, L.-w.; Hu, S.-y.; Pan, Y.; Zhang, J.-q.; Feng, Y.-s.; Zhang, X.-h.
Moritz, M.; Lulek, J.; Schneider, R. Acta Biomater. 2011, 7, 1327–1338.
Beilstein J. Nanotechnol. 2014, 5, 919–926. doi:10.3762/bjnano.5.105
doi:10.1016/j.actbio.2010.10.012
5. Kim, K. S.; Hur, W.; Park, S.-J.; Hong, S. W.; Choi, J. E.; Goh, E. J.;
30. Law, W.-C.; Yong, K.-T.; Baev, A.; Prasad, P. N. ACS Nano 2011, 5,
Yoon, S. K.; Hahn, S. K. ACS Nano 2010, 4, 3005–3014.
4858–4864. doi:10.1021/nn2009485
doi:10.1021/nn100589y
31. Nikoobakht, B.; El-Sayed, M. A. Chem. Mater. 2003, 15, 1957–1962.
6. Pons, T.; Medintz, I. L.; Sapsford, K. E.; Higashiya, S.; Grimes, A. F.;
doi:10.1021/cm020732l
English, D. S.; Mattoussi, H. Nano Lett. 2007, 7, 3157–3164.
doi:10.1021/nl071729
7. Shevchenko, E. V.; Ringler, M.; Schwemer, A.; Talapin, D. V.;
Klar, T. A.; Rogach, A. L.; Feldmann, J.; Alivisatos, A. P.
J. Am. Chem. Soc. 2008, 130, 3274–3275. doi:10.1021/ja710619s License and Terms
8. Mohammadi, A.; Kaminski, F.; Sandoghdar, V.; Agio, M.
This is an Open Access article under the terms of the
J. Phys. Chem. C 2010, 114, 7372–7377. doi:10.1021/jp9094084
9. Mohammadi, A.; Sandoghdar, V.; Agio, M. New J. Phys. 2008, 10, Creative Commons Attribution License
105015. doi:10.1088/1367-2630/10/10/105015 (http://creativecommons.org/licenses/by/4.0). Please note
10. Rogobete, L.; Kaminski, F.; Agio, M.; Sandoghdar, V. Opt. Lett. 2007, that the reuse, redistribution and reproduction in particular
32, 1623–1625. doi:10.1364/ol.32.001623 requires that the authors and source are credited.
11. Vivas, M. G.; Cury, J. F.; Schiavon, M. A.; Mendonca, C. R.
J. Phys. Chem. C 2013, 117, 8530–8535. doi:10.1021/jp400956k
12. Mokari, T.; Rothenberg, E.; Popov, I.; Costi, R.; Banin, U. Science
The license is subject to the Beilstein Journal of
2004, 304, 1787–1790. doi:10.1126/science.1097830 Nanotechnology terms and conditions:
13. Menagen, G.; Macdonald, J. E.; Shemesh, Y.; Popov, I.; Banin, U. (https://www.beilstein-journals.org/bjnano)
J. Am. Chem. Soc. 2009, 131, 17406–17411. doi:10.1021/ja9077733
14. AbouZeid, K. M.; Mohamed, M. B.; El-Shall, M. S. Small 2011, 7,
The definitive version of this article is the electronic one
3299–3307. doi:10.1002/smll.201100688
which can be found at:
15. Rosen, S.; Schwartz, O.; Oron, D. Phys. Rev. Lett. 2010, 104, 157404.
doi:10.1103/physrevlett.104.157404 doi:10.3762/bjnano.10.3
16. Bothun, G. D.; Rabideau, A. E.; Stoner, M. A. J. Phys. Chem. B 2009,
113, 7725–7728. doi:10.1021/jp9017458
17. Gil, P. R.; Parak, W. J. ACS Nano 2008, 2, 2200–2205.
doi:10.1021/nn800716j
18. Ehamparam, R.; Pavlopoulos, N. G.; Liao, M. W.; Hill, L. J.;
Armstrong, N. R.; Pyun, J.; Saavedra, S. S. ACS Nano 2015, 9,
8786–8800. doi:10.1021/acsnano.5b01720
19. Ji, W.; Jing, P.; Zhao, J.; Liu, X.; Wang, A.; Li, H. Nanoscale 2013, 5,
3474–3480. doi:10.1039/c3nr34168b
20. Araci, Z. O.; Shallcross, C. R.; Armstrong, N. R.; Saavedra, S. S.
J. Phys. Chem. Lett. 2010, 1, 1900–1905. doi:10.1021/jz100475j
21. Fang, Y.; Chang, W.-S.; Willingham, B.; Swanglap, P.;
Dominguez-Medina, S.; Link, S. ACS Nano 2012, 6, 7177–7184.
doi:10.1021/nn3022469
31You can also read