Preliminary genetic documentation of snake species through shed skin from Uttarakhand, India: A non-invasive genetic sampling approach
←
→
Page content transcription
If your browser does not render page correctly, please read the page content below
Volume 5 (1): 81-91 (2021)(http://www.wildlife-biodiversity.com/)
                                                                                                                   Research Article

Preliminary genetic documentation of snake species through
shed skin from Uttarakhand, India: A non-invasive genetic
sampling approach

Ankita Rajpoot1, Ved Prakash Kumar1*, Archana Bahuguna2, Sargam Singh Rasaily3
1
 Maaty Biodiversity Conservation & Societal Research Organization, Kaulagarh, Dehradun-
248003 Uttarakhand, India
2
Molecular Systematic laboratory, Zoological Survey of India, NRC, 218, Kaulagarh Road,
Dehradun-248195, Uttarakhand, India
3
    Uttarakhand Biodiversity Board, 423, Indira Nagar Colony, Dehradun-248006 Uttarakhand, India
*Email:tiwaryved@gmail.com
Received: 6 May 2020 / Revised: 24 June 2020 / Accepted: 5 August 2020 / Published online: 5 August 2020. Ministry of Sciences, Research
and Technology, Arak University, Iran.
How to cite: Rajpoot A., Kumar V.P., Bahuguna A., Rasaily S.S. (2021).Preliminary genetic documentation of snake species through shed skin from
Uttarakhand, India: A non-invasive genetic sampling approach, 5(1), 81-91. https://doi.org/10.22120/jwb.2020.127147.1138

Abstract
Non-invasive sampling is one of the most authentic techniques for the genetic study of endangered
and rare animal species. In the present study based on non-invasive samples, we give the preliminary
genetic documentation of snake species by using cytochrome b (Cyt b) and cytochrome c oxidase
subunit I (COI) universal mitochondrial primers from Uttarakhand (UK), India. We sampled n=11
shed skin of unknown snake species from four different locations in Uttarakhand, India. The success
rate of genomic DNA isolation, PCR amplification, and sequencing from collected samples was
100%. Afterward, in the genetics analysis, 8 out of 11 samples matched with Least Concern ver3.1
Rat snake species, two samples paired with Checkered keelback snake, and one sample matched
with Indian cobra. Subsequently, 149 (Cyt b) and 207 (COI) species-specific fixed SNPs were
observed. The obtained interspecific sequences divergences based on two mitochondrial loci among
three snake species also show the high variability in the Uttarakhand snake population. The current
study based on the non-invasive genetic sampling approach showed its importance in biodiversity
conservation, especially those species which are under the endangered and critically endangered
category. The genetic reference database of snake species helpful in species management,
population, evolutionary-based study, and wildlife forensic in the future.

Keywords: Mitochondrial DNA and conservation, non-invasive genetic sampling, snakes, shed
skin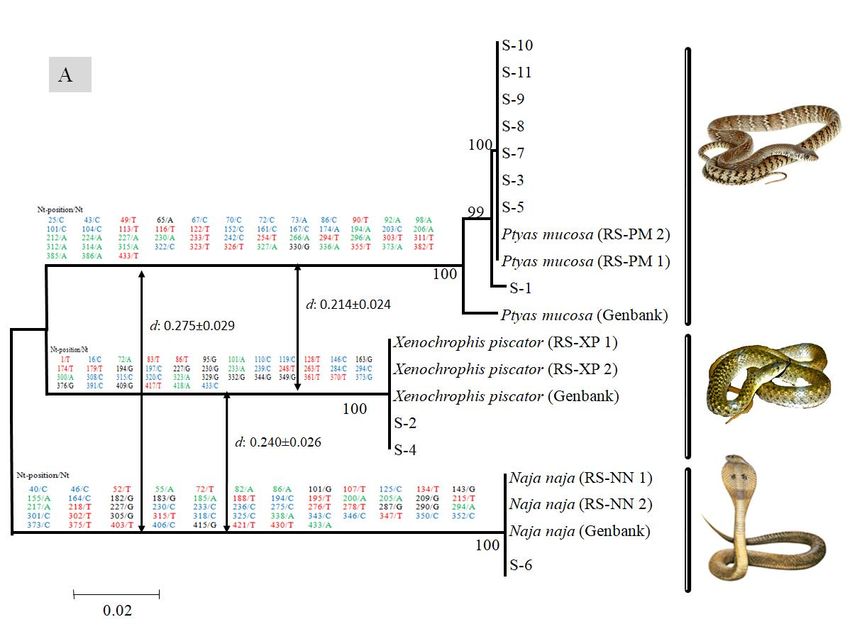
82| Journal of Wildlife and Biodiversity 5 (1): 81-91 (2021)

Introduction
Non-invasive genetic sampling is a proportionately new approach for data-collection, has a great
opportunity to explore the fauna in the wild. Through this approach, biologists can collect critical
data of different wildlife animals without handling, capturing, or even observing individual animals
(Mills et al., 2000; Carroll et al., 2018). Molecular techniques have proven to be crucial for
identifying morphologically conservative species by extracting genetic material from hair, shed
skin, feces, or other DNA source from non-invasive samples. The first time non-invasive genetic
sampling was introduced as a method to obtain genetic samples from rare and elusive brown bears
(Ursus arctos) in Europe in 1992 (Hoss et al., 1992; Taberlet & Bouvet, 1992) to study social
structure in chimpanzees (Pan troglodytes) (Morin & Woodruff, 1992). According to a previous
study, non-invasive samples do not require capture and handling of animals (Taberlet et al., 1999).
This sampling has even greater value when the threatened and rare species are the objects of study.
Today DNA can be successfully recovered from diverse animal sources such as hair, feathers, shed
skins, etc. Non-invasive genetic sampling is used as an essential tool in the study of large carnivore
species and reptiles species such as snakes because it is difficult to handle for sample collection. It
used in the detection of rare species to forensic applications (Waits, 2004); conservation
management of rare or cryptic species (Piggott & Taylor, 2003), population estimation (Boulanger
et al., 2004; McKelvey & Schwartz 2010; Caroline et al., 2019), accurate data collection (Paetkau,
2003) and addressing genotyping errors (Bonin et al., 2004).
Nonetheless, snakes are a group of reptiles with many derived morphological characters related to
their peculiar behavior and lifestyle. Snakes belong to the squamate reptiles, characterized by the
regular shedding of the epidermis' outer layers, also known as ecdysis (Landmann, 1986; Maderson
et al., 1998). In snakes, the epidermis' superficial layers are detached as a single, coherent sheet,
whereas other Squamates (lizards and geckos) shed multiple smaller flakes. Most living reptiles are
covered by scales of different sizes, thickness, variety, and color, and these characterize other
species (Maderson, 1985a & b; Landmann, 1986; Alibardi, 2003 & 2006). Nowadays, mostly
genetic studies based on high template DNA extracted from blood, liver, or other tissues.
Unfortunately, it is challenging to draw blood from the veins of reptiles or birds, and its collection
is hindered by the small body size of these species. As a result, reptiles often have to be killed for
the acquisition of samples. Therefore, few molecular studies have been done on snakes' phylogeny,
although non-invasive genetic sampling is an applicable method for such types of animals (Heise
et al., 1995; Wong et al., 2004). Accordingly, we have standardized an efficient process for
obtaining DNA from the cast-off skin of snakes instead of blood and amplify partial fragments of
two mitochondrial genes, i.e., Cytochrome b (Cyt b) and Cytochrome c oxidase subunit I (COI).
Through this method, we have obtained DNA for further genetic studies without killing the reptile.
DNA-based techniques for species identification have recently started to be applied towards a wide
variety of animals (Hryncewicz-Gwozdz et al., 2011; Kent et al., 2010) and proved an effective
tool for reliable species identification phylogenetics and biodiversity analysis. They may be the key
to successful work in law enforcement and conservation of wildlife (Dubey et al., 2011; Kumar et
al., 2014; Rajpoot et al., 2017). DNA barcoding is a taxonomic method that uses a short genetic
marker in an organism's DNA to identify species (Hebert et al., 2003; Kress et al., 2005) and used
to identify unknown species (Koch, 2010).
Uttarakhand is one of India's wealthiest hotspots, where a variety of floral, faunal, and
microorganisms are present, including endangered, critically endeared, and rare animals and plant
83| Journal of Wildlife and Biodiversity 5 (1): 81-91 (2021)
species (Sundriyal & Sharma, 2016). However, several taxonomic and genetic study has been
conducted on different reptiles; unfortunately, no single genetic research has been reported on snake
species (Bahuguna, 2010; Rajpoot et al., 2016 & 2017). Therefore, the present study is the
preliminary genetic documentation of snake species from Uttarakhand. Here, we apply the non-
invasive approach and standardize a method to extracting DNA in high yield from snake cast-off
skin; amplify a partial fragment of two mitochondrial genes i.e., 410bp Cytochrome b (Cyt b) and
658bp Cytochrome c oxidase subunit I; identify the species; provide authentic reference barcode
database of snake species from Uttarakhand.
Material and methods
Sample Collection and Preparation for DNA Extraction from shed skin
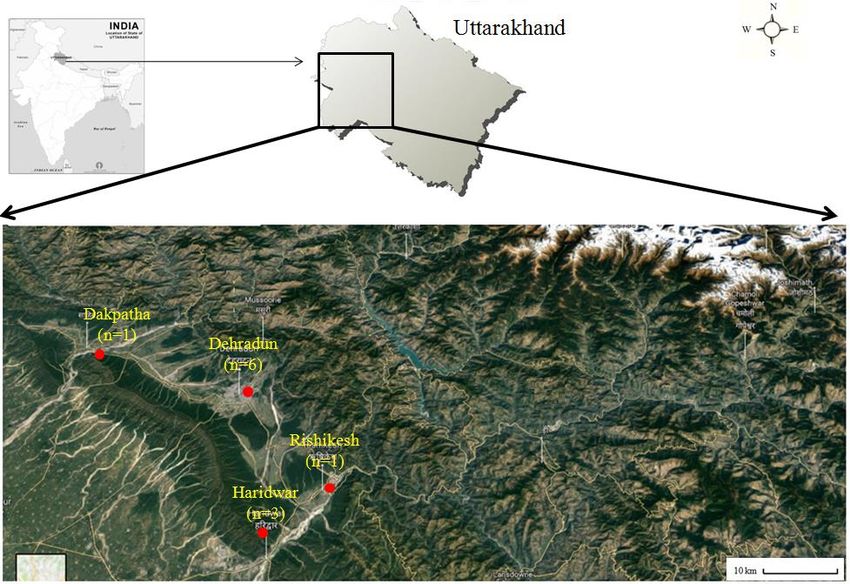
Eleven shed skins of snakes were collected from four different districts (Dehradun, Haridwar,
Rishikesh, and Dakpathhar) in Uttarakhand during the field Surveys conducted in 2017-2018 (Fig.
1 and Table 1). The shed skin exuviates for the entire snake were collected and washed with 70%
Ethanol dried thoroughly and frozen until the extraction of DNA. Genomic DNA was extracted
following the protocol of Fetzner (1999) with few modifications.
Figure 1. Map showing the location and number of collected shed Snake skins from four different places in
Uttarakhand84| Journal of Wildlife and Biodiversity 5 (1): 81-91 (2021)
Table 1. Details of used snake species from the present study and other sequences retrieved from Genbank.
N indicates for number of samples used in present study; S: Sample; RS: Reference samples
The approximately one-inch square piece was cut individually, chopped into small pieces with a
surgical blade, and transferred to a sterile 2 ml Eppendorf tube from collected shed snake skins.
After that, washed away with 10X phosphate-buffered saline (PBS) two times (kept for at least 20
min. on a shaking platform during each wash) and washed with nuclease-free water.
Shed skin (cut up) was placed into 300 µl of cell lysis buffer (10 mM Tris-base, 100 mM EDTA,
and 2% sodium dodecyl sulfate (SDS, pH 8.0) along with 20 µl of Proteinase K (20 mg/ml). The
samples were vortex thoroughly and then placed in a heat block or water bath at 56°C overnight.
The samples are then removed from the heat block and cooled to room temperature (Note: the skin
does not dissolve after Proteinase K digestion, but the DNA is released into the solution). The
supernatant was transferred into a 1.5 ml Eppendorf tube and centrifuged at 8000 rpm for 3 min to
pellet the remaining particles. The resultant supernatant was transferred to new tubes containing
600 μl 100% isopropanol, then mixed gently by inverting tubes, and then placed in a freezer –20°C
for 12 hr. Extracts were then centrifuged at 16000 rpm for 20 min to pellet DNA, after which the
isopropanol was poured off. Wash the pellet two times with 600 μl 70% EtOH (16 000 rpm for 1
min), after which the EtOH was poured off after each wash. Pelleted DNA was air-dried and then
resuspended in 20μl TE (10 mM Tris, pH 8.0 + 1 M EDTA, pH 8.0). All centrifugation steps were
performed in a cold centrifuge (4°C). The DNA concentration was quantified by absorbance
measurement at 260nm. Absorbance measurements at 260nm were done using Cubimeter (Thermo
Fisher Scientific Inc., Waltham, MA) with 4 µl of samples.
PCR Amplification and Data Analysis
Partial fragments of the Cyt b: 410bp (Verma et al., 2003) and COI: 658bp (Folmer et al., 1994)
mitochondrial loci were successfully amplified. All PCR reactions were carried out on Eppendorf
Master cycler (Orlando, USA) with a reaction set up of 10µl master mix volume, containing 4µl of
2X PCR master mix (Thermo Fisher Scientific), 0.5µl (0.025 mmol/L) each primer and
approximately 1.5 to 2µl (45-50 ng) of genomic DNA and 3µl of ultrapure PCR grade water.
Optimized PCR conditions of both mitochondrial loci as described in Rajpoot et al., (2016).85| Journal of Wildlife and Biodiversity 5 (1): 81-91 (2021)
Thereafter, 3.5-4µl of PCR products were subjected to electrophoresis on 2% agarose (w/v) and
visualized over the transilluminator to detect the amplification. Cautious positive and negative
controls were incorporated throughout all DNA extraction and PCR amplification. Sanger
sequencing is performed by a commercial using the same primers. All sequences obtained well for
both the reverse and forward primers.
Qualities of sequences were determined using Sequence Analysis v5.2 software (Applied
Biosystems, Foster City, CA). The Clustal W algorithm implemented in BioEdit version 7.0.5.3
(Hall, 1999) was used in the multiple sequence alignments (MSA). The sequences obtained from
the three different species were compared with NCBI courses through a BLAST search
(http://blast.ncbi.nlm.nih.gov/) and our reference data (Table 1). For the species diagnosis, we
considered the percentage similarity between query and reference sequence. To confirm MSA
results of both mitochondrial genes, compared with Neighbor-Joining (NJ) (Saitou & Nei, 1987)
analysis conducted using MEGA version 7.0 (Kumar et al., 2016). Estimates of interspecific
evolutionary divergence (d) over sequence pairs between groups determined by using the Kimura
2-parameter distance (Kimura, 1980) as implemented in MEGA version 7.0 (Kumar et al., 2016).
Results
The obtained genomic DNA concentration in all samples was good and ranged from 20.90 to 50.84
ng/µL. Interestingly, all shed skins, which are comparatively fresh or recently collected, yield
slightly more quantity of DNA in comparison to old samples or earlier collected shed skins. In PCR
amplification, Cyt b and COI mitochondrial loci were successfully amplified in all samples obtained
readable sequences 410bp and 510bp, respectively. The obtained sequences of these two
mitochondrial loci (Cyt b and COI) consisted of variables sites (128 and 185), Parsimony
informative sites (126 and 179), and Singleton sites (2 and 6). Afterwards, the overall nucleotide
compositions of the sequenced region of Cyt b was as follow: T=28.1%, C=28.9%, A=33.4% and
G=9.6 %, while COI was as follow T=28.8%, C=27.0%, A=27.9% and G=16.3 %. Subsequently,
in two mtDNA loci (Cyt b and COI) total of 149 and 207 fixed species-specific Single Nucleotide
Polymorphic sites (SNPs) were observed among three snake species. The species wise details of
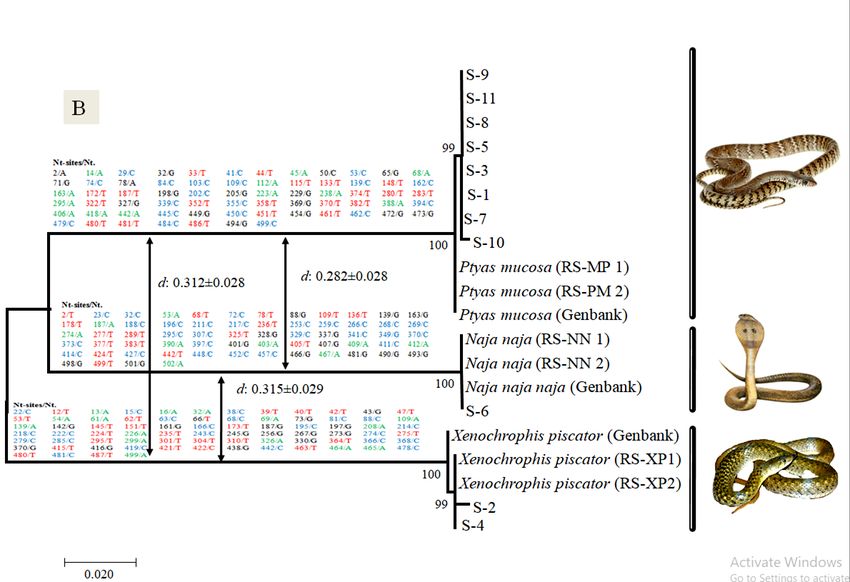
nucleotide compositions and SNPs are given in Table 2 and Fig. 2.
Table 2. Nucleotide composition and species-specific fixed Single Nucleotide Polymorphic sites (SNPs)
within two mitochondrial loci
To validate our obtained query sample sequences of Cyt b and CO1 mitochondrial loci, they were
compared with available Genbank sequences with the NCBI Basic Local Alignment Search Tool
(BLAST) (https://www.ncbi.nlm.nih.gov/BLAST). BLAST analysis of both mtDNA loci (Cyt b and86| Journal of Wildlife and Biodiversity 5 (1): 81-91 (2021) CO1) indicated that out of n=11, 8 samples (the S-1,S-3, S-5, S-7, S-8, S-9, S-10 and S-11) were highly matched (99%-100%) with the Indian rat snake (Ptyas mucosa), while two another samples (S-2 and S-4) were matched (99% and 100%) with Checkered keelback snake (Xenophoris piscator) and one sample S-6 was matched (100%) with Indian cobra (Naja naja) (Table 3). Figure 2. Cyt b (A) and COI (B) sequences based Neighbor-Joining (NJ) tree analysis to see the closet taxon with selected shed skin samples and references sequences of Snake. Above branch of both tree (A & B), the sequences and number represent the Cyt b and COI sequences based observed species-specific SNPs among three Snake species. After that, the arrow in both trees represents the Cyt b and COI sequences based on observed Interspecific sequence divergence (d) between three Snake species
87| Journal of Wildlife and Biodiversity 5 (1): 81-91 (2021)

To reconfirm our BLAST result, we matched obtained sequences of both mitochondrial loci with
our reference sequences through MSA and all samples 100% matched with respective species
correspondingly.

   Table 3. Species identification result from the amplification genes and top similarity match (BLAST-
                                     reference sample) of used samples

Thereafter, the NJ tree topology with download sequences from NCBI and our reference database
also showed similar to BLAST result, where the unknown snake shed skins were clustered with to
three species of snakes i.e., Indian rat snake (S-1, S-3, S-5, S-7, S-8, S-9, S-10, and S-11), Checkered
keelback snake (S-2 and S-4) and Indian cobra (S-6) with a strong bootstrap value of 99%-100%
(Fig. 2). Although the species tree topology of two mtDNA loci (Cyt b and COI) showed two
different topologies, since in Cyt b the Checkered keelback snake present as a sister clade with Rat
snake, while in COI, the Indian cobra present as a sister clade with Rat snake. Moreover, the
obtained Cyt b and COI interspecific sequence divergence (d) between three snake species also
support tree topology, wherein Cyt b the observed low interspecific divergence (d: 0.214±0.024)
was from Rat snake to Checkered keelback snake and was high interspecific divergence (d:
0.275±0.029) from Rat snake to Indian cobra. Although, in COI sequence-based observed low
interspecific divergence (d: 0.228±0.028) was from Rat snake to Indian cobra, while observed high
interspecific divergence (d: 0.315±0.029) from Indian cobra to Checkered keelback snake (Fig.2).

Discussion
Out of eleven samples of shed skin, eight samples were found to be Rat snakes. It indicates a healthy
population of Rat snakes in Uttarakhand. These cast-off skin samples were collected during our
different field surveys, maximum skins were found near the agricultural area; it also indicates the
increasing number of rat populations may increase the Rat snake population due to their feeding
behavior. After observing the result, we will plan to conduct the population study of Rat snakes and
determine the population demography of this snake species.
We advocate that shed skin is a precious object to study the evolutionary and population studies of
snakes. Numerous scientific publications have documented the advances that non-invasive sampling
has allowed in the field of molecular ecology over the past decades (Piggott & Taylor, 2003; Eggert
et al., 2003). While some research also enlightens the flaws of non-invasive genetic sampling i.e.,
low success rate, a small quantity of DNA, etc. (Lobo et al., 2015).
However, in tree topology based on two mtDNA loci (Cyt b and COI), we observed the taxonomic
relationship among the three species were different as the COI gene appears to possess a greater
88| Journal of Wildlife and Biodiversity 5 (1): 81-91 (2021)
range of phylogenetic signal than any other mtDNA regions (Hebert et al., 2003). Although most of
the studies also showed the importance of Cyt b mtDNA loci in species separation in a short
fragment of loci. In COI, the number of species fixed SNPs was more than of Cyt b, and it showed
more variability within three snakes.
Conclusion
The present study unequivocally demonstrates the applicability of the non-invasive genetic
sampling approach using Cyt b and COI mtDNA loci as a potential tool for the identification of
snake species in India. Non-invasively collected samples reliably yielded sufficient DNA quality
and quantity for genetic study; in fact, the current study is a conservative estimate of the value of
shed snake skin for genetic studies as we intentionally targeted up to 500bp DNA fragments (658bp
COI gene and 410bp Cyt b gene). A shed snake skin found in the field provides useful information
regarding the population genetics and evolutionary studies. Further, a cast-off skin may heighten
the monitoring programs' results by providing proof of a species presence, may also serve as voucher
material without sacrificing an actual snake and without putting oneself in danger. More regular
use of non-invasive genetic sampling would help advance the knowledge of species behavior,
ecology, genetic, and evolutionary aspects of the snake and other species.
Acknowledgment
The authors are grateful to the Director, Zoological Survey of India, Kolkata, to support and
facilitate this work. The authors acknowledge the support provided by the President and all the
researchers and staff of the Maaty Organization for conducting this study.
References
Alibardi, L. (2003). Adaptation to the land: The skin of reptiles in comparison to that of amphibians
and endotherm amniotes. Journal of Experimental Zoology Part B Molecular and
Developmental Evolution, 298 (1), 12–41. https://doi.org/10.1002/jez.b.24
Alibardi, L. (2006). Structural and immunocytochemical characterization of keratinization in the
vertebrate epidermis and epidermal derivatives. International Review of Cytology, 253,
177–259. https://doi.org/10.1016/S0074-7696(06)53005-0
Boulanger, J., Mclellan, B.N., Woods, J.G., Progtor, M.F., & Strobeck, C. (2004). Sampling design
and bias in DNA-based capture-mark-recapture population and density estimates of grizzly
bears. Journal of Wildlife Management, 68 (3), 457-469. https://doi.org/10.2193/0022-
541X(2004)068[0457:SDABID]2.0.CO;2
Bonin, A., Bellemain, E., Desen, P.B., Pom-Panon, F., Brochmann, C., & Taberlet, P. (2004). How
to track and assess genotyping errors in population genetics studies. Molecular Ecology, 13,
3261-3273. https://doi.org/10.1111/j.1365-294X.2004.02346.x
Bahuguna, A. (2010). Reptilia. In: Fauna of Uttarakhand. (Part 1) Vertebrates. State Fauna Series
18. Editor, Director, Zoological Survey of India, M-Block, New Alipore, Kolkata 700 053.
Zoological Survey of India, Kolkata, India. 621 p. Available:
http://faunaofindia.nic.in/PDFVolumes/sfs/062/index pdf [Accessed: 31 January 2020].
Caroline, S., Jaret, D., Lei, X., & Kristin, R. (2019). Using Noninvasive Genetic Sampling to Survey
Rare Butterfly Populations. Insects, 10 (10), 311.
https://doi.org/10.3390/insects1010031189| Journal of Wildlife and Biodiversity 5 (1): 81-91 (2021)
Carroll, E.L., Bruford, M.W., DeWoody, J.A., Leroy, G., Strand, A., Waits, L., & Wang, J. (2018).
Genetic and genomic monitoring with minimally invasive sampling methods. Evolutionary
Applications, 11, 1094–1119.
Dubey, B., Meganathan, P.R., & Haque, I. (2011). DNA Minibarcoding: An approach for forensic
identification of some endangered Indian snake species. Forensic Science International
Genetic, 5 (3), 181-4. https://doi.org/10.1016/j.fsigen.2010.03.001
Eggert, L.S., Eggert, J.A., & Woodruff, D.S. (2003). Estimating population sizes for elusive
animals: the forest elephants of Kakum National Park, Ghana. Molecular Ecology, 12 (6),
1389-1402. https://doi.org/10.1046/j.1365-294x.2003.01822.x
Folmer, O., Black, M., Hoeh, W., Lutz, R., Vrijenhoek, R. (1994). DNA primers for amplification
of mitochondrial cytochrome c oxidase subunit I from diverse metazoan invertebrates.
Molecular Marine Biology and Biotechnology, 3(5), 294-299.
Fetzner, J. (1999). Extracting high-quality DNA from shed reptiles skins: a simplified method.
BioTechniques, 26 (6), 1052–1054. https://doi.org/10.2144/99266bm09
Hryncewicz-Gwozdz, A., Jagielski, T., Dobrowolska, A., Szepietowski, C., & Baran, E. (2011).
Identification and differentiation of Trichophyton rubrum clinical isolates using PCR-RFLP
and RAPD methods. European Journal of Clinical Microbiology & Infectious Diseases, 30
(6), 727-731. https://doi.org/10.1007/s10096-010-1144-3
Hebert, P. D. N., Cywinska, A., Ball, S. L., & deWaard, J. R. (2003). Biological identifications
through DNA barcodes. Proceedings of the Royal Society B: Biological Sciences, 270
(1512), 313–321. https://doi.org/10.1098/rspb.2002.2218
Hall, T.A. (1999). BioEdit: a user-friendly biological sequence alignment editor and analysis
program for Windows 95/98/NT. Nucleic acids symposium series, 41, 95–98.
Heise, P.J., Maxson, L.R., Dowling, H.G., & Hedges, S.B. (1995). Higher-level snake phylogeny
inferred from mitochondrial DNA sequences of 12S rRNA and 16S rRNA genes. Molecular
Biology and Evolution, 12 (2), 259- 265.
https://doi.org/10.1093/oxfordjournals.molbev.a040202
Hoss, M., Kohn, M., Paabo S., Knauer, F., & Schroder, W. (1992). Excrement analysis by PCR.
Nature, 359 (6392). https://doi.org/10.1038/359199a0
Kumar, S., Stecher, G., & Tamura, K. (2016). MEGA7 Molecular Evolutionary Genetics Analysis
version 7.0 for bigger datasets. Molecular Biology and Evolution, 33 (7), 1870-1874.
https://doi.org/10.1093/molbev/msw054
Kumar V.P., Kumar D., & Goyal S.P. (2014). Wildlife DNA forensic in curbing illegal wildlife
trade: species identification from seizures. International Journal of Forensic Science &
Pathology, 2 (5), 38–42. https://dx.doi.org/10.19070/2332-287X-1400012
Koch, H. (2010). Combining morphology and DNA barcoding resolves the taxonomy of Western
Malagasy Liotrigona Moure, 1961. African Invertebrates, 51 (2), 413–421.
Kent, R. J., Deus, S., Williams, M., & Savage, H.M. (2010). Development of a multiplexed
polymerase chain reaction-restriction fragment length polymorphism (PCR-RFLP) assay to
identify common members of the subgenera Culex (Culex) and Culex (Phenacomyia) in
Guatemala. American Journal of Tropical Medicine and Hygiene, 83 (2), 285-291.
https://doi.org/10.4269/ajtmh.2010.10-007790| Journal of Wildlife and Biodiversity 5 (1): 81-91 (2021)
Kress, W. J., Wurdack, K. J., Zimmer, E. A., Weigt, L. A., & Janzen D. H. (2005). Use of DNA
barcodes to identify flowering plants. Proceedings of the National Academy of Sciences
U.S.A., 102 (23), 8369–74. https://doi.org/10.1073/pnas.0503123102
Kimura, M. (1980). A simple method for estimating evolutionary rates of base substitutions through
comparative studies of nucleotide sequences, Journal of Molecular Evolution, 16, 111–120.
https://doi.org/10.1007/BF01731581
Lobo, D., Godinho R., Álvares F., López-Bao, J. V., & Rodríguez A. (2015). A New Method for
Noninvasive Genetic Sampling of Saliva in Ecological Research. PLoS ONE, 10 (10),
e0139765. https://doi.org/10.1371/journal.pone.0139765
Landmann, L. (1986). The skin of Reptiles: epidermis and dermis In Biology of the Integument,
Vertebrate (edsBereither-Hahn J, Matoltsy G, Sylvia-Richards K), pp. 150–187. Berlin-
Heidelberg- New York: Springer Verlag.
Mills, L.C., Citta, J.J., Lair, K.P., Schwartz, M.K., & Tallmon, D.A. (2000). Estimating animal
abundance using noninvasive DNA sampling: Promise and pitfalls. Ecological Applications,
10, 283–294.
https://doi.org/10.1890/1051-0761(2000)010[0283:EAAUND]2.0.CO;2
Mckelvey, K.S., & Schwartz, M.K. (2010). Genetic errors associated with population estimation
using noninvasive molecular tagging: problems and new solutions. Journal of Wildlife
Management, 68, 439-448. https://doi.org/10.2193/0022-541X(2004)068[0439:GEAWPE]2.0.CO;2
Maderson, P.F.A., Rabinowitz, T., Tandler, B., & Alibardi, L. (1998). Ultrastructural contributions
to an understanding of the cellular mechanisms involved in lizard skin shedding with
comments on the function and evolution of a unique Lepido saurian phenomenon. Journal
of Morphology, 236(1),1–24.
https://doi.org/10.1002/(SICI)1097-4687(199804)236:13.0.CO;2-B
Morin, P.A., & Woodruff, D.S. (1992). Paternity exclusion using multiple hypervariable
microsatellite loci amplified from nuclear DNA of hair cells. Pp 63-81 in R. D. Martin, A.
F. Dixson, and E. J. Wickings, editors. Paternity in primates: genetic tests and theories.
Karger, Basel, Switzerland.
Maderson, P.F. (1985a). Some developmental problems of the reptilian integument. In Biology of
Reptilia: Development (EdsGans C, Billett F, Maderson PF), pp. 525–598. New York: John
Wiley & Sons.
Maderson, P.F. (1985b).A Histological changes in the epidermis of snakes during the sloughing
cycle. Journsl of Zoology 146:98–113.
Piggott, M.P., & Taylor, A.C. (2003). Remote collection of animal DNA and its applications in
conservation management and understanding the population biology of rare and cryptic
species. Wildlife Research, 30 (1), 1-13. https://doi.org/10.1071/wr02077
Paetkau, D. (2003). An empirical exploration of data quality in DNA-based population inventories.
Molecular Ecology, 12 (6), 1375-1387. https://doi.org/10.1046/j.1365-294X.2003.01820.x
Rajpoot, A., Kumar, V.P., Bahuguna, A., & Kumar D. (2017). Araniellacucurbitina: the first
molecular evidence of a Palearctic species of genus Araniella inhabiting India.
Mitochondrial DNA Part A, 28, 1-9, https://doi.org/10.1080/24701394.2017.137310591| Journal of Wildlife and Biodiversity 5 (1): 81-91 (2021)
Rajpoot, A., Kumar, V.P., Bahuguna, A., & Kumar D. (2016). Forensically informative nucleotide
sequencing (FINS) for the first time authentication of Indian Varanus species: implication
in wildlife forensics and conservation, Mitochondrial DNA Part A, 26, 1-9,
https://doi.org/10.1080/24701394.2016.1202943
Sundriyal, M., & Sharma, B. (2016). Status of Biodiversity in Central Himalaya."Applied Ecology
and Environmental Sciences, 4 (2), 37-43. https://doi.org/10.12691/aees-4-2-1
Saitou, N., & Nei M. (1987). The neighbor-joining method: a new method for reconstructing
phylogenetic trees. Molecular Biology and Evolution, 4 (4), 406–425.
https://doi.org/10.1093/oxfordjournals.molbev.a040454
Taberlet, P., & Bouvet, J. (1992). Bear conservation genetics. Nature, 358, 1-97.
https://doi.org/10.1038/358197a0
Taberlet, P., Waits, L.P., & Luikart, G. (1999). Noninvasive genetic sampling: look before you leap.
Trean Ecology and Evolution, 14 (8), 323-327.
https://doi.org/10.1016/s0169-5347(99)01637-7
Verma, S.K., & Singh, L. (2003).Novel universal primers establish identify of an enormous number of
animal species for forensic application. Molecular Ecology Notes 3(1), 28-31.
https://doi.org/10.1046/j.1471-8286.2003.00340.x
Waits, L. P. (2004). Using noninvasive genetic sampling to detect and estimate abundance of rare
wildlife species. Pages 211-228, by W. L. Thomas, editor. Sampling rare or elusive species:
concepts, designs, and techniques for estimating population parameters. Island Press,
Washington, D. C., USA.
Wong, K.L., Wang, J., But, P.P.H., & Shaw, P.C. (2004). Application of cytochrome b DNA
sequences for the authentication of endangered snake species. Forensic Science
International, 139 (1), 49-55. https://doi.org/10.1016/j.forsciint.2003.09.015You can also read