A potential commercial use of cajeta (a traditional milk product from Mexico) in the development of whey beverages
←
→
Page content transcription
If your browser does not render page correctly, please read the page content below
a
ISSN 0101-2061 (Print)
Food Science and Technology ISSN 1678-457X (Online)
DOI: https://doi.org/10.1590/fst.05221
A potential commercial use of cajeta (a traditional milk product from Mexico) in the
development of whey beverages
Jahir Antonio BARAJAS-RAMÍREZ1, Carolina RAMÍREZ-LÓPEZ2, Victoria Guadalupe AGUILAR-RAYMUNDO1*
Abstract
Cajeta is a Mexican artisanal candy elaborated from goat milk. While it is popular among consumers, it is necessary to find
alternative uses to improve access to stable and fair trade for producers. Therefore, the objective of this study was to develop a
functional beverage using whey with different levels of inulin (4, 8 and 12%) as a prebiotic, guar gum (0.321, 0.625 and 1.25%)
as a thickener and cajeta (20% v/v) as flavoring. Nine formulations were prepared, stored at 4 °C and analyzed on days 0, 7 and
14. The pH values were constant (5.9) in all formulations, while acidity exhibited changes on days 0 and 14. Flow properties
of the beverages exhibited a non-Newtonian behavior and fitted best with the Power Law (PL). According to acceptance tests
and a Check-All-That-Apply (CATA) questionnaire, it was possible to obtain a cajeta-flavored whey-beverage using lower
concentrations of inulin and gum. The physicochemical characteristics provided by ingredients added in lower concentrations
did not affect the organoleptic properties of the product, showed lower viscosity, and were highly accepted by most participants.
Keywords: Cajeta; whey beverage; inulin; guar gum; physicochemical characteristics; sensory properties.
Practical Application: The combination of cajeta, whey, and hydrocolloids is a viable alternative since the commercialization
of cajeta as part of the whey beverage is potentialized.
1 Introduction
Nowadays, the demand for foods with functional properties Guimarães et al., 2019). While recent data suggests that their
is increasing around the world. Flavored energy drinks, and/or consumption is growing worldwide, this type of product is
beverages with added fibers, oligosaccharides, or fermented mainly present in the sports nutrition market (Ha & Zemel, 2003;
beverages with prebiotics and probiotics are some examples of Janiaski et al., 2016).
products that have been developed (Molero & Briñez, 2018).
Some of the whey-cheese-based beverages incorporate
Dulce de leche (milk jam, milk caramel) is a form of sweetened
microorganisms which generate fermented beverages, however
condensed milk that is very popular in countries such as Mexico,
some research has been conducted to analyze the effects of adding
Argentina, and Brazil, and may be produced from cow or
fruit pulp such as banana (Dhamsaniya & Varshney, 2013), mango
goat milk (Park & Haenlein, 2013). The changes in consumer
(Ismail et al., 2011; Sakhale et al., 2012; Chavan et al., 2015b),
preferences associated with the low consumption of sugars has
pineapple (Shukla, 2012; Baljeet et al., 2013) as well as other
led to a decrease in demand for these types of products, meaning
artificial and natural flavorings.
that alternatives are sought for consumption without negatively
effecting the consumer’s health. On the other hand, high-intensity ultrasound technology
(HIUS) has been intensively studied in recent years and applied
Whey is a by-product of the cheese industry with a high
in different food systems. Guimarães et al. (2019), evaluated the
production worldwide. It is characterized as being an industrial
nutritional profile and volatile compounds present in a prebiotic
effluent, with a high biochemical oxygen demand due to its high
(inulin) soursop whey beverage in the presence of high-intensity
organic compound content, which in turn makes it one of the
ultrasound as compared to conventional high-temperature short
most polluting by-products (Panghal et al., 2017). Whey contains
time. Monteiro et al. (2020), analyzed the physicochemical,
more than half the nutrients of milk, such as salts, vitamins,
microstructural, and sensory characteristics of a chocolate whey
lactose, enzymes, and proteins rich in essential amino acids.
beverage processed using HIUS technology. Both results highlight
Furthermore, a group of bioactive compounds derived from
the feasibility of using ultrasound in manufacturing functional
whey were studied for their potential health benefits, such as
dairy products, with therapeutic properties, preservation of
enhancing the immune function and modulating the adiposity
nutritional compounds of the food.
and antioxidant capacity (Ha & Zemel, 2003; Chavan et al., 2015a;
Arranz et al., 2019). Whey-based drinks have entered the market The use of sensory evaluation techniques in the development
because of their functional potential and the fact that they are and optimization of food products can help to identify the
accepted by different consumer groups (Castro et al., 2009; characteristics that lead to their greater acceptance by consumers
Received 06 Feb., 2021
Accepted 15 Mar., 2021
1
Programa Académico de Ingeniería Agroindustrial, Universidad Politécnica de Pénjamo, Pénjamo, Guanajuato, México
2
Instituto Politécnico Nacional, Centro de Investigación en Biotecnología Aplicada, Tlaxcala, México
*Corresponding author: vaguilar@uppenjamo.edu.mx
Food Sci. Technol, Campinas, Ahead of Print, 2021 1/8 1Functional flavoured whey beverages
(Ares & Jaeger, 2013; Li et al., 2015), while manufacturers are Engineering Laboratories Inc., MA, USA) using a sample of
increasingly interested in the final consumers´ opinions and 120 mL. Shear stress (τ) was determined at the correspondent
expectations of their products (Parente et al., 2011). Furthermore, shear rates (γ) obtained from readings at 6, 12, 30, 50 y 100 rpm
the use of consumer tests and classification techniques are at 20 °C, as well as applying the corresponding relationships
useful for identifying niches of consumers according to provided by the manufacturer (Brookfield, 2011) (Equations 1-3).
their preferences (Berget, 2018), which could in turn help
steer the food manufacturers’ efforts in the right direction
with regard to product development (Parente et al., 2011; 2ω RC2 Rb2
γ =
Bruzzone et al., 2015). Rb2 (R
2
C − Rb2 ) (1)
Therefore, the objective of this work was to develop and
characterize a whey-based beverage flavored with Mexican ω=
2π N
(2)
caramel jam (“cajeta”) by determining the physicochemical, 60
flow behavior, and sensory properties with regard to time,
generating a novel product using whey as a potential functional reading
M
and sustainable ingredient. 100
τ= (3)
2π Rb2 L
2 Materials and methods
where, γ: shear rate (1/s); ω: spindle angular velocity (rad/s); Rc:
2.1 Raw materials container radius (m), Rb: spindle radius (m), N: spindle speed
(rpm), τ: Shear stress (Pa), L: spindle height (m). M: torque for
Whey was kindly provided by a small company that this viscometer = 6.73 x 10⁻⁵(N·m).
makes fresh cheese. Dairy beverage formulations were
prepared by using skimmed milk powder (Svelty, Nestlé, The experimental flow responses or rheograms were fitted
Mexico), Inulin (Tequilera Real de Penjamo, Guanajuato, to three mathematical relationships, which were the Power Law
Mexico.), guar gum (HSN Foods) and cajeta (a type of (PL), Herschel–Bulkley (HB) and Bingham plastic (BP) models.
artisanal candy elaborated with goat milk) which was used in Two goodness of fit tests were applied to the obtained
this formulation as a flavoring agent (Arandas, Guanajuato, experimental data, the percentage of the mean error (PEM,
Mexico). Physicochemical analyses were determined for cheese Equation 4) and the root- mean-square error (RMSE, Equation 5),
whey to adjust the solids using a lactoscan (Milkanalyzer, to verify the fit of each model to the rheological behavior of
6527, Nova Zagora, Bulgaria). each dairy beverage:
2.2 Whey beverage preparation
100 ne τ exp − τ pred
Firstly, the whey is filtered using muslin cloth. For preparing PEM = ∑
ne i =1 τ exp
(4)
the beverages were formulated from pasteurized liquid whey
(65 °C/30 min). The milk powder (solids 15% w/v) was add
and dissolved in the whey before all ingredients, then inulin (4, 1 ne
( ) )1/ 2
2
8 and 12% w/v), guar gum (0.321, 0.625 and 1.25% w/v), and
RSME = ∑ ( τ exp −τ pred (5)
ne i =1
flavor (cajeta, 20% v/v), were adding to whey and mixed with
a manual mixer (model BL687CO, Massachusetts, USA), each where: τexp = experimental shear stress (Pa); τpred = predicted
batch of bottles was filled and pasteurized a 65 °C/30 min and shear stress (from the applied model, Pa); and ne = the number
finally were stored (4 ± 2 °C) for further analysis. from the experimental data (from the flow curve, dimensionless).
2.3 Physicochemical analysis 2.5 Sensory acceptance and characterization
The pH was determined at 20 °C with a digital potentiometer Firstly, a session was conducted to obtain the characteristics
(model HI 98107; HANNA, Italy) which had been previously for describing the beverages formulated. At this stage, 20
calibrated. The acidity was measured by titration of a 10 mL participants (11 females: 9 males, aged 20-49 years old)
sample with NaOH (0.1N) and phenolphthalein as an indicator received a 30 mL sample of the nine beverages with three-digit
(0.1%) using method 16.023 (Association of Official Analytical randomized numbers. Subjects were asked to write on a white
Chemists, 1980). Total solids were determined using a digital sheet of paper all the perceived characteristics of appearance,
refractometer (A. Krüss 0 – 90 °Brix, DR 201-95-OE, Hamburg), smell, texture, and taste that could help to discriminate
while measurements were made in both whey and beverage between samples. A list of attributes was obtained and the
formulations after 0, 7, and 14 days of storage. most frequently mentioned were selected for inclusion in a
Check-All-That-Apply (CATA) questionnaire.
2.4 Flow properties
One hundred and twenty subjects participated in the study, each
Flow properties for the whey-based beverages were receiving a 20 mL sample of each of the nine beverage formulas.
carried out in a Brookfield DV-II + Pro viscometer (Brookfield After tasting, subjects indicated the acceptance for the samples
2 2/8 Food Sci. Technol, Campinas, Ahead of Print, 2021Barajas-Ramírez; Ramírez-López; Aguilar-Raymundo
by a rank-rating procedure (O’Mahony & Wichchukit, 2017), during storage was studied and results are shown in Table 1.
ordering the samples from the least to the most preferred The physicochemical properties of all formulations exhibited
and by rating them from the least to the most accepted in a constant pH (5.9) throughout refrigerated storage (Table 1).
a 15-point scale. After the participants had completed the By contrast, the acidity values increased (p < 0.05) in all
acceptance test, they received a CATA questionnaire with the formulations on day 14 of refrigerated storage. Although there
attributes obtained from a previous stage and were asked to is a reported pH and acidity stabilization in dairy beverages
check which characteristics they perceived from each sample. during storage (Silveira et al., 2015; Gomes et al., 2013), in this
To determine how much the beverages differed from their study the acidity increased due to components of beverage
ideal product, subjects were invited to check the attributes formulation. Reported acidity values for fermented beverages
that must and must not be present in their ideal beverages. range from 0.74 - 0.82%, which are strongly influenced by the
In all cases, the samples were presented to the participants in components used, the amount of milk solids added, and the
a counterbalanced and randomized order and were evaluated metabolic activity of microorganisms responsible for fermentation
7 days after they were made. (Thamer & Penna, 2006). As expected, the solid contents in the
formulations made with inulin and gum were higher than the
The frequencies of mentions for the characteristics perceived
control (pFunctional flavoured whey beverages
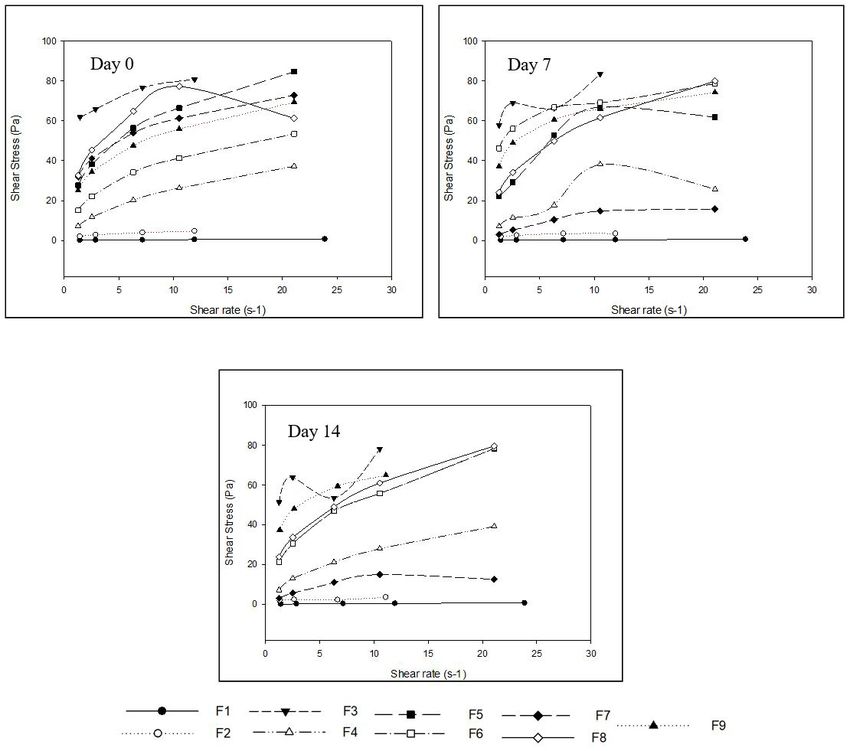
3.3 Flow properties observed (Figure 1). Flow parameters on days 0, 7, and 14 for
goodness determinations indicate that all systems had a better
The analyzed systems showed different trends due to
fit for the PL model. However, they also showed an excellent fit
the proportion of solids affecting particle interactions and for both the HB and BP models.
product consistency. All beverages exhibited a pseudo-plastic
behavior with or without yield stress depending on the model The interactions of inulin and guar gum influenced the
fitting, a characteristic which was reported other studies rheological parameters of the flavored beverage, which may be
(Guimarães et al., 2018). related to structural changes, thereby generating gel formation.
These results were also observed by Guimãraes et al. 2015 in the
The flow properties obtained by applying Power Law (PL), elaboration of a drink based on whey with added acacia gum
Herschel-Bulkley (HB) and Bingham Plastic (BP) equations are and gellan gum. The addition of inulin as a stabilizing agent
given in Table 2. All formulations presented a shear-thinning is beneficial, as some authors indicate that the consumption
non-Newtonian response (n < 1), where the difference between of 4 - 5 g of fructans per day is enough for to be considered
both models is expressed by the presence or consideration of a prebiotic (Rao, 2001; Roberfroid, 1999). According to this
the yield stress, which is part of the HB model. The values of study, the consumption of F1 (4% inulin and 0.312 gum guar)
the consistency coefficient (К) ranged from 1.80 (F2 on day 0) is recommended. Grom et al. (2020), note that the whey-based
to 30.64 Pa sn (F6 on day 0) with PL which are notably different beverage showed a reduction in blood glucose levels compared
to the data for the HB model. This was due to the presence of to consumption of bread alone, suggesting that this dairy matrix
yield stress which ranged from 0.41 (F1 on day 0) to 13.60 Pa can control blood glucose.
(F2 on day 14).
The increase of this rheological parameter is an indicator of 3.4 Sensory characteristics
an increase in total solid content or a decrease in particle content, Twenty subjects participated in the test aimed at obtaining
as these samples are more viscous. From F4 to F9, the increase the sensory descriptors for the beverages. Eleven attributes,
in solids and interactions between the drink components can be chosen for their frequency of mentions, were considered as
Table 2. Flow parameters with Power Law (PL), Herschel-Bulkley (HB) and Bingham Plastic (BP) models for dairy beverages stored after 14 days.
PL HB BP
Formulation Days
n K (Pa s )n
RMSE τ0 (Pa) n K (Pa sn) RMSE τ0 (Pa) ηp (Pa sn) RMSE
0 0.68 0.07 0.04 0.41 0.72 0.60 0.03 0.80 0.02 0.05
F1 (I4 + G0.312) 7 0.61 0.08 0.06 0.68 0.73 0.26 0.08 0.10 0.10 0.08
14 0.68 0.08 0.09 6.8 0.67 2.46 0.06 0.11 0.20 0.01
0 0.39 1.80 0.01 1.17 0.65 0.76 0.03 1.93 0.26 0.04
F2 (I4 + G0.625) 7 0.31 1.70 0.04 1.33 0.49 0.69 0.06 1.95 0.16 0.06
14 0.23 17.75 0.71 13.6 0.54 4.86 0.67 17.62 1.42 0.59
0 0.13 59.38 0.19 52.74 0.55 8.09 0.24 60.59 2.06 0.40
F3 (I4 + G1.25) 7 0.13 56.89 1.06 49.76 0.55 8.18 1.01 57.39 2.27 0.95
14 0.13 50.83 1.74 44.02 0.47 7.71 1.76 50.44 2.17 1.58
0 0.5 6.62 0.20 3.34 0.58 3.34 0.47 8.35 1.45 0.47
F4 (I8 + G0.312) 7 0.54 6.82 1.87 4.76 0.86 2.45 2.21 11.5 1.01 2.07
14 0.59 6.77 0.31 3.43 0.78 3.74 0.64 8.82 1.53 0.63
0 0.4 26.00 0.45 18.89 0.70 8.80 1.43 32.06 2.71 1.62
F5 (I8 + G0.625) 7 0.41 21.33 2.31 16.97 0.81 5.57 3.45 30.27 1.95 3.06
14 0.45 19.56 0.25 12.58 0.70 8.36 0.79 23.77 2.73 1.04
0 0.44 14.22 0.38 9.64 0.72 5.52 1.00 18.00 1.82 1.08
F6 (I8 + G1.25) 7 0.18 45.88 0.50 41.93 0.71 5.16 1.42 51.43 1.42 1.28
14 0.19 45.37 0.44 40.91 0.68 6.06 1.22 51.26 1.59 1.22
0 0.29 30.64 0.30 25.35 0.68 6.88 1.10 36.24 1.91 1.19
F7 (I12 + G0.312) 7 0.62 2.88 0.49 1.62 0.85 1.42 0.68 4.59 0.62 0.57
14 0.55 3.21 0.67 2.42 1.01 0.83 1.06 5.64 0.45 0.74
0 0.26 34.74 2.51 33.03 1.37 1.16 6.06 45.67 1.26 3.16
F8 (I12 + G0.625) 7 0.42 22.50 0.25 15.53 0.7 8.51 1.01 27.62 2.67 1.23
14 0.42 22.05 0.22 15.05 0.69 8.52 0.95 26.98 2.68 1.20
0 0.35 23.88 0.38 18.29 0.69 7.07 1.35 29.03 2.08 1.49
F9 (I12 + G1.25) 7 0.24 37.18 0.58 32.86 0.75 5.37 1.67 43.61 1.65 1.40
14 0.25 36.34 0.33 28.39 0.64 8.94 0.64 38.13 2.77 0.75
Values represent the mean of triplicate analysis. I =inulin (4, 8, 12%); G= guar gum (0.312, 0.625, 1.25%). K: consistency coefficient (Pa∙sn); n: flow behavior index (dimensionless); τ0:
yield stress (Pa) and ηp:plastic viscosity (Pa∙s).
4 4/8 Food Sci. Technol, Campinas, Ahead of Print, 2021Barajas-Ramírez; Ramírez-López; Aguilar-Raymundo
Figure 1. Flow curves for dairy beverages on (a) day 0, (b) day 7, (c) and day 14, during refrigerated storage (4 °C).
the most important sensory descriptors that could contribute solids show low contributions in terms of viscosity and acidity
to distinguishing the beverages made in this experiment. and were therefore less associated with samples or sensory
The selected sensory characteristics corresponded to appearance characteristics. Since the instrumentally measured viscosity was
(yellow and fawn colorations), smell (fermented and vanilla), negatively correlated with the sensory attributes of liquid, sweet
taste (milk, sweet, and intense taste) and texture (liquid, sticky, taste, and vanilla smell as well as being highly correlated with
dense and thick). beverages made with lower and medium concentrations of gum
(F1 and F4), it is possible to conclude that these samples were
The first two axes of the Principal Component Analysis perceived contrarily to those made with higher gum content.
accounted for 71.2% of the variance (Figure 2). The results of
the principal component analysis showed a high correlation
between the viscosity determined instrumentally and the sensory 3.5 Sensory acceptance
attributes of thick and fermented smell, which were related Four clusters of consumers were identified when a K-means
to samples F3, F6 and F9, all of which contained the highest Cluster Analysis was applied to analyze the responses of overall
concentration of gum. Acidity was higher in samples F2, F5 and liking for flavored whey beverages. There were different liking
F8, which contained a medium concentration of gum and were patterns for products between the various groups of consumers.
perceived as viscous by consumers. The pH and total soluble Cluster 1 comprised 33 subjects who gave higher liking values
Food Sci. Technol, Campinas, Ahead of Print, 2021 5/8 5Functional flavoured whey beverages
incorporating sweetness into food products where this attribute
is an expected characteristic (Baharuddin & Sharifudin, 2015),
but there is a threshold or maximum acceptance after which a
higher concentration of sweetness is expected to be rejected
(Lawless & Heymann, 2010; Jayasinghe et al., 2017). This is true
for most consumers, but concentrations for maximum acceptance
will always vary between consumers with different points of
view (Johansen et al., 2010) and other several inter-individual
differences, including sweetness sensitivity (Drewnowski et al., 2012;
Jayasinghe et al., 2017). Determining the highest point in the
u-shaped curve obtained when concentration and liking degrees
are related is an important issue, as the maximum point could
vary between different customer segments. In this study, the
highest sweetness level for maximum liking was different for
each customer segment. However, most subjects agree that the
beverages should have a low to medium gum content in (clusters
2 and 4), while the inulin content should be low to medium
(clusters 2 and 1) to satisfy the highest proportion of consumers
based on the experimental data.
Figure 2. Principal component analysis of physicochemical data
obtained instrumentally, and sensory data obtained by the frequency
of mentions of attributes in CATA questions. F1, F4, F7. Formulations 3.6 Sensory characteristics of flavored whey beverages
with low gum content. F2, F5, F8. Formulations with medium gum Figure 3 shows the spatial distribution of products and
content. F3, F6, F9. Formulations with high gum content.
their associated characteristics according to the participants’
feedback during the study. A high percentage of variance
(94.84%) can be attributed to the first two factors. According
to flavored beverages made from whey with lower gum and to the responses provided by most participants, an ideal whey
inulin content, followed by beverages with low gum content protein beverage should be liquid, sweet, with an intense taste,
and medium to high inulin content, as well as beverages with a vanilla smell, and milky taste. In contrast, the presence of a
medium gum content and low to medium inulin content, meaning fermented smell, yellow coloration, and increased thickness
that it was very important that the samples were perceived as in beverages was considered unacceptable and resulted in the
liquid by these consumers. The participants of cluster 2 (n=43) samples with a higher gum content being rejected. Subjects also
considered the beverages with medium to high gum content indicated that samples with higher fluid characteristics came
as unacceptable; their ratings decreased as the sweetness in closer to the ideal product. It is possible that when the products
samples increased. Therefore, for participants in this cluster, the had higher liquid characteristics, it was easier to stimulate
sweetness in products was more important than the viscosity, the receptor proteins located in the taste buds, affecting the
although they preferred the lowest quantity of inulin in samples. intensity perception of compounds responsible for the sweet
On the other hand, participants from the fourth cluster (n=22) and smell attributes in the beverages. The results obtained
considered samples with medium to low inulin content and any in this experiment partially concur with those obtained by
level of gum content more acceptable but preferred the samples Janiaski et al. 2016, who determined acceptability and drivers of
with more gum and medium inulin content. Finally, the subjects liking for yogurts as well as fermented and non-fermented whey
from the third cluster (n=22) did not show strong acceptance beverages. Their report states that these beverages were highly
for the beverages and only considered the sample with medium accepted and their consumer´s ideal strawberry-flavored whey
gum content and higher inulin content as acceptable. beverage should have a sweet taste and intermediate color and
The sensory characteristics of taste and texture contribute viscosity values, as well as a low intensity acidic taste and aroma.
significantly to defining food preferences (Kourouniotis et al., 2016; Unfortunately, their study does not show any instrumentally
Rosenthal, 2010). According to the results observed for measured texture values for beverages to compare the viscosity
acceptance, consumers from clusters 1 and 2 (63.3% of the in their samples with those obtained in this report. On the other
sample) considered the liquid samples with lower to medium hand, it is worth mentioning that the viscosity expressed in their
sweetness as the best. On the other hand, participants from experiment could be biased because of a contrast effect when
cluster 4 (18.3% of participants) considered the most viscous comparing yogurts and whey beverages as these samples were
samples with medium sweetness levels as the most acceptable, tested in the same session.
while 18.7% of the participants preferred the sweetest beverages Formulations with medium gum content with any
with medium viscosity.
quantity of added inulin (F2, F5, and F8) were perceived as
The results obtained from the acceptance tests are more viscous and acidic than those made with a lower gum
interesting for the development of the product tested in this content. The beverages made with the highest gum content
experiment. Liking of sweet-tasting foods is innate, universal, (F3, F6, and F9) were associated with a fermented smell and
and expected (Drewnowski et al., 2012). An emphasis is placed on perceived as the thickest among all the samples by consumers.
6 6/8 Food Sci. Technol, Campinas, Ahead of Print, 2021Barajas-Ramírez; Ramírez-López; Aguilar-Raymundo
Arranz, E., Corrochano, A. R., Shanahan, C., Villalva, M., Jaime,
L., Santoyo, S., Callanan, M. J., Murphy, E., & Giblin, L. (2019).
Antioxidant activity and characterization of whey protein-based
beverages: Effect of shelf life and gastrointestinal transit on bioactivity.
Innovative Food Science & Emerging Technologies, 57, 102209. http://
dx.doi.org/10.1016/j.ifset.2019.102209.
Association of Official Analytical Chemists – AOAC. (1980). Official
methods of analysis (13th ed., 240 p.). Washington: AOAC.
Baharuddin, A. R., & Sharifudin, M. S. (2015). The impact of geographical
location on taste sensitivity and preference. International Food
Research Journal, 22(2), 731-738.
Baljeet, S. Y., Ritika, B. Y., & Sarita, R. (2013). Studies on development
and storage of whey-based pineapple (Ananas comosus) and bottle
gourd (Lagenaria siceraria) mixed herbal beverage. International
Food Research Journal, 20(2), 607-612.
Berget, I. (2018). Statistical approaches of consumer segmentation.
In G. Ares & P. Varela (Eds.), Methods in consumer research: new
approaches to classic methods (Woodhead Publishing Series in Food
Science, Technology and Nutrition, pp. 731-738). Duxford: Woodhead
Publishing. http://dx.doi.org/10.1016/B978-0-08-102089-0.00014-5.
Figure 3. Distribution of flavored whey beverages and attributes by Brookfield. (2011). Viscosimeter Handbook, DV-II + Pro Operating
frequency of mentions by consumers answering CATA questions. F1, F4, Instructions (Manual No. M03-165-F0612, Vol. 8139). Retrieved
F7. Formulations with low gum content. F2, F5, F8. Formulations with from www.brookfieldengineering.com
medium gum content. F3, F6, F9. Formulations with high gum content.
Bruzzone, F., Vidal, L., Antúnez, L., Giménez, A., Deliza, R., & Ares, G.
(2015). Comparison of intensity scales and CATA questions in new
product development: sensory characterisation and directions for
These last-mentioned attributes were highly correlated with product reformulation of milk desserts. Food Quality and Preference,
the instrumentally determined viscosity values (Figure 3). 44, 183-193. http://dx.doi.org/10.1016/j.foodqual.2015.04.017.
According to the instrumentally determined values, the least Castro, F. P., Cunha, T. M., Ogliari, P. J., Teófilo, R. F., Ferreira, M.
viscous beverages were samples 1 and 4, which is what was M. C., & Prudêncio, E. S. (2009). Influence of different content
perceived by consumers, who indicated that those samples had of cheese whey and oligofructose on the properties of fermented
the strongest liquid characteristics. lactic beverages: study using response surface methodology.
Lebensmittel-Wissenschaft + Technologie, 42(5), 993-997. http://
Despite the differences in total acidity and total soluble dx.doi.org/10.1016/j.lwt.2008.12.010.
solids determined instrumentally, there was no association
Chatterrjee, G., De Neve, J., Dutta, A., & Das, S. (2015). Formulation
between these characteristics and the attributes perceived
and statistical evaluation of a ready-to-drink whey based orange
and reported by the consumers who completed the CATA beverage and its storage stability. Revista Mexicana de Ingeniería
questionnaire. In contrast, increased viscosity in samples was Química, 14(2), 253-264.
associated with dense, thicker, and more viscous products.
Chavan, R. S., Kumar, A., & Nalawade, T. (2015a). Whey Bases Beverage:
Furthermore, while the samples were more viscous, they Its functionality, formulations, health benefits and Applications.
were also associated with a fermented smell, as well as a less Food Processing & Technology, 6(10), 1-8.
intense vanilla smell and milky taste. These attributes were
Chavan, R. S., Nalawade, T., & Kumar, A. (2015b). Studies on the
perceived contrarily when the viscosity value decreased in development of whey bases mango beverage. Research & Reviews:
the samples. Journal of Food and Dairy Technology, 3(2), 1-10.
Dhamsaniya, N. K., & Varshney, A. K. (2013). Development and
4 Conclusions evaluation of whey based rts beverage from ripe banana juice.
The use of whey as a byproduct from the making process Journal of Food Processing & Technology, 04(02). http://dx.doi.
of cheese is a feasible alternative ingredient in the production org/10.4172/2157-7110.1000203.
of functional beverages. According to acceptance tests and a Drewnowski, A., Mennella, J. A., Johnson, S. L., & Bellisle, F. (2012).
CATA questionnaire, it is possible to obtain a cajeta-flavored Sweetness and food preference. The Journal of Nutrition, 7(6), 1142-
whey-beverage which is widely accepted by a large section of 1148. http://dx.doi.org/10.3945/jn.111.149575. PMid:22573785.
consumers and with functional characteristics when added Gomes, J. J. L., Duarte, A. M., Batista, A. S. M., Figueiredo, R. M. F.,
with inulin. Sousa, E. P., de Souza, E. L., & Queiroga, R. (2013). Physicochemical
and sensory properties of fermented dairy beverages made with
goat’s milk, cow’s milk and a mixture of the two milks. Lebensmittel-
References Wissenschaft + Technologie, 54(1), 18-24. http://dx.doi.org/10.1016/j.
Ares, G., & Jaeger, S. R. (2013). Check-all-that-apply questions: influence lwt.2013.04.022.
of attribute order on sensory product characterization. Food Grom, L. C., Rocha, R. S., Balthazar, C. F., Guimarães, J. T., Coutinho,
Quality and Preference, 28(1), 141-153. http://dx.doi.org/10.1016/j. N. M., Barros, C. P., Pimentel, T. C., Venâncio, E. L., Collopy, I.
foodqual.2012.08.016. Jr., Maciel, P. M. C., Silva, P. H. F., Granato, D., Freitas, M. Q.,
Food Sci. Technol, Campinas, Ahead of Print, 2021 7/8 7Functional flavoured whey beverages
Esmerino, E. A., Silva, M. C., & Cruz, A. G. (2020). Postprandial Monteiro, S. H. M. C., Silva, E. K., Guimarães, J. T., Freitas, M. Q.,
glycemia in healthy subjects: which probiotic dairy food is more Meireles, M. A. A., & Cruz, A. G. (2020). High-intensity ultrasound
adequate? Journal of Dairy Science, 103(2), 1110-1119. http://dx.doi. energy density: How different modes of application influence the
org/10.3168/jds.2019-17401. PMid:31785881. quality parameters of a dairy beverage. Ultrasonics Sonochemistry,
Guimarães, J. T., Keven Silva, E., Senaka Ranadheera, C., Moraes, J., 63, 104928. http://dx.doi.org/10.1016/j.ultsonch.2019.104928.
Raices, R. S. L., Silva, M. C., & Cruz, A. G. (2019). Effect of high- PMid:31952002.
intensity ultrasound on the nutritional profile and volatile compounds O’Mahony, M., & Wichchukit, S. (2017). The evolution of paired
of a prebiotic soursop whey beverage. Ultrasonics Sonochemistry, preference tests from forced choice to the use of ‘No Preference’
55, 157-164. http://dx.doi.org/10.1016/j.ultsonch.2019.02.025. options, from preference frequencies to dʹ values, from placebo
PMid:30853535. pairs to signal detection. Trends in Food Science and Technology,
66, 146–152. https://doi.org/10.1016/j.tifs.2017.05.017.
Guimarães, J. T., Silva, E. K., Costa, A. L. R., Cunha, R. L., Freitas,
M. Q., Meireles, M. A. A., & Cruz, A. G. (2018). Manufacturing a Panghal, A., Kumar, V., Dhull, S. B., Gat, Y., & Chhikara, N. (2017).
prebiotic whey beverage exploring the influence of degree of inulin Utilization of dairy industry waste-whey in formulation of papaya
polymerization. Food Hydrocolloids, 77, 787-795. http://dx.doi. RTS beverage. Current Research in Nutrition and Food Science, 5(2),
org/10.1016/j.foodhyd.2017.11.021. 168-174. http://dx.doi.org/10.12944/CRNFSJ.5.2.14.
Ha, E., & Zemel, M. B. (2003). Functional properties of whey, whey Parente, E., Manzoni, A. V., & Ares, G. (2011). External preference
components, and essential amino acids: mechanisms underlying health mapping of commercial antiaging creams based on consumer’s
responses to a check-all-that-apply question. Journal of Sensory Studies,
benefits for active people. The Journal of Nutritional Biochemistry,
26(2), 158-166. http://dx.doi.org/10.1111/j.1745-459X.2011.00332.x.
14(5), 251-258. http://dx.doi.org/10.1016/S0955-2863(03)00030-5.
Park, W. Y., & Haenlein, F. W. G. (2013). Milk and dairy products in
Ismail, A. E., Abdelgader, M. O., & Ali, A. A. (2011). Microbial and
human nutrition: production, composition and health (1st ed., Chap.
chemical evaluation of Whey-Based Mango beverage. Advance
19, Condensed and powered milk). Chichester: Wiley-Blackwell.
Journal of Food Science and Technology, 3(4), 250-253.
Rao, V. A. (2001). The prebiotic properties of oligofructose at low intake
Janiaski, D. R., Pimentel, T. C., Cruz, A. G., & Prudencio, S. H. (2016).
levels. Nutrition Research, 21(6), 843-848. http://dx.doi.org/10.1016/
Strawberry-flavored yogurts and whey beverages: what is the sensory S0271-5317(01)00284-6.
profile of the ideal product? Journal of Dairy Science, 99(7), 5273-
5283. http://dx.doi.org/10.3168/jds.2015-10097. PMid:27157581. Roberfroid, M. B. (1999). Concepts in functional foods: the case of
inulin and oligofructose. The Journal of Nutrition, 129(7, Suppl),
Jayasinghe, S. N., Kruger, R., Walsh, D. C. I., Cao, G., Rivers, S., Richter, 1398S-1401S. http://dx.doi.org/10.1093/jn/129.7.1398S. PMid:10395606.
M., & Breier, B. H. (2017). Is sweet taste perception associated with
Rosenthal, A. J. (2010). Texture profile analysis: how important are
sweet food liking and intake? Nutrients, 9(7), 1-19. http://dx.doi.
the parameters? Journal of Texture Studies, 41(5), 672-684. http://
org/10.3390/nu9070750. PMid:28708085.
dx.doi.org/10.1111/j.1745-4603.2010.00248.x.
Johansen, S. B., Hersleth, M., & Næs, T. (2010). A new approach to
Sakhale, B. K., Pawar, V. N., & Ranveer, R. (2012). Studies on the
product set selection and segmentation in preference mapping. Food
development and storage of whey based RTS beverage from mango
Quality and Preference, 21(2), 188-196. http://dx.doi.org/10.1016/j.
Cv. Kesar. Journal of Food Processing & Technology, 3(3), 1000148.
foodqual.2009.05.007. http://dx.doi.org/10.4172/2157-7110.1000148.
Kourouniotis, S., Keast, R. S. J., Riddell, L. J., Lacy, K., Thorpe, M. Shukla, M. (2012). Development of probiotic beverage from whey and
G., & Cicerale, S. (2016). The importance of taste on dietary choice, pineapple juice. Journal of Food Processing & Technology, 4(2), 4-7.
behaviour and intake in a group of young adults. Appetite, 103, 1-7. http://dx.doi.org/10.4172/2157-7110.1000206.
http://dx.doi.org/10.1016/j.appet.2016.03.015. PMid:26972352.
Silveira, E. O. D., Lopes Neto, J. H., Silva, L. A., Raposo, A. E. S., Magnani,
Lawless, H. T., & Heymann, H. (2010). Acceptance testing. In H. T. M., & Cardarelli, H. R. (2015). The effects of inulin combined
Lawless & H. Hermann (Eds.), Sensory evaluation of food: principles with oligofructose and goat cheese whey on the physicochemical
and practices (2nd ed., Vol. 20, No. 3). New York: Springer. https:// properties and sensory acceptance of a probiotic chocolate goat dairy
doi.org/10.1007/978-1-4419-6488-5_20. beverage. Lebensmittel-Wissenschaft + Technologie, 62(1), 445-451.
Li, B., Hayes, J. E., & Ziegler, G. R. (2015). Maximizing overall liking http://dx.doi.org/10.1016/j.lwt.2014.09.056.
results in a superior product to minimizing deviations from ideal Thamer, K. G., & Penna, A. L. B. (2006). Characterization of functional
ratings: an optimization case study with coffee-flavored milk. Food dairy beverages fermented by probiotics and with the addition of
Quality and Preference, 42(1), 27-36. http://dx.doi.org/10.1016/j. prebiotics. Food Science and Technology, 26(3), 589-595. http://
foodqual.2015.01.011. PMid:26005291. dx.doi.org/10.1590/S0101-20612006000300017.
Molero, M., & Briñez, W. J. (2018). Probiotics consumption increment Yasmin, A., Butt, M. S., Sameen, A., & Shahid, M. (2013). Physicochemical
through the use of whey-based fermented beverages (pp. 115-132). and amino acid profiling of cheese whey. Pakistan Journal of Nutrition,
London: Intechopen. http://dx.doi.org/10.5772/intechopen.72362. 12(5), 455-459. http://dx.doi.org/10.3923/pjn.2013.455.459.
8 8/8 Food Sci. Technol, Campinas, Ahead of Print, 2021You can also read