A.N. Severtsov Insti tute of Ecology and Evoluti on, Leninskiy av. 33, 119071 Moscow, Russia
←
→
Page content transcription
If your browser does not render page correctly, please read the page content below
Bird Census News 2020, 33/1–2: 3–13

         PARUS program: wintering land bird monitoring in European Russia

                        Ekaterina Preobrazhenskaya1, Anton Morkovin2*

     1
      A.N. Severtsov Institute of Ecology and Evolution, Leninskiy av. 33, 119071 Moscow, Russia
                                         voop21@rambler.ru
    2
      Zoological Museum of M.V. Lomonosov Moscow State University, Bolshaya Nikitskaya Str. 2,
                                        125009 Moscow, Russia
                                       a.morkovin@yandex.com
                 * Corresponding author: Anton Morkovin a.morkovin@yandex.com

                         Abstract. For more than 30 years, the PARUS program has implemented annual
                         censuses of wintering birds across a network of model sites in the European Russia
                         forest zone. The scheme is run mostly by volunteers who make transect counts;
                         it enables the estimation of bird population density in typical forest habitats. We
                         present an analysis of wide-scale population trends in forest habitats using TRIM
                         software for 17 common birds. Between 1988 and 2019, seven species had decreas-
                         ing trends, populations of nine species were stable, and none showed a significant
                         increase. Species associated with coniferous trees had a more pronounced decline
                         in comparison to generalist species; declines were most dramatic for Goldcrest
                         Regulus regulus, Willow Poecile montanus and Coal Tits Periparus ater. Similar
                         tendencies were reported with monitoring schemes in neighbouring countries. We
                         suppose that main negative factor was intense logging in boreal forests; climate
                         change could also play a role.

Introduction                                             The program was started in 1986; during the
                                                         first years, it increased its coverage and has been
Bird dynamics are a widely used indicator for            producing comparable data since 1988, encom-
wildlife monitoring purposes, as birds are nu-           passing the majority of the target region. Today it
merous and ecologically variable group which are         unites more than 200 participants annually, who
relatively simple to count (Koskimies 1989). Usu-        make regular censuses on more than 25 model
ally, monitoring schemes are concentrated on the         sites (Bogolyubov & Preobrazhenskaya 2017; Fig.
breeding season. However, population estimates           1). Wintering bird censuses are made in typical,
on other life cycle stages are also important for        mainly natural landscapes, both forested and
the understanding of species’ ecology and envi-          open or mosaic.
ronment drivers of population changes. Winter            The purpose of this article is to introduce the
survival influences breeding abundance in the            PARUS program coordinated by E.S. Preobrazhen-
next season and changes in winter conditions can         skaya (Bogolyubov & Preobrazhenskaya 2017), as
be a crucial factor in determining multi-year pop-       the scheme is not necessarily familiar to many Eu-
ulation dynamics. Additionally, the state of resi-       ropean ornithologists, and to present the results
dent species’ populations can be more relevant           of 31 years of monitoring (1988 to 2019) for the
environment indicator than migrants, whose dy-           17 most common species in forest landscapes.
namics depends on their wintering ground condi-          Previously these data were analyzed only on the
tions (Fraixedas et al. 2015).                           regional level (Preobrazhenskaya 2011, 2017);
The aim of the PARUS program is the large-scale          here, we use TRIM software (Trends and Indices
monitoring of wintering land birds in European           for Monitoring data; Bogaart et al. 2018) to as-
Russia. The total area of the region is 3.3m km2,        sess general tendencies for the whole territory.
and about 1.655m km2 is covered with forest
(Shchepashchenko et al. 2015). For many species          Methods
wintering in the forest and forest-steppe zones,
this territory is the main population reservoir          The study sites were distributed across the for-
playing the crucial role in population dynamics.         est belt of European Russia (some sites located

                                                     3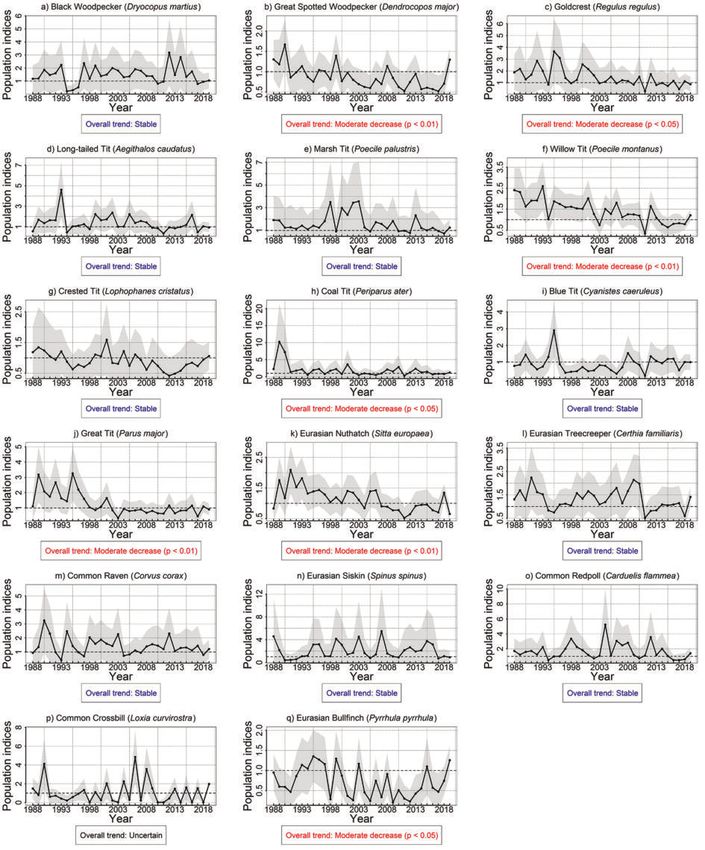
Bird Census News 2020, 33/1–2: 3–13
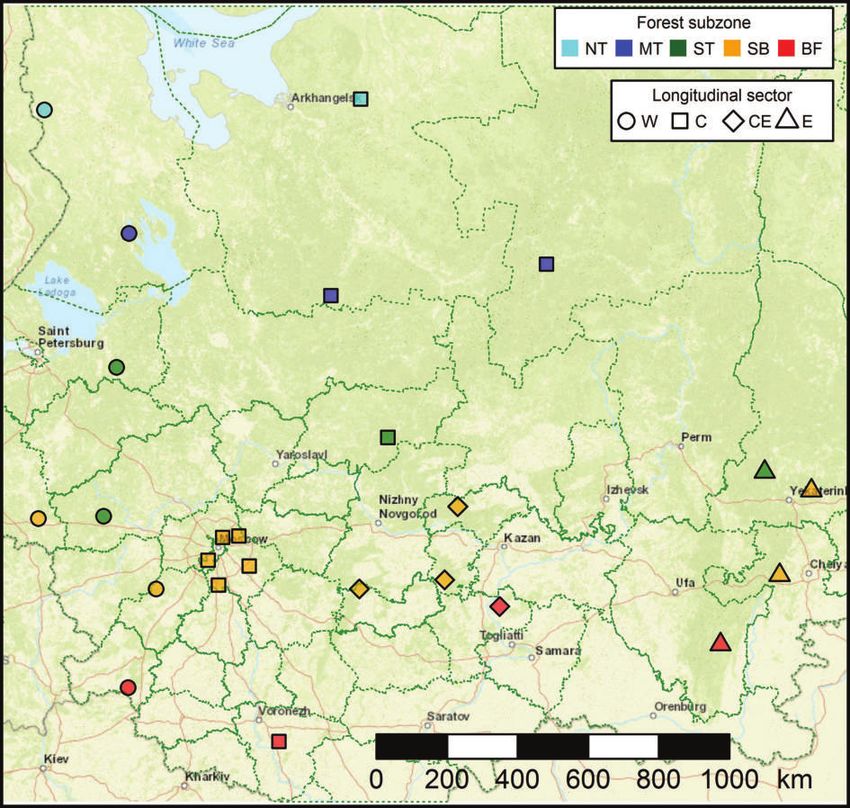
Figure 1. Locations of the PARUS program monitoring sites. Colours show forest subzone: NT — Northern taiga, MT —
middle taiga, ST — southern taiga, SB — subboreal forests, BF — broadleaf forests. Symbols indicate different longitudinal
sectors: W — Western, C — Central, CE — Central-East, E — East.
The map: © OpenStreetMap contributors; green colour — forest, yellow-green — open landscape, blue — water bodies.
in the westernmost part of South Siberia), divid- Route censuses were made in December–Feb-
ed into five subzones (the northern, middle and ruary using the method proposed by Ravkin &
southern taiga, the subboreal (mixed) forests Luk’yanova (1967). While walking a linear tran-
and the broadleaf forests including island forests sect, the observer writes down the number of
in the forest-steppe zone). Each subzone includ- birds and radial distances to individuals or flocks
ed three or four longitudinal regions: Western, in the moment of registration. These radial dis-
Central, Central-East (in two southernmost sub- tances, grouped into five intervals (300 m), are used to ob-
(combinations of forest subzone and longitudinal tain a coefficient which allows one to calculate
regions), all of which, with the exception of the the population density using the number of
most remote eastern sectors of northern and registered individuals. This coefficient, called ef-
middle taiga, contained at least one study site fective census band, is counted as the harmon-
(Fig. 1). In each site, one or several distinct forest ic mean of registration distances, separately for
habitats prevailing in the landscape were chosen birds with different perceptibility — just sitting
for study. Clear-cuts, young stands and settle- or moving in the canopy, singing, and flying. The
ments were omitted. density of each group is the product of this coef-
4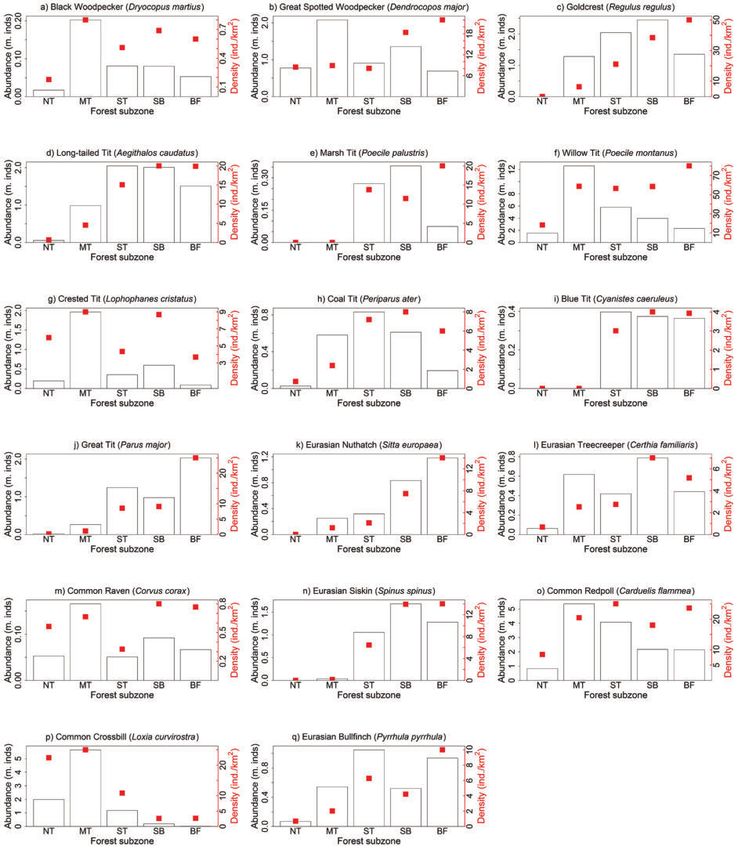
Bird Census News 2020, 33/1–2: 3–13

ficient and the number of counted birds, divided            The forest area was calculated with state forestry
by the transect length. For flying birds, the value         data (USSR forest fund 1990; Russian forest fund
was additionally divided by average flight speed,           2003), using average figures for 1988 and 2002
typically assumed as 30 km/h. The final popu-               (without young stands; Table 1). However, these
lation density is the sum of values of all groups           estimations are very rough; the between-year
(Ravkin & Luk’yanova 1967). Most observers did              differences apparently did not show real forest
not record distances by themselves, and their               dynamics, due to differences in assessment meth-
data were processed with pre-obtained standard              ods and quality. Because of this, we used constant
coefficients specific for different species, habitats       weights for all years, though actually their figures
and forest subzones (Bogolyubov & Preobrazhen-              might change over time. Six species are consid-
skaya 2017).                                                ered to be conifer forest specialists: during the
Censuses were made either on a random or on a               winter season, they predominately use coniferous
constant transect not less than 2 km long, cross-           or mixed forests, which are typical late-succession
ing more or less uniform landscape (e.g. conif-             habitats on the whole studied territory except the
erous or deciduous forest). Transects were cho-             southernmost subzone. Other species use decidu-
sen freely by fieldworkers and sometimes were               ous forests as well, sometimes along with non-for-
changed for a new one at a distance of no more              est habitats, or even prefer them (Dement’ev &
than 100 km away from the previous one. The to-             Gladkov 1954). Accordingly, for each species we
tal length of census routes in a study site per win-        selected the area of coniferous and mixed, decid-
ter season was at least 20 km for each habitat.             uous or all forest stands (Table 2).
During the multi-year survey, time series of annu-          We made estimations of species abundance in dif-
al density values were produced for every species           ferent ecological regions, having calculated their
in each study site. If several habitat types were           multiyear average density and population size
explored within a site and a species density sig-           for each forest subzone. Population size was ob-
nificantly differ among them, these habitats were           tained as the product of average density and the
treated as separate time series. Otherwise, the             area of forest habitats used in trend calculations.
density values were averaged for all habitats. If a         Definitely, these estimations were very rough and
habitat type was completely or almost avoided by            cannot be considered as complete, because not
a species, it was excluded from calculations.               the whole spectrum of habitats was explored.
We used rtrim 2.1.1 package for R 4.0.2 (R Core             Nevertheless, they allow us to reveal general pat-
Team 2020) to estimate missing data and cal-                terns of species distribution across the forest belt
culate trend parameters. The function rtrim fits            and to compare the relative importance of differ-
log-linear Poisson regression to the data and pro-          ent subzones as species wintering area.
vides annual abundance indices as well as slope             To obtain annual population indices and multi-
for a multi-year population change (Bogaart et al.          plicative trend parameters (log-growth rates),
2020). As the forest zone sectors differed strongly         we used the linear trend model with corrections
in the area of suitable forests, they made an une-          for autocorrelation and overdispersion in rtrim.
qual contribution to the total population dynam-            All years were included as changepoints and the
ics. Because of this, we used weight coefficients           stepwise procedure was used to remove non-sig-
reflecting the relative impact of time series. We           nificant ones. For population indices, the base
consider each site as equally contributing to the           period was set on 2017–2019 years, because few-
population dynamics within a sector. If a site con-         er routes were missed during this period than in
tained several time series, its weight was distrib-         the initial years. For assessment of dynamics ten-
uted among them proportionally to the area ratio            dencies, overall trends for imputed indices were
of corresponding forest types in the sector. Thus,          used.
the weight coefficients (W) for a time series was           To check the possible association between spe-
calculated in the following way:                            cies characteristics and multiyear changes, we
W = F × P / N,                                              compared multiplicative trend parameters using
where F is the forest area in a sector, N is the            weighted Mann-Whitney test (weighted_mann-
number of study sites within a sector and P is              whitney function in sjstats 0.18.0 package for R;
the proportion of habitat type corresponding to             Ludecke 2020). As trend parameters had unequal
a time series (equal to 1, if only one habitat type         preciseness, the reverses of their standard errors
was studied within a site).                                 were used as weight coefficients.

                                                        5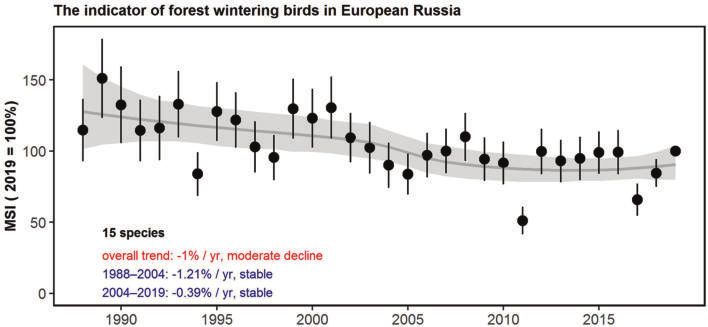
Bird Census News 2020, 33/1–2: 3–13

Table 1. Forest area (thousands of ha) for different forest subzones and longitudinal sectors of European Russia. Average
        values for 1988 and 2002 years (USSR forest fund 1990; Russian forest fund 2003). Young stands excluded. C —
        coniferous and mixed forests; D — deciduous forests; A — all forests. Acronyms for forest subzone are NT = Nor-
        thern taiga, MT = middle taiga, ST = southern taiga, SB = subboreal forests, BF = broadleaf forests, and acronyms
        for longitudinal sectors are W = Western, C = Central, CE = Central-East and E = East.

                                  Zone      Sector        C               D          A
                                             W          3649            421        4070
                                   NT         C         5817            683        6500
                                              E1        6530            710        7240
                                             W          3548            582        4130
                                   MT         C         20608           3322       23930
                                              E1        7041            1409       8450
                                             W          4491            2099       6590
                                   ST         C         4596            2744       7340
                                              E         2488            1052       3540
                                             W          1342            919        2260
                                              C         1718            1192       2910
                                   SB
                                             CE         2322            2358       4680
                                              E         2257            793        3050
                                             W           353            397         750
                                              C          552            1128       1680
                                   BF
                                             CE          477            2034       2510
                                              E         1865            2965       4830
                             1
                                 No censuses were made in these sectors

The multi-species indicator (MSI) summarizes the                   zone. Most of species analyzed were present in
general state of the forest wintering birds commu-                 all forest subzones, though some of them were
nity; it is defined as the geometric mean of species               rare or absent on the northern- or southernmost
indices (Gregory et al. 2005). We calculated it with               extremes. We divide species into two groups
the MSI tool for R (Statistics Netherlands 2017,                   based on their distribution: “northern”, with
Soldaat et al. 2017), also allowing to estimate the                highest population sizes in the middle taiga zone
significance of multi-species trend. The indicator                 (eight species), and “southern”, with highest val-
included all analyzed species except Common Red-                   ues in south taiga or further south (nine species;
poll Carduelis flammea and Common Crossbill Lox-                   Table 2).
ia curvirostra, because these species had very ir-                 In 1988–2019, seven of the 17 studied species
ruptive population dynamics due to their nomadic                   had moderately decreasing trends, populations
movements. In addition, during the non-breeding                    of nine were stable, and one species had uncer-
period redpolls widely use open habitats (De-                      tain trend (Table 2, Fig. 3). The species with the
ment’ev & Gladkov 1954), which were not covered                    strongest declines were Coal Tit Periparus ater
with the current study). The MSI algorithm does                    (Fig. 3h), Goldcrest Regulus regulus (Fig. 3c) and
not support a base period of multiple years, so                    Willow Tit Poecile montanus (Fig. 3f).
2019 was used in this case. We assess the signifi-
                                                                   In general, species associated mostly with conif-
cance of the multi-species trend for the whole the
                                                                   erous or mixed forest decline more than habitat
study period as well for its first and second parts
                                                                   generalists or species preferring deciduous stands
(16 years before/since 2004). To reveal which spe-
                                                                   (Table 2). It was confirmed both by their trend
cies contributed most to the indicator, we calcu-
                                                                   values (Fig. 4; weighted Mann-Whitney test: χ2 =
lated its correlations with all population indices
(Spearman rank correlation, cor.test function).                    2.71, df = 15, p = 0.016) and higher proportion of
                                                                   significantly decreasing trends (66.7% vs. 27.2%
                                                                   for species not associated with conifer trees). We
Results                                                            found no difference between general tendencies
Fig. 2 shows the average density and estimated                     in “northern” and “southern” species groups (χ2 =
size of studied populations for each forest sub-                   0.52, df = 15, p = 0.610).

                                                               6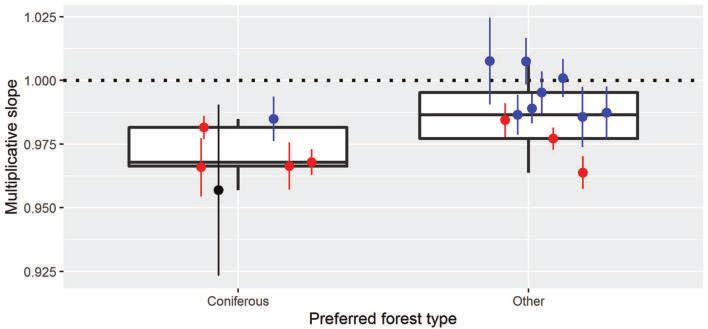
Bird Census News 2020, 33/1–2: 3–13

Figure 2. Average population density and size of 17 bird species (a–q) in preferred forest habitats for five subzones of
European Russia forest belt during 1988–2019. Bars represents estimated total population size (ind.) and red dots show
estimated mean density (ind./km2). NT is Northern taiga, MT is middle taiga, ST is southern taiga, SB is subboreal forests
and BF is broadleaf forests.

As negative tendencies, though not always sig-                   both before and after 2004 were insignificant and
nificant, were demonstrated by the most of the                   classified as stable, indicating that the most pro-
studied species, the MSI for wintering forest birds              nounced decline had place at the turn of these
showed a long-term moderate decline (Fig. 5).                    periods.
The highest correlation values for multi-species
and population indices (rs ≥ 0.70, p < 0.01) were                Discussion
for Goldcrest Regulus regulus, Willow Tit Poecile
montanus and Great Spotted Woodpecker Den-                       In comparison with similar winter bird monitor-
drocopos major (Table 2). Short-term MSI trends                  ing schemes in European countries (Heldbjerg

                                                             7
Bird Census News 2020, 33/1–2: 3–13
Table 2. Population trend parameters for common wintering birds by the PARUS monitoring program. FT — preferred for-
est type, the type of forests, whose area was used in trend calculation: A — all forests; C — coniferous and mixed
forests; D — deciduous forests. DT — distribution type: N — “northern”, S — “southern” (see Results). Abbrevia-
tions for trend classes (Bogaart et al. 2018): ↓ — moderate decrease, — stable, ? — uncertain. MAC (%) — mean
annual changes of population indices, rs — Spearman’s rank correlation coefficient between species’ population
indices and the multispecies indicator (MSI); it is given for species included in the MSI calculation. Asterisks show
parameters’ statistical significance: * — p < 0.05, ** — p < 0.01.
Multiplicative
Common name Latin name FT DT Trend class MAC (%) rs
slope (±SE)
Black Woodpecker Dryocopus martius A N 1.008 ± 0.009 — +0.75 0,32
Great Spotted Woodpecker Dendrocopos major C N 0.982 ± 0.005 ↓** –1.85 0,70**
Goldcrest Regulus regulus C S 0.966 ± 0.009 ↓* –3.36 0,73**
Long–tailed Tit Aegithalos caudatus A S 0.987 ± 0.008 — –1.35 0,60**
Marsh Tit Poecile palustris D S 0.986 ± 0.012 — –1.43 0,38*
Willow Tit Poecile montanus C N 0.968 ± 0.005 ↓** –3.21 0,71**
Crested Tit Lophophanes cristatus C N 0.985 ± 0.009 — –1.51 0,49**
Coal Tit Periparus ater C S 0.966 ± 0.011 ↓* –3.41 0,58**
Blue Tit Cyanistes caeruleus A S 1.001 ± 0.007 — +0.09 0,05
Great Tit Parus major A N 0.964 ± 0.006 ↓** –3.62 0,65**
Eurasian Nuthatch Sitta europaea A S 0.977 ± 0.004 ↓** –2.29 0,51**
Eurasian Treecreeper Certhia familiaris A S 0.989 ± 0.006 — –1.10 0,34
Common Raven Corvus corax A N 0.995 ± 0.008 — –0.47 0,13
Eurasian Siskin Spinus spinus A S 1.008 ± 0.017 — +0.76 0,18
Common Redpoll1 Carduelis flammea A N 0.987 ± 0.010 — –1.27
Common Crossbill Loxia curvirostra C N 0.957 ± 0.034 ? –4.31
Eurasian Bullfinch Pyrrhula pyrrhula A S 0.984 ± 0.007 ↓* –1.56 0,45**
1
The data include registrations of Arctic Redpoll (С. hornemanni) which were much less abundant and usually impossible to
identify.
et al. 2016), the monitoring network of PARUS predominately forest-dwelling species such gaps
program has much wider spatial coverage (large in coverage are unlikely to distort the observed
part of European Russia) but limited habitat rep- tendencies, which generally were driven by the
resentativeness and a lower density of survey most preferred and widespread habitat types.
routes. This means that only well-pronounced Another source of bias was that the area of forest
changes with similar vector in the most part of was assumed to be stable in our trend calcula-
the population can be detected, and the assess- tions. Because of this, we were only able to es-
ments may be biased if the trends were different timate bird population trends in relation to their
in unexplored regions or habitats. The latter was density dynamics, without including effects of
particularly important for species often using changes in forest area. The preciseness of esti-
human settlements (Great Tit Parus major, Blue mations of forest area change was also question-
Tit Cyanistes caeruleus, and Eurasian Bullfinch able, as we lack detailed forest statistics data.
Pyrrhula pyrrhula) or non-forest landscapes (Sis- In addition, we are aware that our monitoring
kin Spinus spinus, Eurasian Bullfinch, Common network is very sparse for such a large region,
Redpoll; Dement’ev & Gladkov 1954). For ex- so it provides very rough estimations. However,
ample, winter density of the Great and the Blue it is hard to explain simultaneous tendencies in
Tit in human settlements is usually much higher different parts of the region with specific local
than in natural forests, so they may contribute conditions only; such results suggest some wide-
substantially to the total abundance — despite scale factors have played a role. Most of the cen-
the fact that human population density is low in sus sites were situated on areas with low human
most of the studied region. Because of this, we impact, so population dynamics likely reflected
cannot be sure if the observed tendencies are large-scale changes, not local ones. Here, we
relevant for the whole populations. However, for make some general hypotheses about them.
8Bird Census News 2020, 33/1–2: 3–13
Figure 3. Winter population trends of 17 common wintering species (a–q) based on PARUS monitoring data in the Europe-
an Russia forest zone. Grey area show 95% confidence intervals. Footnotes show trend classes (Bogaart et al. 2018) and
significance.
The forest wintering species showed a general de- dynamics. However, the decline of conifer forest
cline, particularly notable in early 2000s (Fig. 5), specialists (see Table 2) was the most common
and none of species had significant positive ten- and pronounced change in the bird community.
dencies (Table 2). The group of negative trends The members of this group showed the lowest
unites species with diverse ecology features such growth rates and had the largest impact on the
as habitat and feeding specialization, so there total decline of the MSI. Among them were spe-
was probably more than one factor causing their cies with different latitudinal distribution, e.g.
9Bird Census News 2020, 33/1–2: 3–13
Figure 4. Population trend slope in two species groups of forest type preference during the winter (coniferous or other;
see Table 2). “Boxes” represent group medians (central bar) and quartiles, weighed with the reversed standard errors
of slope parameters; “whiskers” show total ranges. Species parameters are shown with dots, with bars representing its
standard errors; dot colors correspond to trend class (red — moderate decrease, blue — stable, black — uncertain; see
Table 2).
Figure 5. Multispecies indicator for 15 common wintering species in the forest zone of European Russia. Error bars show
95% confidence interval for year figures. The grey line and area show smoothed trend with its 95% confidence interval.
Great Spotted Woodpecker most numerous in habitats (e.g. for Eurasian Bullfinch) or preferred
the middle taiga zone (Fig 2b) and Goldcrest with habitats in other regions which can be sources of
the largest wintering population in subboreal for- winter migrations to European Russia (e.g. Eur-
ests (Fig. 2c). These species represent “northern” asian Nuthatch Sitta europaea, depending on
and “southern” groups (Table 2) and we found no cedar stands in Siberia; Dement’ev & Gladkov
difference between trend parameters for them. 1954).
This suggests that habitat specialization, and not Climate change could also play a role, possibly
regional specificity, was the prevailing factor in- non-uniformly in different parts of the region.
fluenced on the species dynamics. An analysis for Northwest Europe showed that
It seems likely that the specialists group suffered northern areas are generally more prosperous in
from decreasing of area and quality of coniferous respect to wintering bird numbers than southern
stands. The main reasons for this are assumed ones: the latter are more negatively affected by
to be intense logging (Gromtsev 2008), coupled climate change (Lehikoinen et al. 2016). In severe
with bark beetle outbreaks (Komarova 2015) and climate conditions, wintering species can bene-
dieback of spruce stands in some regions. This fit from the rise of winter temperatures (Bourski
has resulted in the changing of old coniferous 2009; Lehikoinen et al. 2016). However, in mild-
forests to deciduous, mainly birch stands (Gromt- er climates such increase can lead to adverse ef-
sev 2008; Maslov et al. 2014). Even for species fects, e.g. winter thaws and subsequent frosting
who do not predominately use coniferous forests of foraging substrate. This can make access to
during winter, such changes could affect breeding prey items difficult for birds searching for small
10Bird Census News 2020, 33/1–2: 3–13
Table 3. Trend classes for common wintering land bird species. Finland — Finnish mid-winter census scheme in 1957–2012
(Fraixedas et al. 2015), Estonia — Estonian mid-winter census scheme in 1987–2015 (Elts 2016), ER — European
Russia (1988–2019, our results). Trend classes are abbreviated as follows: ↑ — moderate increase, ↑↑ — strong
increase, ↓ — moderate decrease, — stable, ? — uncertain. Tendencies with the same sign as in our region are
highlighted with bold, and with different signs with italic font. Cells are empty if the species’ trend is not discussed
in corresponding publication.
Common name Latin name Finland Estonia ER
Black Woodpecker Dryocopus martius ↑ ? –
Great Spotted Woodpecker Dendrocopos major ↑ ↑ ↓
Goldcrest Regulus regulus ↓ – ↓
Long-tailed Tit Aegithalos caudatus ↑ ? –
Marsh Tit Poecile palustris ↓ –
Willow Tit Poecile montanus ↓ ↓ ↓
Crested Tit Lophophanes cristatus ↓ – –
Coal Tit Periparus ater ? ? ↓
Blue Tit Cyanistes caeruleus ↑↑ – –
Great Tit Parus major ↑ – ↓
Eurasian Nuthatch Sitta europaea ↑ ↓
Eurasian Treecreeper Certhia familiaris – – –
Common Raven Corvus corax ↑ ↑ –
Eurasian Siskin Carduelis spinus ↑ – –
Common Redpoll Carduelis flammea – –
Common Crossbill Loxia curvirostra ↓ ?
Eurasian Bullfinch Pyrrhula pyrrhula ↓ ↓ ↓
invertebrates on tree bark, such as Long-tailed al. 2015a) and breeding populations (Fraixedas et
Tit Aegithalos caudatus (Fig. 3d), Treecreeper al. 2015b); for wintering populations, these neg-
Certhia familiaris (Fig. 3l) and all Paridae species ative tendencies have been exacerbated since
(Fig. 3e–j). Unusually high summer temperatures end of 1990s. The detailed analysis showed that
could also negatively influence invertebrate the effect of climate change was relatively low
abundance and winter foraging resources; a in comparison to the intensification of forestry,
prime example was extremely hot weather in Eu- resulted in decreasing of old-growth forest area.
ropean Russia in summer 2010 (Mokhov 2011). Both timing and direction of changes are similar
Subsequent depression of many passerine bird to our results, and we assume its main reason
species (Preobrazhenskaya 2011; Zablotskaya was the same as well.
2015) were well reflected with our data on win- However, three species (Great Spotted Wood-
tering populations (Fig. 5). pecker, Eurasian Nuthatch and Great Tit) had op-
Given the constraints discussed above, we can posite trend signs in different countries; it may be
make some comparisons with winter monitoring a question for further regional analysis whether
projects in neighbouring countries. The closest the tendencies in adjacent parts of our study re-
ones to our territory and most similar in their gion also differed from general ones. An exam-
natural conditions are Finland (Fraixedas et al. ple of such analysis for Karelia (Yakovleva 2017)
2015a) and Estonia (Elts 2016). In these countries, shows that this region, as well as Finland, had
several species have tendencies of multi-year dy- more positive tendencies that the European Rus-
namics coinciding with ours (Table 3): there are sia in general (e.g. for Great Spotted Woodpecker,
six such species in Estonia and five in Finland, which showed a positive trend). Unfortunately,
with two of them (Willow Tit and Eurasian Bull- such studies are still scarce for our territory, and
finch) decreasing in all countries. In Finland, the we need more data to unweave the importance
decline of forest species populations, especially of climate change and forestry effects on nest
associated with late-succession coniferous for- habitats quality, reproduction success, wintering
ests, was shown both for wintering (Fraixedas et conditions and migration patterns.
11Bird Census News 2020, 33/1–2: 3–13
Acknowledgements
We wish to thank all volunteers involved in the PARUS monitoring program, who provide high-quality
data for the current study.
References
Bogaart, P., Loo, M. van der & Pannekoek, J. 2020 [Online]. rtrim: Trends and Indices for Monitoring Data. R
package version 2.0.6. Available https://CRAN.R-project.org/package=rtrim [02.10.20].
Bogolyubov, A.S. & Preobrazhenskaya, E.S. 2017. 30 years of wintering birds monitoring programs in Russia and
neighboring regions. Land birds population dynamics. 30 years of wintering birds monitoring pro-
grams in Russia and neighboring regions. — Proceedings of All-Russian conference, ZBS MSU, 17–21
March 2017. IEE RAS, Moscow: KMK Scientific Press Ltd.: 54–64. [Боголюбов А.С., Преображенская
Е.С. 2017. 30 лет программам мониторинга численности зимующих птиц России и сопредель-
ных регионов. Динамика численности птиц в наземных ландшафтах. 30-летие программ мони-
торинга зимующих птиц России и сопредельных регионов. Материалы Всероссийской научной
конференции, ЗБС МГУ, 17–21 Марта 2017 г. ИПЭЭ РАН, М.: Товарищество научных изданий
КМК, 54–64].
Bourski, O.V. 2009. Influence of long-distant spatial connections on passerine birds population dynamics.
— Doklady Akademii Nauk, 424 (3): 422–425. [Бурский О.В. 2009. Влияние дальних простран-
ственных связей на динамику популяций воробьиных птиц. Доклады Академии Наук, 424 (3):
422–425].
Dement’ev, G.P. & Gladkov, N.A. (eds.) 1954. Birds of Soviet Union, Moscow: Sovetskaya nauka, 792 p. [Птицы
Советского Союза, 1954. Дементьев Г.П., Гладков Н.А. (ред.). М.: Советская наука, 792 с.]
Elts, J. 2016. A review of 29 years of mainland winter bird counts in Estonia. — Technical report. Estonian Or-
nithological Society, Tartu. 22 p.
Fraixedas, S., Lehikoinen, A. & Lindén, A. 2015a. Impacts of climate and land-use change on wintering bird pop-
ulations in Finland. — Journal of Avian Biology, 46 (1): 63–72.
Fraixedas, S., Lindén, A. & Lehikoinen, A., 2015b. Population trends of common breeding forest birds in south-
ern Finland are consistent with trends in forest management and climate change. — Ornis Fennica,
46 (1): 63–72.
Gregory, R.D., Strien, A. van, Vorisek, P., Gmelig Meyling, A.W., Noble, D.G., Foppen, R.P.B. & Gibbons, D.W.
2005. Developing indicators for European birds. — Philosophical Transactions of the Royal Society B:
Biological Sciences, 360 (1454): 269–288.
Gromtsev, A.N. 2008. The foundations of landscape ecology of European Russia taiga forests. KRC RAS, Petro-
zavodsk. P. 130–135. [Громцев А.Н. 2008. Основы ландшафтной экологии европейских таежных
лесов России. КарНЦ РАН, Петрозаводск. C. 130–135].
Heldbjerg, H., Klvaňová, A., Anselin, A. 2015. The status of winter land bird monitoring in Europe. — Bird Census
News, 29 (1–2): 3–8.
Komarova, I.A. 2015. Mass reproduction of the Bark beetle in 2010–2014 and protection of spruce stands. —
Lesokhozyaystvennaya informatciya 3: 22–34. [Комарова И.А. 2015. Массовое размножение коро-
еда-типографа в 2010–2014 гг. и защита еловых насаждений. Лесохозяйственная информация,
3: 22–34].
Koskimies, P. 1989. Birds as a tool in environmental monitoring. — Annales Zoologici Fennici, 26: 153–166.
Lehikoinen, A., Foppen, R.P.B., Heldbjerg, H., Lindström, Å., van Manen, W., Piirainen, S., van Turnhout, C.A.M.,
& Butchart, S.H.M. (2016). Large-scale climatic drivers of regional winter bird population trends. —
Diversity and Distributions, 22: 1163–1173.
Ludecke, D. 2020 [Online]. sjstats: Statistical Functions for Regression Models (Version 0.18.0) [Online].
Available https://CRAN.R-project.org/package=sjstats [02.10.20].
Mokhov, I.I. 2011. Specific features of the 2010 summer heat formation in the European territory of Russia in
the context of general climate changes and climate anomalies. Izvestiya AN, — Atmospheric and
Oceanic Physics, 47 (6): 653–660.
Preobrazhenskaya, E.S. 2011. Wintering birds of East-European plane and Ural: unprecedented number depres-
sion in winter 2010/11. — Mir ptits, 39: 13–17. [Преображенская Е.С. 2011. Птицы, зимующие
в лесах Восточно-Европейской равнины и Урала: небывалая депрессия численности в сезоне
2010/11 г. Мир Птиц 39: 13–17].
Preobrazhenskaya, E.S. 2017. Population dynamics of some common wintering birds in European Russia forests
from 1980-s to 2010-s. Land birds population dynamics. 30 years of wintering birds monitoring pro-
12Bird Census News 2020, 33/1–2: 3–13
grams in Russia and neighboring regions. — Proceedings of All-Russian conference, ZBS MSU, 17–21
March 2017. IEE RAS, Moscow: KMK Scientific Press Ltd.: 55–65. [Преображенская Е.С. 2017. Дина-
мика численности некоторых массовых зимующих птиц в лесах Европейской России с 1980-х по
2010-е годы. Динамика Численности Птиц в Наземных Ландшафтах. 30-Летие Программ Мони-
торинга Зимующих Птиц России и Сопредельных Регионов. Материалы Всероссийской Научной
Конференции, ЗБС МГУ, 17–21 Марта 2017 г. М.: ИПЭЭ РАН. С. 55–65].
R Core Team 2020 [Online]. R: A language and environment for statistical computing. R Foundation for Statistical
Computing, Vienna, Austria. Available https://www.R-project.org/ [02.10.20].
Ravkin, Yu.S. & Luk’yaniva, I.V., 1967. Geography of vertebrates in South taiga of West Siberia. Novosibirsk: Nau-
ka. 183 p. [Равкин Ю.С., Лукьянова И.В. 1967. География позвоночных южной тайги Западной
Сибири. Новосибирск: Наука. 183 c.].
Russian forest fund (by the census of the state forest fund on accounting by January 1, 2003). — A bulletin,
2003. Moscow: ARRISMF. 690 p. [Лесной фонд России (по данным государственного учета лесно-
го фонда по состоянию на 1 января 2003 г.). Справочник, 2003. М.: ВНИИЛМ. 690 с.].
Shchepashchenko, D.G., Shvidenko, A.Z., Lesiv, M.Yu., Ontikov, P.V., Shchepashchenko, M.V. & Kraxner, F. 2015.
The forest area in Russia and its dynamics based on a synthesis of remote sensing products. — Leso-
vedenie, 3: 163–171. [Щепащенко Д.Г., Швиденко А.З., Лесив М.Ю., Онтиков П.В., Щепащенко
М.В., Кракснер Ф. 2015. Площадь лесов России и ее динамика на основе синтеза продуктов
дистанционного зондирования. Лесоведение, 3: 163–171].
Soldaat, L.L., Pannekoek, J., Verweij, R.J.T., van Turnhout, C.A.M. & van Strien, A.J., 2017. A Monte Carlo method
to account for sampling error in multi-species indicators. Ecological Indicators, 81: 340–347.
Statistics Netherlands, 2017. MSI-tool [Online]. Stat. Neth. Available https://www.cbs.nl/en-gb/society/na-
ture-and-environment/indices-and-trends-trim-/msi-tool [02.10.20].
USSR forest fund (on accounting by January 1, 1988). A statistical bulletin, 1990. All-Unioin Research and Infor-
mational Center of Forest Resources, Moscow. 1005 p. [Лесной фонд СССР (по учету на 01 января
1988г.). Статистический сборник., 1990. ВНИИЦлесресурс, М. 1005 c.].
Yakovleva, M.V. 2017. Population dynamic of dendrophilic birds in «Kivach» natural reserve under climate
warming. Land birds population dynamics. 30 years of wintering birds monitoring programs in Russia
and neighboring regions. — Proceedings of All-Russian conference, ZBS MSU, 17–21 March 2017.
IEE RAS, Moscow: KMK Scientific Press Ltd. P. 47–54. [Яковлева М.В. 2017. Тенденции численности
дендрофильных видов птиц в заповеднике “Кивач” в условиях потепления климата: Динамика
Численности Птиц в Наземных Ландшафтах. 30-летие Программ Мониторинга Зимующих Птиц
России и Сопредельных Регионов. Материалы Всероссийской Научной Конференции, ЗБС МГУ,
17–21 Марта 2017 г. М.: ИПЭЭ РАН. С. 47–54].
Zablotskaya, M.M. 2015. Tendencies of recent years’ changes in bird population of forest habitats of Prioks-
ko-Terrasny natural reserve. — XIV International Ornithological conference of Northern Eurasia. I.
Theses. Almaty: Menzbier Ornitological Society. P. 196–197. [Заблоцкая М.М. 2015. Тенденции из-
менений последних лет в населении птиц лесных биоценозов Приокско-Террасного заповедни-
ка. XIV Международная Орнитологическая Конференция Северной Евразии. I. Тезисы. Алматы:
Мензбировское орнитологическое общество. С. 196–197].
Received: 2 December 2019
Accepted: 27 October 2020
13You can also read