Effect of Savanna windrow wood burning on the spatial variability of soil properties1
←
→
Page content transcription
If your browser does not render page correctly, please read the page content below
e-ISSN 1983-4063 - www.agro.ufg.br/pat - Pesq. Agropec. Trop., Goiânia, v. 51, e66853, 2021
Special Supplement: Cerrado [Brazilian Savanna]

                        Effect of Savanna windrow wood burning
                        on the spatial variability of soil properties1
                 Diogo Neia Eberhardt2, Robélio Leandro Marchão3, Pedro Rodolfo Siqueira Vendrame4,
                        Marc Corbeels5, Osvaldo Guedes Filho6, Eric Scopel5, Thierry Becquer7

                        ABSTRACT                                                                RESUMO
                                                                        Efeito da queima de madeira proveniente de desmatamento
                                                                        do Cerrado na variabilidade espacial das propriedades do solo
         Tropical Savannas cover an area of approximately
1.9 billion hectares around the word and are subject to regular                 As Savanas tropicais cobrem uma área de aproximadamente
fires every 1 to 4 years. This study aimed to evaluate the influence    1,9 bilhões de hectares ao redor do mundo e estão sujeitas a
of burning windrow wood from Cerrado (Brazilian Savanna)                incêndios regulares a cada 1-4 anos. Objetivou-se avaliar a
deforestation on the spatial variability of soil chemical properties,   influência da queima de madeira proveniente do desmatamento
in the field. The data were analysed by using geostatistical            do Cerrado na variabilidade espacial das propriedades químicas
methods. The semivariograms for pH(H2O), pH(CaCl2), Ca, Mg              do solo, em campo. Os dados foram analisados utilizando-se
and K were calculated according to spherical models, whereas the        métodos geoestatísticos. Os semivariogramas para pH(H2O),
phosphorus showed a nugget effect. The cross semi-variograms            pH(CaCl2), Ca, Mg e K foram calculados de acordo com modelos
showed correlations between pH(H2O) and pH(CaCl2) with                  esféricos, enquanto o fósforo apresentou efeito pepita puro. Os
other variables with spatial dependence (exchangeable Ca                semivariogramas cruzados mostraram correlações entre pH(H2O)
and Mg and available K). The spatial variability maps for the           e pH(CaCl2) com outras variáveis com dependência espacial (Ca
pH(H2O), pH(CaCl2), Ca, Mg and K concentrations also showed             e Mg trocáveis e K disponível). Os mapas de variabilidade das
similar patterns of spatial variability, indicating that burning        concentrações de pH(H2O), pH(CaCl2), Ca, Mg e K também
the vegetation after deforestation caused a well-defined spatial        apresentaram padrões semelhantes de variabilidade espacial,
arrangement. Even after 20 years of use with agriculture, the           indicando que a queima da vegetação após o desmatamento
spatial distribution of pH(H2O), pH(CaCl2), Ca, Mg and available        causou arranjo espacial bem definido. Mesmo após 20 anos de uso
K was affected by the wood windrow burning that took place              com agricultura, a distribuição espacial de pH(H2O), pH(CaCl2),
during the initial deforestation.                                       Ca, Mg e K disponível foi afetada pela queima da madeira que
                                                                        ocorreu após enleiramento, durante o desmatamento inicial.

KEY WORDS: Wildfire, soil digital mapping, soil fertility.              PALAVRAS-CHAVE: Incêndios florestais, mapeamento digital
                                                                        do solo, fertilidade do solo.

                     INTRODUCTION                                       2 million km 2 (Beuchle et al. 2015). Its native
                                                                        vegetation is composed by understory grass, with a
      Tropical Savannas cover an area of around                         variable cover of shrubs and trees. Ferralsols (FAO
20 million km2 around the world (Young & Solbrig                        2014) are the most common soils, covering about
1993). Cerrado (Brazilian Savanna) is a tropical                        45 % of the Cerrado area.
Savanna in Central Brazil, which encompasses around                           In the Cerrado biome, fire disturbance (lit
23 % of the national territory, or approximately                        by man or caused by lightning) are common, and

      1
        Received: Dec. 01, 2020. Accepted: Apr. 22, 2021. Published: June 28, 2021. DOI: 10.1590/1983-40632021v5166853.
2
  Companhia Nacional de Abastecimento, Cuiabá, MT, Brasil. E-mail/ORCID: eberhardt.diogo@gmail.com/0000-0003-2159-7099.
                     3
                       Empresa Brasileira de Pesquisa Agropecuária (Embrapa Cerrados), Planaltina, DF, Brasil.
                               E-mail/ORCID: robelio.marchao@embrapa.br/0000-0003-1922-7929.
                     4
                       Universidade Estadual de Londrina, Departamento de Geociências, Londrina, PR, Brasil.
                                     E-mail/ORCID: vendrame@uel.br/0000-0002-5952-5704.
                        5
                          CIRAD - La Recherche Agronomique pour le Développement, Montpellier, France.
             E-mail/ORCID: marc.corbeels@cirad.fr/0000-0002-8084-9287; eric.scopel@cirad.fr/0000-0003-2938-6587.
6
  Universidade Federal do Paraná, Jandaia do Sul, PR, Brasil. E-mail/ORCID: osvaldoguedes@yahoo.com.br/0000-0001-8550-8505.
7
  Institut de Recherche pour le Développement, Montpellier, France. E-mail/ORCID: thierry.becquer@ird.fr/0000-0001-5846-5810.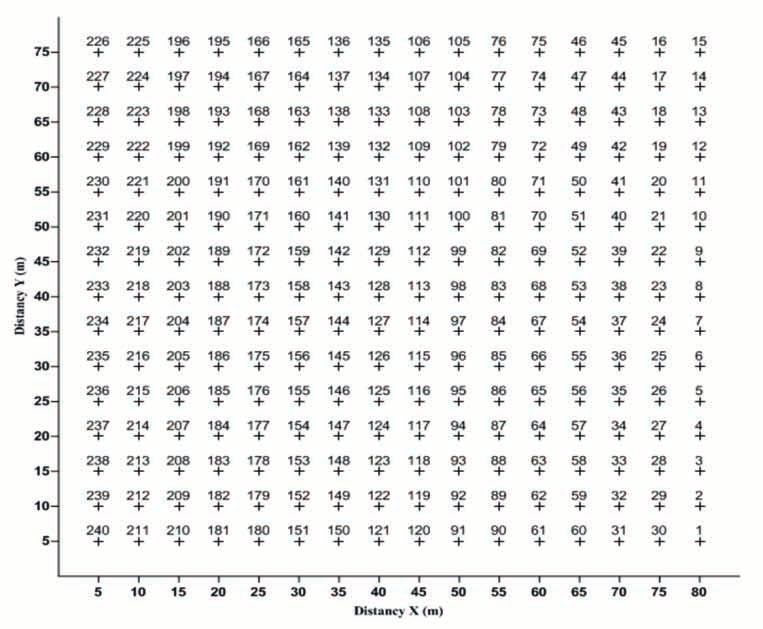
2                                             D. N. Eberhardt et al. (2021)

have occurred for thousands of years (Nardoto &               Ca, Mg and K with the first rain after fires (Nardoto &
Bustamante 2003), every 1 to 4 years, during the              Bustamante 2003, Pivello et al. 2010).
dry season, with the highest frequency in the humid                  In the Cerrado, deforestation to clear the land
Savannas (Pivello et al. 2010). Fires triggered by            for agriculture activities was traditionally done by
lightning occur naturally in the dry season and               tracked tractors pulling a clearing chain, and the
are recognized for their ecological importance,               vegetation was concentrated in windrows along
influencing nutrient cycling and affecting the                the field before being burned. As a result, in much
vegetation dynamics, particularly the grass/woody             of the deforested area, the machinery and burning
biomass ratio (Nardoto et al. 2006). However, the             considerably altered the soil surface layer (Chazdon
increased population pressures and land use changes           2003, Lintemani et al. 2019).
have promoted both the deforestation intensity and                   While many studies on the effect of Savanna
the frequency and severity of anthropogenic fires             fires have been conducted, especially in connection
(Lambin et al. 2003). The historic occupation of              with the ecology of these areas, few studies have
the Cerrado region began in the 1920s by the coffee           examined the effects of fire on agricultural soils,
industry and was later (1930-1945) perpetuated                especially on soil nutrients (Lal & Ghuman 1989,
by government policies that stimulate grants for              Fraser & Scott 2011, Tavares Filho et al. 2011).
providing technical assistance to farmers (Goedert            Although the effects of spatial variability of soil
et al. 2008).                                                 properties on crop production are a long-standing
        Between 1970 and 1985, the intensification            problem, this is still the case, especially for the
of deforestation in the Cerrado region culminated             practice of precision agriculture (Frogbrook et al.
with the incorporation of the Cerrado area into               2002, Negreiros Neto et al. 2014). Geostatistics
the Brazilian agricultural production plan, due to            (e.g., semi-variograms and spatial interpolation)
the arrival of new technologies, such as phosphate            has been used as an important and efficient tool to
fertilizer and lime to correct both nutrient deficiency       characterize spatial variability of soil properties. It is
and acidity; rhizobium-based nitrogen fixation;               also a promising way to study the heterogeneity of
development of crop varieties; heavy use of                   soil properties after burning and land clearing.
herbicides and pesticides; and modern machinery                      This study aimed to assess the biased effect
(Camargo et al. 2017). Studies on the effects of              related to another pattern of soil nutrient distribution
fire on Cerrado soil properties are scarce (Silva &           related to Savanna windrow wood burning on the
Batalha 2008, Pivello et al. 2010, Resende et al.             spatial variability of soil chemical properties.
2011) and more studies are needed, because this
biome is nowadays the most important area for                             MATERIAL AND METHODS
grain production in Brazil, as well as one of the most
endangered ecosystems in South America, with high                    A field experiment was carried out in the
levels of plant endemism (Klink & Machado 2005).              Cerrado (Brazilian Savanna) biome, as part of a
        Biomass and plant functional traits affect            research project on the impact of conservation
the biogeochemical cycles of tropical ecosystems              agricultural practices on soil fertility and crop yields,
(Carvalho et al. 2014). The transformation of                 in Unaí (16º32’26”S, 46º50’44” W and altitude of
elements during combustion may affect the cycling             600 m), north-western of the Minas Gerais state,
and availability of nutrients for several years               Brazil (Figure 1).
following the disturbance. The combustion of organic                 The region is characterized by a typical sub-
matter releases significant quantities of nutrients           humid tropical climate of the Cerrado [tropical wet
to the atmosphere as gaseous compounds. Other                 and dry “Aw” (or Savanna climate), according to the
nutrients are deposited on the soil as ash and may            Köppen classification]. The average annual rainfall
prove valuable for plant regrowth (Nardoto et al.             is 1,200-1,400 mm and occurs between October
2006). The mineral ash may also increase the soil pH          and April, while the dry season, lasting from five to
due to the release of basic ions (Noble et al. 1996),         six months, coincides with the coolest months. The
and consequently change the microbial activity,               average annual temperature is 24.4 ºC. The soils in
which is intimately connected with decomposition              the area are classified as Latossolo Vermelho (Santos
and nutrient turnover, owing to the accumulation of P,        et al. 2013) and Oxisols (USA 2014) or Ferralsols

               e-ISSN 1983-4063 - www.agro.ufg.br/pat - Pesq. Agropec. Trop., Goiânia, v. 51, e66853, 2021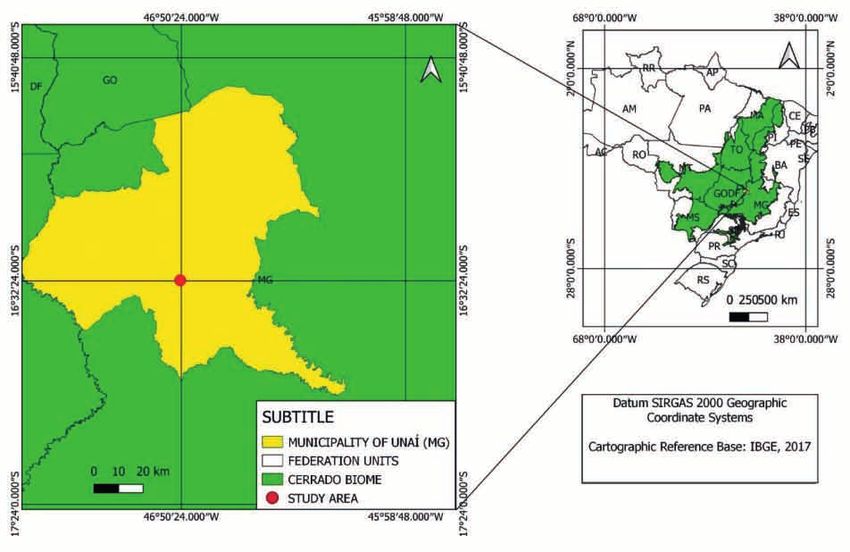
Effect of Savanna windrow wood burning on the spatial variability of soil properties                                                       3

Figure 1. Cerrado region in Central Brazil (in green) and the location of Unaí, Minas Gerais state.

(FAO 2014). The general soil chemical and physical                               rice for three years, bean for one year, soybean for
properties are present in Table 1.                                               two years, sorghum for one year, and maize for 11
       The area was deforested 14 years before                                   years (Figure 2).
the establishment of the experiment, in 1991. The                                       During the last five years before the soil
vegetation, classified as “Cerradão”, was cleared                                sampling, maize was cultivated in association with
by caterpillar tractors pulling a chain, and the                                 cover crops [Urochloa ruziziensis (ruzigrass) - a grass
vegetation was concentrated in windrows before                                   species - or Cajanus cajan - a leguminous species]
being burned. The subsequent crops were upland                                   and tillage systems (conventional or no-tillage).

Table 1. Soil chemical and physical properties in the experimental area (0-0.2 m).

     pH           MO           Ca            Mg             Al        H + Al              K             S         P           Clay             Silt     Sand
    CaCl2         %         ___________________________
                                                          cmolc dm-³ ___________________________          mg dm-³ ________
                                                                                                   ________                  _____________
                                                                                                                                             g kg1 _____________
     4.5          2.5          1.3           1.3           0.05          5.4            0.56           1.2       0.7           730            160        110

Figure 2. Schematic representation of the experimental area after deforestation until the soil sampling in 2010.

                 e-ISSN 1983-4063 - www.agro.ufg.br/pat - Pesq. Agropec. Trop., Goiânia, v. 51, e66853, 2021
4 D. N. Eberhardt et al. (2021)
During this period, the experiment received the same 5 % of significance. The coefficient of variation
amount of fertilizers distributed in the rows of cash (CV) was classified based on Warrick & Nielsen
crops, i.e., 230, 118 and 104 kg ha-1 of N, P and K, (1980) (low CV: < 12 %; average: 12 % < CV <
respectively. 60 %; high: > 60 %). The data were analysed by
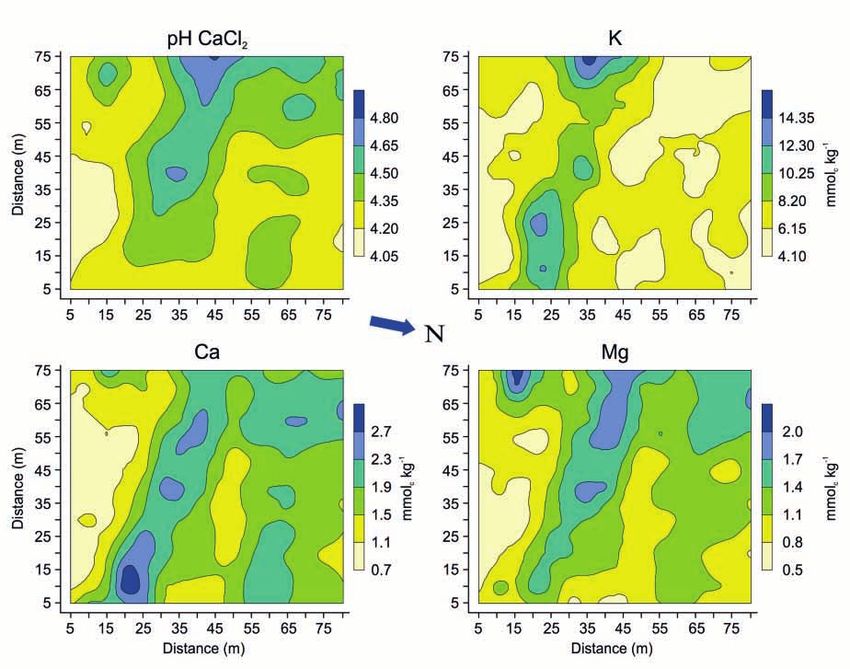
The entire experimental area measured 80 x geostatistical methods using the Geostat software,
75 m. Soil samples were collected in March 2010, on a and the semi-variogram calculation was based on
5 x 5 m grid, from the 0-0.2 m depth, resulting in a total hypothetical intrinsic stationary assumptions, to
of 240 samples (Figure 3). A 0-0.2 m sampling was study the spatial variability of soil properties (Vieira
chosen to avoid an effect related to soil stratification et al. 2002). The spatial correlation of samples was
close to the surface in the no-tillage system (Crozier analysed by the experimental semi-variograms,
et al. 1999). The soil analysis was carried out with to which the mathematical models were fitted.
air-dried < 2 mm sieved material (Claessen 1997). This is necessary for determining the structure of
The soil pH was measured in distilled water pH(H2O) the spatial variation of the variables studied and
and 0.01 M CaCl2 [pH(CaCl2)], using a 1:2.5 (w:v) to obtain input parameters for ordinary kriging
soil:solution ratio. Exchangeable calcium (Ca2+) and interpolation. The spherical mathematical model was
magnesium (Mg2+) were extracted with 1 M KCl. applied to spatially dependent semi-variograms. It
Available potassium (K+) and phosphorus (P) were generates values that increase for the distances (h)
extracted with a Mehlich-1 solution (0.0125 M H2SO4 until reaching a maximum, after which it stabilizes
and 0.050 M HCl). at a level that corresponds to the distance limit of
A descriptive analysis was done using the spatial dependence, the range (R). Measurements
BioEstat 5.0 software. Skewness and kurtosis indices over longer distances than the range are randomly
were calculated to check the data dispersion and distributed and are thus independent from each other.
central tendency. The assumption of data normality The degree of spatial dependence (DSD), which
was tested using the Kolmogorov-Smirnov test at measures the degree of the nugget variance (C0)
Distance Y (m)
15 m
5m
Tree
Distance Y (m)
Figure 3. Site map with the location of the sampling grid and experimental area.
e-ISSN 1983-4063 - www.agro.ufg.br/pat - Pesq. Agropec. Trop., Goiânia, v. 51, e66853, 2021Effect of Savanna windrow wood burning on the spatial variability of soil properties 5
relative to the level (C0 + C1) (Cambardella et al. distributed, as shown by the skewness and kurtosis
1994), was calculated using the equation DSD = (C0/ coefficient values and the Kolmogorov-Smirnov test
C0 + C1) x 100, to express the spatial dependence of (Table 2).
a variable. According to Cambardella et al. (1994), Table 3 shows the best fitted theoretical models
the DSD can be classified as strong (DSD ≤ 25 %), and the estimated parameters of the experimental
moderate (25 % < DSD ≤ 75 %) and weak (DSD > semi-variograms for the soil chemical properties.
75 %) spatial dependence. Of the models tested, the spherical model was the
After the spatial autocorrelation among best for predicting the spatial variability, except for
the samples demonstrated by the semi-variogram available P, which exhibited a nugget effect. The
analysis, maps were generated using ordinary kriging semi-variograms were calculated according to the
as interpolator (Vieira 2000). Contour maps were spherical model for pH(H2O), pH(CaCl2), K, LogK,
drawn using the Surfer 7.0 software, visualizing Ca and Mg. Phosphorus and LogP showed a nugget
the spatial distribution of the soil properties. Cross effect. Except for P and LogP, all the theoretical
semi-variograms were used to determine whether models gave a good fit to the experimental semi-
two properties had a common variance (Goovaerts & variograms, and the values for the coefficients of
Chiang 1993). determination (R2) were above 0.75 and, sometimes,
close to 1 [pH(CaCl2), Ca and Mg]. The logarithm
RESULTS AND DISCUSSION transformation did not improve the coefficients
of determination of the models for K and P. The
The descriptive analysis of the chemical available P showed a nugget effect. Thus, it can be
properties is shown in Table 2. The measures of assumed that the distribution is completely random,
central tendency (mean and median) are relatively with no spatial dependence between samples. This
similar for most the variables. It was found to be low means that the methods of classical statistics may be
for the variables pH(H2O) and pH(CaCl2), average for applied with an arithmetic mean value that represents
exchangeable Ca, Mg and available K, and high for well the data set. However, it does not necessarily
available P. The available P and K were not normally mean that there is a structure variance. The spatial
Table 2. Descriptive statistics of the soil chemical properties (number of samples for the grid = 240).
Variables Minimum Maximum Median Mean SD CV (%) Skewness Kurtosis Probability levela
pH(H2O) 4.15 6.03 5.07 5.06 0.30 6.01 0.07 0.47 ns
pH(CaCl2) 3.91 5.04 4.34 4.37 0.19 4.47 0.64 0.65 ns
P (mg kg-1) 1.41 38.17 4.42 6.41 5.68 88.73 2.71 9.41 < 0.05
K (mmolc kg-1) 3.59 18.72 6.41 7.05 2.41 34.13 1.73 3.91 < 0.05
Ca (mmolc kg-1) 5.70 38.70 16.75 16.89 5.57 33.00 0.49 0.55 ns
Mg (mmolc kg-1) 4.20 28.30 11.70 11.89 4.11 34.62 0.70 1.19 ns
a
Probability level obtained from the Kolmogorov-Smirnov test; ns: not significant.
Table 3. Theoretical models and estimated parameters of the experimental semi-variograms of the soil chemical properties.
__________________________________________
Parameters __________________________________________ Spatial
Variable Model
C0 C1 R (m) R2 DSD (%) class
pH(H2O) Spherical 0.0467 0.0491 35.91 0.768 51.25 Moderate
pH(CaCl2) Spherical 0.0154 0.0247 35.15 0.995 38.37 Moderate
P Nugget effect 27.6100 29,719.0000 556,942.00 0.461 - -
LogP Nugget effect 0.0640 0.0260 41.00 0.414 - -
K Spherical 1,948.4000 7,481.0000 23.46 0.852 20.66 Strong
LogK Spherical 0.0050 0.0130 25.00 0.837 27.78 Moderate
Ca Spherical 0.0662 0.2342 20.99 0.996 22.02 Strong
Mg Spherical 0.0731 0.0896 28.74 0.996 44.95 Moderate
C0: nugget variance; C1: baseline; R: range; R2: coefficient of determination; DSD: degree of spatial dependence.
e-ISSN 1983-4063 - www.agro.ufg.br/pat - Pesq. Agropec. Trop., Goiânia, v. 51, e66853, 20216 D. N. Eberhardt et al. (2021)
dependence may occur at a shorter distance than the The spatial distribution pattern of soil chemical
distance between the sampling points. properties was evaluated by the geostatistical maps
The C0 values reflect a variability not explained of the kriged estimates (Figure 4). A visual map
by the semi-variograms for distances smaller than analysis showed that all properties tend to have the
the separation distance between the samples (Vieira highest concentrations in the area which starts at the
2000). It is indicative of the amount of random top centre and ends at the bottom left of the maps
variation from one point to another, and the lower the (west to east).
values, the more similar are the neighbours. The C0 In the tropical Savanna, where the study
values are 0.05, 0.02, 0.07 and 0.07, respectively for was conducted, fire plays a critical role in the soil
pH(H2O), pH(CaCl2), Ca and Mg. Lower C0 values biogeochemistry (Pivello et al. 2010, Resende et
were found for pH(H2O), pH(CaCl2), Ca and Mg, al. 2011). The changes in the processes can be
indicating a higher continuity of spatial variability, either harmful or beneficial to the agroecosystems,
when compared to available K. depending on the severity of the fire, and the effects
The analysis of the C0/(C0 + C1) ratio makes may be short-lived or long-lasting (Neary et al. 1999,
it possible to quantify the random component (C0) Thomaz 2018). In this region, the main change in
within the total variance (C0 + C1) and corresponds to the environmental characteristics is related to the
the degree of spatial dependence (DSD). A moderate soil nutrient concentrations (Lal & Ghuman 1989,
degree of spatial dependence (25 % < DSD < 75 %) Fraser & Scott 2011). In the present study, the atypical
was observed for pH(H2O), pH(CaCl2) and Mg, nutrient concentration after approximately 20 years
whilst K and Ca presented a strong degree of spatial of deforestation shown in the maps (Figure 4) is the
dependence (DSD < 25 %). first clue to changes in the nutrient distribution pattern
The range (R) is the distance at which the due to Savanna windrow wood burning.
spatial autocorrelation between pairs of data points The variations of some of the soil properties
ceases. Its variation between 21 and 36 m implies analysed in this study are rather high (Table 2).
that the distance of the spatial autocorrelation is The basic cations had CVs of 33-35 %, whereas
longer than the average distance of 5 m between the CV of P reached 89 %. However, a low CV was
samples, indicating that the sample framework used observed for soil pH (H2O and CaCl2), corroborating
was adequate to represent the spatial structure, so that several studies that have reported that soil pH is
geostatistical interpolation maps of good quality can among the most variable soil properties (Mulla &
be obtained (McGrath et al. 2004). McBratney 2000, Vendrame et al. 2010, Vendrame
The cross semi-variogram estimates for pairs et al. 2013).
of variables using pH(H2O), pH(CaCl2), Ca, Mg and The spatial variability analyses were conducted
K are shown in Table 4. All the cross semi-variograms and soil properties for the whole area were predicted
were fitted to the spherical model. All the pairs of by ordinary kriging, showing spatial distribution
variables showed a strong or moderate degree of patterns (Figure 4). The spatial correlation of samples
spatial dependence. Their ranges are similar, varying was analysed by the experimental semi-variograms
from 20 to 35 m, with a mean of 27 m. to which the mathematical models were fitted. A
Table 4. Theoretical models and estimated parameters of the experimental cross semi-variograms of the soil chemical properties.
_____________________________________
Parameters _____________________________________
Pairs of variables Model Spatial class
C0 C1 R (m) R2 DSD (%)
Ca x Mg Spherical 0.035 0.150 20 0.783 18.9 Strong
Ca x pH(CaCl2) Spherical 0.015 0.060 25 0.787 20.0 Strong
Mg x pH(CaCl2) Spherical 0.022 0.045 30 0.791 32.8 Moderate
K x pH(CaCl2) Spherical 0.000 7.100 26 0.507 0.0 Strong
pH(H2O) x pH(CaCl2) Spherical 0.020 0.031 35 0.791 39.2 Moderate
pH(H2O) x Ca Spherical 0.021 0.068 25 0.686 23.6 Strong
pH(H2O) x Mg Spherical 0.021 0.060 30 0.756 25.9 Moderate
pH(H2O) x K Spherical 0.000 12.000 24 0.633 0.0 Strong
C0: nugget variance; C1: baseline; R: range; R2: coefficient of determination; DSD: degree of spatial dependence.
e-ISSN 1983-4063 - www.agro.ufg.br/pat - Pesq. Agropec. Trop., Goiânia, v. 51, e66853, 2021Effect of Savanna windrow wood burning on the spatial variability of soil properties 7
Figure 4. Maps of the kriged estimates for the soil chemical properties of the study site.
high degree of spatial dependence was observed deforestation. During a fire, some of the plant
for Ca and K (C0/C0 + C1 < 25 %) and a moderate nutrients are deposited on the soil as ash and some,
one for Mg and pH (H2O and CaCl2) (25 % < C0/ mainly nitrogen, are released into the atmosphere
C0 + C1 < 75 %). Only P showed a weak degree of as gaseous compounds (Pivello & Coutinho 1992).
spatial dependence. Except for P, the semi-variograms The total above-ground biomass of different types
reached an upper limit, i.e., a sill. Such variograms of Cerrado vegetation ranges 5-25 Mg ha-1 (Delitti
suggest that the properties vary in a patchy way, et al. 2006). The nutrient concentration in the native
resulting in some areas with lower and others with vegetation biomass of the Cerrado varies 0.56-1.38 %
higher values (Frogbrook et al. 2002). The range of for Ca, 0.08-0.10 % for Mg, 0.19-2.26 % for K and
spatial dependence varied from 21 to 36 m for all the 0.11-0.6 % for P (Pivello & Coutinho 1992, Kauffman
measured soil properties (Table 3). Moreover, the et al. 1994).
cross semi-variograms highlight the close relationship It is assumed that the changes in the soil
among these soil properties (Table 4): the coefficient properties (pH, exchangeable cations) mainly result
of determination of pairs of variables varied from 0.51 from the amount of ash alkalinity added to the soils,
to 0.79; and the ranges of the cross semi-variograms i.e., the excess of cations over inorganic anions that
are much the same as those of the variograms. The is generally observed in plant material (Noble et al.
kriged contour maps showed positional similarities, 1996). Other studies have also shown large increases
with a patchy zone crossing the study area, where all in Ca and Mg concentrations in the soil after fire or
these properties were higher (Figure 4). ash deposition (Strømmgaard 1992, Kauffman et al.
This patchy zone is supposed to be related to 1994, Carvalho et al. 2014). The soil pH also tends
burning windrow wood from the Savanna (Cerrado) to increase after a fire, due to the release of basic ions
e-ISSN 1983-4063 - www.agro.ufg.br/pat - Pesq. Agropec. Trop., Goiânia, v. 51, e66853, 20218 D. N. Eberhardt et al. (2021)
from the ash (Nardoto & Bustamante 2003). The only showed similar patterns, i.e., a patchy zone
soil property that did not vary with the others was the crossing the study area, where all the soil properties
available P content. The P semi-variogram (Table 3) were higher, indicating that burning piles of wood
showed a pure nugget effect, indicating a total lack of results in a well-defined spatial arrangement.
spatial dependence. This means that the range for the
P data is smaller than the smallest spacing between
ACKNOWLEDGMENTS
samples (5 m). The high variability of the available
P is probably related to the P fertilizer location. The
The authors thank José Carlos Costa Gonçalves
band placement of P must increase the variability
Rocha and Davi de Jesus Soaris da Silva, for field
of the P availability, as this criterion has not been support; the Empresa Brasileira de Pesquisa Agropecuária
considered for soil sampling. Indeed, management (Embrapa), Centre de Coopération Internationale en
practices could have great effects on P availability Recherche Agronomique pour le Développement (CIRAD)
(Eberhardt et al. 2021). and Institut de Recherche pour le Développement (IRD),
Cerrado deforestation by piling up and burning for the financial support; and the Conselho Nacional de
wood has a major influence on the soil properties, Desenvolvimento Científico e Tecnológico (CNPq), for
even after several years (ca. 18) of agricultural land the scholarships granted.
use. Other studies have shown that, after 20-40 years,
i.e., nearly the time since deforestation of our study REFERENCES
area, changes induced by fire in the soil chemical
properties are still perceptible. Strømgaard (1992) BEUCHLE, R.; GRECCHI, R. C.; SHIMABUKURO, Y.
reported, for an Orthic Oxisol, an increase in pH from E.; SELIGER, R.; EVA, H. D.; SANO, E.; ACHARD, F.
4.2 to 7.2, 5.2 and 5.1, respectively for 24 hours, 40 Land cover changes in the Brazilian Cerrado and Caatinga
days and 9 years, after a fire. Fraser & Scott (2011) biomes from 1990 to 2010 based on a systematic remote
showed a persistent effect of fire (pH, Ca and Mg) after sensing sampling approach. Applied Geography, v. 58, n. 1,
approximately 20 years. According to Fraser & Scott p. 116-127, 2015.
(2011), the burning effect could persist for up to 1,000 CAMARGO, F. A. O.; SILVA, L. S.; MERTEN, G. H.;
years before reverting to the pre-burn soil conditions. CARLOS, F. S.; BAVEYE, P. C.; TRIPLETT, E. W.
The knowledge of the spatial variability of soil Brazilian agriculture in perspective: great expectations
properties at the field scale is of great importance vs reality. Advances in Agronomy, v. 141, n. 1, p. 53-114,
to crop management and soil quality assessment in 2017.
precision agriculture (Negreiros Neto et al. 2014), CAMBARDELLA, C. A.; MOORMAN, T. B.; NOVAK,
and the models proposed are also relevant to digital J. M.; PARKIN, T. B.; KARLEN, D. L.; TURCO, R. F.;
soil mapping (Dalmolin & ten Caten 2015). Currently, KONOPKA, A. E. Field-scale variability of soil properties
identifying management areas within a field that in central Iowa soils. Soil Science Society of America
Journal, v. 58, n. 5, p. 1501-1511, 1994.
represent subfield regions with uniform characteristics
that can affect yield is essential for sustainable CARVALHO, G. H.; BATALHA, M. A.; SILVA, I. A.;
agroecosystem management. Then, these contour maps CIANCIARUSO, M. V.; PETCHEY, O. L. Are fire, soil
of soil properties, along with their spatial structures, fertility and toxicity, water availability, plant functional
can be used for better management decisions, as a diversity, and litter decomposition related in a Neotropical
Savanna? Oecologia, v. 175, n. 3, p. 923-935, 2014.
fertilization strategy and mapping soil variability in
management zones for precision agriculture. CHAZDON, R. L. Tropical forest recovery: legacies of
human impact and natural disturbances. Perspectives in
Plant Ecology, Evolution and Systematics, v. 6, n. 1-2,
CONCLUSIONS
p. 51-71, 2003.
1. The geostatistical analysis showed that burning CLAESSEN, M. E. C. Manual de métodos de análise de
windrow wood from Cerrado (Brazilian Savanna) solo. 2. ed. Rio de Janeiro: Embrapa Solos, 1997.
deforestation has a great influence on the spatial CROZIER, C. R.; NADERMAN, G. C.; TUCKER, M.
variability of most soil chemical properties; R.; SUGG, R. E. Nutrient and pH stratification with
2. The spatial variability of pH(H2O), pH(CaCl2), conventional and no‐till management. Communications in
exchangeable Ca, Mg and available K contents Soil Science and Plant Analysis, v. 30, n. 1-2, p. 65-74, 1999.
e-ISSN 1983-4063 - www.agro.ufg.br/pat - Pesq. Agropec. Trop., Goiânia, v. 51, e66853, 2021Effect of Savanna windrow wood burning on the spatial variability of soil properties 9
DALMOLIN, R. S. D.; TEN CATEN, A. Mapeamento Annual Review of Environment and Resources, v. 28, n. 1,
digital: nova abordagem em levantamento de solos. p. 205-241, 2003.
Investigación Agraria, v. 17, n. 1, p. 77-86, 2015.
LINTEMANI, M. G.; LOSS, A.; MENDES, C. S.;
DELITTI, W. B. C.; MEGURO, M.; PAUSAS, J. G. FANTINI, A. C. Long fallows allow soil regeneration in
Biomass and mineral mass estimates in a “Cerrado” slash and burn agriculture. Journal of the Science of Food
ecosystem. Brazilian Journal of Botany, v. 29, n. 4, and Agriculture, v. 100, n. 3, p. 1142-1154, 2019.
p. 531-540, 2006.
MCGRATH, D.; ZHANG, C.; CARTON, O. T.
EBERHARDT, D.; MARCHÃO, R. L.; QUIQUAMPOIX, Geostatistical analyses and hazard assessment on soil
H.; LE GUERNEVÉ, C.; RAMAROSON, V.; SAUVADET, lead in silver mines area, Ireland. Environmental Pollution,
M.; MURAOKA, T.; BECQUER, T. Effects of companion v. 127, n. 2, p. 239-248, 2004.
crops and tillage on soil phosphorus in a Brazilian Oxisol:
MULLA, D. J.; MCBRATNEY, A. B. Soil spatial
a chemical and 31P NMR spectroscopy study. Journal of
variability. In: SUMNER, M. E. (ed.). Handbook of soil
Soils and Sediments, v. 21, n. 2, p. 1024-1037, 2021.
science. Boca Raton: CRC, 2000. p. 321-352.
FOOD AND AGRICULTURE ORGANIZATION (FAO).
NARDOTO, G. B.; BUSTAMANTE, M. M. C. Effects
World reference base for soil resources: international soil
of fire on soil nitrogen dynamics and microbial biomass
classification system for naming soils and creating legends
in Savannas of Central Brazil. Pesquisa Agropecuária
for soil maps. FAO: Rome, 2014. (World soil resources
Brasileira, v. 38, n. 8, p. 955-962, 2003.
reports, n. 106).
NARDOTO, G. B.; BUSTAMANTE, M. M. C.; PINTO,
FRASER, M. A.; SCOTT, B. J. Variability of acidity in
A. S.; KLINK, C. A. Nutrient use efficiency at ecosystem
agricultural soils: the impact of timber burning at land
and species level in Savanna areas of Central Brazil and
clearing. Soil Research, v. 49, n. 3, p. 223-230, 2011.
impacts of fire. Journal of Tropical Ecology, v. 22, n. 2,
FROGBROOK, Z. L.; OLIVER, M. A.; SALAHI, M.; p. 191-201, 2006.
ELLIS, R. H. Exploring the spatial relations between cereal
NEARY, D. G.; KLOPATEK, C. C.; BANO, L. F.;
yield and soil chemical properties and the implications for
FFOLLIOTT, P. F. Fire effects on belowground
sampling. Soil Use and Management, v. 18, n. 1, p. 1-9,
sustainability: a review and synthesis. Forest Ecology
2002.
and Management, v. 122, n. 1-2, p. 51-71, 1999.
GOEDERT, W. J.; WAGNER, E.; BARCELLOS, A. O.
NEGREIROS NETO, J. V.; SANTOS, A. C.; GUARNIERI,
Savanas tropicais: dimensão, histórico e perspectivas.
A.; SOUZA, D. J. A. T.; DARONCH, D. J.; DOTTO, M.
In: FALEIRO, F. G.; FARIAS NETO, A. L. de. Savanas:
A.; ARAÚJO, A. S. Spatial variability of chemical and
desafios e estratégias para o equilíbrio entre sociedade,
physical attributes of Dystrophic Red-Yellow Latosol in
agronegócio e recursos naturais. Planaltina, DF: Embrapa
no tillage. Semina Ciências Agrárias, v. 35, n. 1, p. 193-
Cerrados, 2008. p. 49-80.
204, 2014.
GOOVAERTS, P.; CHIANG, C. N. Temporal persistence
NOBLE, A. D.; ZENNECK, I.; RANDALL, P. J. Leaf litter
of spatial patterns for mineralizable nitrogen and selected
ash alkalinity and neutralisation of soil acidity. Plant and
soil properties. Soil Science Society of America Journal,
Soil, v. 179, n. 2, p. 293-302, 1996.
v. 57, n. 2, p. 372-381, 1993.
PIVELLO, V. R.; COUTINHO, L. M. Transfer of macro-
KAUFFMAN, J. B.; CUMMINGS, D. L.; WARD, D. E.
nutrients to the atmosphere during experimental burnings
Relationships of fire, biomass and nutrient dynamics along
in an open Cerrado (Brazilian Savanna). Journal of
a vegetation gradient in the Brazilian Cerrado. Journal of
Tropical Ecology, v. 8, n. 4, p. 487-497, 1992.
Ecology, v. 82, n. 3, p. 519-531, 1994.
PIVELLO, V. R.; OLIVERAS, I.; MIRANDA, H. S.;
KLINK, C. A.; MACHADO, R. B. Conservation of the
HARIDASAN, M.; SATO, M. N.; MEIRELLES, S. T.
Brazilian Cerrado. Conservation Biology, v. 19, n. 3,
Effect of fires on soil nutrient availability in an open
p. 707-713, 2005.
Savanna in Central Brazil. Plant and Soil, v. 337, n. 1-2,
LAL, R.; GHUMAN, B. S. Biomass burning in windrows p. 111-123, 2010.
after clearing a tropical rainforest: effects on soil properties,
RESENDE, J. C. F.; MARKEWITZ, D.; KLINK, C. A.;
evaporation and crop yields. Field Crops Research, v. 22,
BUSTAMANTE, M. M. C. Phosphorus cycling in a small
n. 4, p. 247-255, 1989.
watershed in the Brazilian Cerrado: impacts of frequent
LAMBIN, E. F.; GEIST, H. J.; LEPERS, E. Dynamics burning. Biogeochemistry, v. 105, n. 1-3, p. 105-118,
of land-use and land-cover change in tropical regions. 2011.
e-ISSN 1983-4063 - www.agro.ufg.br/pat - Pesq. Agropec. Trop., Goiânia, v. 51, e66853, 202110 D. N. Eberhardt et al. (2021)
SANTOS, H. G.; JACOMINE, P. K. T.; ANJOS, L. H. C.; in the Cerrado region, Brazil. Soil Research, v. 51, n. 4,
OLIVEIRA, V. A.; OLIVEIRA, J. B.; COELHO, M. R.; p. 253-261, 2013.
LUMBRERAS, J. F.; CUNHA, T. J. F. Sistema brasileiro
VENDRAME, P. R.; BRITO, O. R.; GUIMARÃES,
de classificação de solos. 3. ed. Rio de Janeiro: Embrapa
M. F.; MARTINS, E. S.; BECQUER, T. Fertility and
Solos, 2013.
acidity status of Latossolos (Oxisols) under pasture in
SILVA, D. M.; BATALHA, M. A. Soil-vegetation the Brazilian Cerrado. Anais da Academia Brasileira de
relationships in Cerrados under different fire frequencies. Ciências, v. 82, n. 4, p. 1085-1094, 2010.
Plant and Soil, v. 311, n. 1-2, p. 87-96, 2008.
VIEIRA, S. R. Geoestatística em estudos de variabilidade
STRØMMGAARD, P. Immediate and long-term effects of espacial do solo. In: NOVAIS, R. F.; ALVAREZ, V. V.
fire and ash fertilization on a Zambian miombo woodland H.; SCHAEFER, C. E. G. R. (ed.). Tópicos em ciência
soil. Agriculture, Ecosystems and Environment, v. 41, n. 1, do solo. Viçosa: Sociedade Brasileira de Ciência do Solo,
p. 19-37, 1992. 2000. p. 1-54.
TAVARES FILHO, J.; FERREIRA, R. M.; FERREIRA, VIEIRA, S. R.; MILLETE, J.; TOPP, G. C.; REYNOLDS,
V. M. Soils chemical fertility in pastures formed by native W. D. Handbook for geostatistical analysis of variability
species and Brachiaria decumbens managed with annual in soil and climate data. In: NOVAIS, R. F.; ALVAREZ, V.
fire. Semina: Ciências Agrárias, v. 32, n. 4, p. 1771-1782, V. H.; SCHAEFER, C. E. G. R. (ed.). Tópicos em ciência
2011. do solo. Viçosa: Sociedade Brasileira de Ciência do Solo,
THOMAZ, E. L. Dynamics of aggregate stability in slash- 2002. p. 1-45.
and-burn system: relaxation time, decay, and resilience. WARRICK, A. W.; NIELSEN, D. R. Spatial variability of
Soil & Tillage Research, v. 178, n. 1, p. 50-54, 2018. soil physical properties in the field. In: HILLEL, D. (ed.).
USA. Soil Survey Staff. Keys to soil taxonomy. 12. ed. Applications of soil physics. New York: Academic Press,
Washington, DC: USDA-Natural Resources Conservation 1980. p. 319-344.
Service, 2014.
YOUNG, M. D.; SOLBRIG, O. T. The world’s Savannas:
VENDRAME, P. R. S.; BRITO, O. R.; MARTINS, E. economic driving forces, ecological constraints and policy
S.; QUANTIN, C.; GUIMARÃES, M. F.; BECQUER, options for sustainable land use. Paris:Unesco/Parthenon
T. Acidity control in Latosols under long-term pastures Publishing Group, 1993.
e-ISSN 1983-4063 - www.agro.ufg.br/pat - Pesq. Agropec. Trop., Goiânia, v. 51, e66853, 2021You can also read