Intertemporal Arbitrage of Water and Long-Term Agricultural Investments: Drought, Groundwater Banking, and Perennial Cropping Decisions in California
←
→
Page content transcription
If your browser does not render page correctly, please read the page content below
Intertemporal Arbitrage of Water and Long-Term Agricultural Investments:
 Drought, Groundwater Banking, and Perennial Cropping Decisions in
 California

 Jesus Gonzalez1 and Frances C. Moore2

 Abstract

In arid areas, irrigation water is an essential input into agricultural production. However, rainfall
and, correspondingly, surface water supplies, are often highly variable, creating uncertainty over
the value of long-term, water-dependent investments in these cropping systems. Moreover,
climate change is expected to increase both crop water requirements and the variability of
seasonal rainfall, meaning the constraints imposed by variable water supplies are likely to grow
in cost as climate change progresses. In this setting, storing water in wet years for use in dry
years is valuable. In particular, it would be expected to increase the value of perennial crops,
which require large up-front investments that pay off gradually over the life of the tree. We first
show, in a simple theoretical model, that given the timing of returns to investments in perennial
crops, there is always some level of drought risk above which annual crops will be preferred to
perennials. We then demonstrate this effect empirically using a unique institutional setting in
which access to a relatively new form of water storage, groundwater banking, effectively created
spatial variation drought risk between irrigation districts in Kern County, California. Using a 21-
year dataset of individual cropping decisions, we provide evidence that access to a large
groundwater banking project, the Kern Water Bank, increased the rate at which farmers switched
from lower-value annual crops such as wheat and alfalfa, into high-value perennial nut crops,
primarily almonds and pistachio.

Section 1: Introduction
Water is an essential input into agricultural production, but the natural supply of water is not
equally distributed either across space or across time. Agricultural systems have developed a
variety of approaches to deal with the uneven supply of rain: locating in places where
precipitation is generally adequate for rainfed production, timing planting to coincide with the

1
 Department of Agriculture and Resource Economics, University of California Davis
2
 Department of Environmental Science and Policy, University of California Davis

 1
wet season, accessing alternative supplies of water by pumping groundwater, or moving and
storing rainwater in surface irrigation systems. In many agricultural systems, natural variability
in this essential input creates costly uncertainty in annual production, optimal management
strategies, and the value of investment decisions. The value of irrigation investments therefore
comes not only from expanding but from smoothing the available water supply, thereby reducing
the risk associated with rainfall fluctuations, something particularly important in arid areas where
water supply imposes a binding constraint on production.

The costs of rainfall variability have been widely documented, particularly in developing country
contexts. In arid areas reliant on seasonal rainfall, variability in the timing and amount of rainfall
has large effects on output (Rosenzweig & Binswanger, 1992). Farmers adjust their crop choice
and inputs in response to observed or forecast changes in seasonal rainfall (Rosenzweig & Udry,
2014; Taraz, 2017). In the absence of insurance, farmers have been shown to adopt risk-averse
strategies, rejecting higher value but risky options in favor of lower but less variable returns. For
instance, Karlan et al (2014) find that rainfall risk is a binding constraint on the investment
decisions of farmers in northern Ghana. Relieving that constraint through the provision of index
insurance leads to substantial on-farm investments that increase productivity.

The role of rainfall risk in developed countries has been less widely studied, likely for two
reasons. Firstly, in most temperate cropping systems, temperature rather than rainfall is the
binding meteorological constraint on production (Schlenker and Roberts 2009). Secondly, in
drier areas, large investments in irrigation infrastructure as well as the widespread use of crop
insurance, have reduced the exposure of farmers to local rainfall variability and decreased risk in
many regions. However, in arid areas, water supply risk may still be an important determinant of
production decisions, significantly affecting both cropping and investment decisions (Feinerman
& Tsur, 2014; Koundouri, Nauges, & Tzouvelekas, 2006; Marques, Lund, & Howitt, 2005).

Perennial crops such as fruit and nut trees are long-term investments because they have high
establishment costs and are unproductive in the first 3-4 years of the tree’s life. These costs are
paid back over the lifetime of the tree (Feinerman & Tsur, 2014). If farmers are unable to access
water in any year, the tree dies and they lose all future production. Perennial crops are thus
inherently more exposed to drought risk than annual crops because fallowing land is very costly.
Zilberman et al. (2002) document that fallowing land in annual crops was a significant margin of

 2
adjustment to the serious California drought of 1987-1991. In years with severe water deficits,
farmers of perennial crops however face a choice between losing the trees and securing water at
high price on the market (Qin et al., 2019). Therefore, drought risk is an important determinant
of the returns to perennial crops and investments to reduce variability in water supplies will be
correspondingly valuable in these systems.

Climate change is expected to increase the variability of rainfall in the future creating more
intense, heavy rainfall events with longer dry spells in between (Diffenbaugh, Swain, & Touma,
2015; Mallakpour, Sadegh, & AghaKouchak, 2018; Swain, Langenbrunner, Neelin, & Hall,
2018). In addition, warmer temperatures will increase crop water demand, making any deficit in
rainfall more damaging to agriculture (Lobell et al., 2013; Ortiz-Bobea, Wang, Carrillo, & Ault,
2019). This means understanding how water supply variability constrains agricultural production
will be important for quantifying the impacts of climate change and identifying promising
adaptation options. In California in particular, in addition to increasing inter- and intra-annual
variability, climate change is expected to shift runoff to earlier in the year as less snow falls in
the Sierra Nevada and the snowpack melts earlier in the year (Bedsworth, Cayan, Franco, Fisher,
& Ziaja, 2018). This creates a disconnect in the timing of peak water availability in the spring
and peak irrigation demand in mid-summer, increasing the importance of water storage for
managing water supply availability throughout the year.

Here we show that the ability to smooth interannual water supplies is important in the uptake of
high-value perennial crops. Specifically, access to a major groundwater banking project, which
allows members to store some portion of their surface water endowment as groundwater in wet
years for future use in dry years, accelerated adoption of perennial nut crops in southern
California. There are two main contributions. Firstly, while a number of papers have addressed
the spatial inefficiencies in California water allocations associated with a limited water market,
fewer have directly estimated the effect of temporal inefficiencies and, conversely, the value of
water storage (Bruno & Jessoe, 2019; Hagerty, 2019). Here we provide empirical evidence that
reducing drought risk through access to large scale water storage enables higher-value but riskier
production. Secondly, we provide evidence on the effectiveness of a relatively new form of water
storage technology, groundwater banking. Given the increasingly variable flows expected with
climate change, as well as new regulatory constraints on unsustainable groundwater extraction in

 3
California and the difficulty of permitting new reservoir storage, groundwater banking is
increasingly seen as essential for managing water supply variability in the future (Hanak et al.,
2019; Hanak & Lund, 2012; Tanaka et al., 2006).

In the following section, we provide an overview of the climatological and agricultural setting
for the study. We then introduce a similar theoretical model to provide insights into the role of
drought risk in determining the relative value of annual and perennial crops. Section 4 introduces
the data and empirical strategy, Section 5 gives results and Section 6 concludes.

Section 2: Agriculture in Kern County and the Kern County Water Bank

The Central Valley of California is one of the most productive agricultural areas in the world,
producing about two-thirds of US fruit and nuts, including essentially all the country’s peaches,
plums, figs, raisins, olives, almonds, walnuts, and dates (CDFA, 2018). This is despite the fact
that local rainfall is highly seasonal – during the summer essentially no rain falls in the Central
Valley. Production relies on transporting water both across space, from water rich northern
California to growing areas in the southern Central Valley, and across time, from winter to
summer via natural storage as snowpack in the Sierra Nevada and artificial storage in reservoirs
(Schlenker, Hanemann, and Fisher 2007). Although irrigation using groundwater expanded in
response to the 2013-2016 drought, it still makes up only about one third of total irrigation water
(CDWR, 2015).

Kern County is the very southern end of the Central Valley, in the Tulare Basin (Figure 1a).
Local precipitation is extremely low, but the county has over 1 million acres of agricultural land,
producing $7.4 billion in 2018 (Fankhauser, 2019). Agricultural land is divided into 23 irrigation
districts (Figure 1c), which supply water to members from a variety of sources including
deliveries from the two large aqueduct systems that transport water from northern California (the
Central Valley Project (CVP) and the State Water Project (SWP)), the local Kern River,
groundwater extraction, and recycled water from the oil and gas industry.

Since the early 2000s, Kern County has seen a pronounced shift in cropping patterns, away from
annual field and vegetable crops, toward perennial nut crops (Figure 1b). In 2000, annual crops,
primarily cotton, alfalfa, and wheat made up 58% of crop land in Kern while perennial crops,

 4
a) b)

c)

 Figure 1: a) Location of Kern County and the Central Valley within California b) Evolution of agriculture
 in Kern county, 2000-2018. Shaded areas mark years classified as “critically dry” in the San Joaquin valley
 by the California Department of Water Resources (CDWR) c) Location of the Kern Water Bank, member
 irrigation districts, plots associated with the Westside Mutual Water Company, and other non-member
 irrigation districts within Kern County

 5
primarily almond, pistachios and grapes made up 36%. By 2018, that ratio had switched so that
annual crops were just 36% while perennials were 55%. This trend continued over 2 major,
multi-year droughts (Figure 1c). The driver of perennial expansion has been the planting of nut
crops, primarily almond, pistachio, and walnut. These crops have seen an expanding market and
rising prices in the last 20 years. From 2000 to 2018 the prices of almonds and pistachios more
than doubled (USDA, 2018).

In an area with seasonal rainfall like Kern County, tree crops tend to use less irrigation than
annuals both because the trees are inherently less thirsty than annuals and because they are
typically grown with more efficient but capital-intensive irrigation systems (Zilberman et al.,
2002). However, despite reducing average water use, perennials can increase exposure to
drought risk. This is because, in addition to initial planting costs, they require a maturation
period of serval years, during which they are unproductive. These upfront investments, that must
be taken on ex-ante, before rainfall is realized, mean that fallowing – an important margin of
adjustment to drought for annual crops – is unavailable to perennial farmers. In years when water
is scarce, perennial farmers must either pay high prices to secure water or lose their investments.

This makes perennial investments potentially risky in southern California, where annual winter
precipitation, and thus the volume of surface water available for irrigation is extremely variable.
In wet years there is more than enough water to meet the needs of existing water rights holders
while in dry years some rights are ‘curtailed’, meaning owners are not able to use the water they
are usually entitled to. This dynamic induces large variation in the value of irrigation water, from
close to zero in wet years to an estimated $900 per acre-foot in the southern San Joaquin to avoid
fallowing highly valuable cropland (Hanak et al., 2019). A 2014 sale of water in Kern County, in
the middle of an intense, multi-year drought, received almost 20 bids at $1,000 per acre-foot or
higher (Henry, 2014).

This pattern would suggest the opportunity for intertemporal arbitrage of water, but storing water
is difficult and expensive. Historically reservoirs have been the only technology available for
large-scale, interannual water storage, but reservoir operations are determined by multiple,
sometimes conflicting objectives including flood control and power generation. Moreover,
further expansion of reservoir storage in California is unlikely given concerns over ecological
disruption. A relatively new technology for the intertemporal arbitrage of water is groundwater

 6
banking. This involves deliberately allowing surface water in wet years to infiltrate into aquifers
and storing it as groundwater for use in dry years, when it is pumped out and returned to surface
irrigation systems.

The capacity for groundwater banking has been growing rapidly in California since the late
1990s. The largest groundwater bank in California, and therefore the world, is the Kern Water
Bank (KWB). Since beginning operations in 1998, it has accounted for over 40% of the balances
of all groundwater banks in California and over 80% of the agricultural water banking capacity
in Kern County (Hanak & Stryjewski, 2012). It is located on 20,000 acres of sandy soil in the
center of the agricultural area of Kern County (Figure 1c). The KWB is owned by a coalition of
three Kern County irrigation districts, one irrigation district in neighboring Kings County,
Improvement District 4 which supplies water to the City of Bakersfield, and the Westside Mutual
Water Company (Figure 1c). Westside Mutual has large land-holdings throughout the southern
Central Valley, primarily associated with production of almonds, pistachios, and citrus.

Members of the KWB contribute some of their surface water allocations in wet years to the water
bank in return for access to water at relatively low marginal cost during periods of scarcity. In
other words, ownership of the KWB produces institutional variation in exposure to drought risk
across growers. In the following section, we develop theoretical intuition for how this affects the
value of perennial crops, and therefore the likelihood of switching from annuals into perennials.
We then test this using a unique 21-year dataset showing planting decisions of all landowners in
Kern County.

Section 3: Theoretical Model

We model the decision of a simple, profit-maximizing farmer considering adopting a perennial
crop or continuing an annual crop, adapting the model of drought risk for perennial crops given in
Feineman and Tsur (2014). The farmer faces drought risk, d, assumed to follow a Bernoulli
distribution parameterized with probability p and to be i.i.d across years.

For the annual crop, farmers are able to observe water availability before planting. This captures
the California case where summer irrigation water availability is determined by winter snowfall
and is known before spring planting. Profits from the annual crop are given by πa if d=0 and by 0
if d=1, since if irrigation water is not available due to drought, farmers can chose to fallow and

 7
avoid losing planting costs. Therefore, the net present value (NPV) of annual cropping over an
infinite horizon is given by:
 ∞
 (1 − )
 [ ] = ∑ ∗ [ = 0] = (1)
 (1 + )
 =1

For perennial crops however, farmers must decide on planting before the realization of drought,
incurring an upfront planting cost K. In addition, perennial crops require a gestation period m years
before producing. Starting in year m+1, the perennial crop produces profits πp and continues to do
so indefinitely until a drought occurs. Once a drought occurs, the tree dies and the farmer loses all
future production.

Given that drought is assumed to be Bernoulli distributed, the number of years before a drought
occurs (given by τ) follows a geometric distribution. The NPV of the perennial crop is given by

 1 (1 − ) 1
 = − + ∑ ∗ [ > ] = − + ∗ ∗ [1 − ]
 (1 + ) (1 + ) (1 + ) (1 + )
 =1

Where -K gives the fixed planting costs, and the second term gives the discounted value of future
production starting in year m+1, given that there is no drought before the tree reaches maturity.

Since the timing of drought, and therefore the number of years of production, is uncertain, NPVp
is also uncertain. Its expected value is given by:

 (1 − ) 1
 [ ] = − +
 ∗ ∗ [1 − ( )] (2)
 (1 + ) (1 + )

where,
 ∞ ∞
 1 (1 − ) −1 1− 1−
 (
 ) = ∑
 = ∑ ( ) = ∗ =
 (1 + ) (1 + ) 1− 1+ 1− + +
 =1 =1

Substituting in (2), we get:

 (1 − )
 [ ] = − +
 ∗ (3)
 (1 + ) +

 8
Equation 3 is an intuitive expression demonstrating the expected value of a perennial crop will
depend on the fixed planting costs, the number of years until maturity, the annual drought risk, and
the discount rate. The Appendix gives the first and second derivatives of [ ] with respect to
p and shows that this is a downward sloping and convex function.

Figure 2 shows how the expected NPV of annual and perennial crops change with annual drought

risk. The expected NPV of annual production which is linear in p with an intercept of
 and a

constant slope of − (green line). The expected NPV of perennial production is a decreasing and

 1
strictly convex function of p with an intercept of (1+ ) − (orange line). The graph depicts the

interesting case in which, in the absence of drought risk, the expected value of perennials is higher
 1
than the expected value of annuals (i.e. (1+ ) − > ).

 E[NPV]

 −
 ( + )
 E[NPVp]

 E[NPVa]= E[NPVp]

 E[NPVa]

 p* p

 -K

Figure 2. Expected NPV of annual (green) and perennial (orange) as a function of annual drought
risk (p)

 9
It is clearly apparent that there will always be some level of drought risk, p*, beyond which the
expected value of annuals will exceed that of perennials, irrespective of the relative annual profits
of the two crops. For areas close to this critical value, we would expect lower drought risk to result
in expansion of area in perennial crops. Large-scale groundwater banking allows farmers to
smooth water supplies and therefore lower the risk of extreme water shortages, effectively
lowering the p, and should therefore be associated with expansion of perennial crops.

Section 4: Data and Empirical Strategy

We test this hypothesis using a 21-year panel giving the geographic boundaries, operator, and
crop grown for all agricultural areas in Kern County (Kern County, 2019). Plot boundaries are
available annually since 1997 (see Table A1). Maps of plot areas in 2000 and 2018 included in
our working sample are shown in Figure A1. This shows the widespread switch from field crops
to nut trees shown in Figure 1a, but also shows the spatial heterogeneity in perennial uptake: by
2018 some areas had switched fully into nuts or fruit crops while in others field crops are still
significant. We classify each plot as perennial, annual or fallow and, because individual plots can
not be uniquely tracked from year to year (since boundaries change slightly and plots do not have
unique identifiers), we aggregate the area of annual and perennial crops to the operator by
irrigation district by year level. On average across the sample, each operator has 9.7 plots within
each irrigation district. There are 2,298 permit holders over 23 irrigation districts and a total
27,686 observations. The period saw a gradual consolidation of land, with total agricultural area
staying relatively constant but the number of operators decreasing by 15%, and average land
holdings per operator increasing from 1.1 to 1.3 thousand acres.

We identify plots of land within the KWB as those either within one of the member irrigation
districts (i.e. Wheeler-Ridge, Semitropic, Tejon-Castac, and Improvement District 4) or plots
identified as belonging to the Westside Mutual Water Company (i.e. land operated by The
Wonderful Company or Paramount Farms, which merged over the relevant time period and
which own Westside Mutual). Crops are classified as either annual or perennial based on a
classification given in Table A2.

With a long enough dataset, a natural empirical strategy would be a difference-in-difference
examining change in the rate of perennial expansion after establishment of the KWB in member
districts. Unfortunately, our data starts after establishment of the bank. Therefore, we first

 10
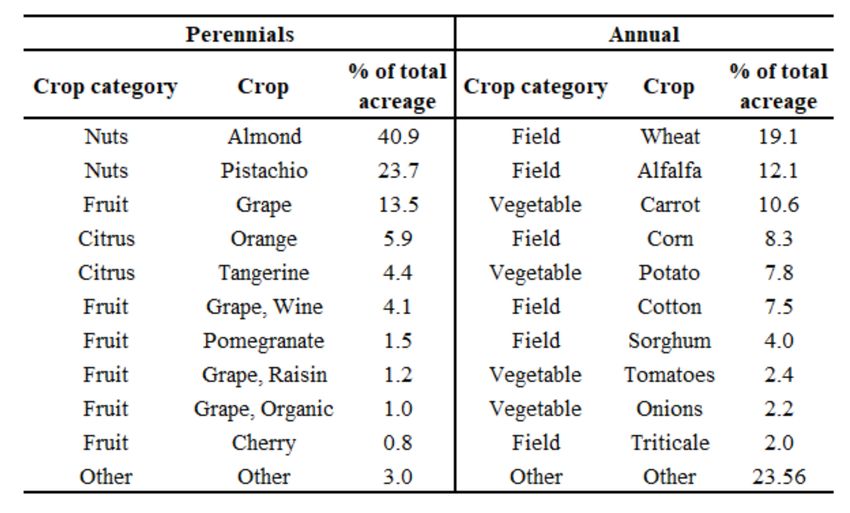
present results of a long-differences estimation, comparing the change in perennial area for plots
inside vs outside the KWB over the period of our data:

 ∆ = + +

Where ∆ is the change in the share or the area of either annual or perennial crop between
the end period (2014-2018) and the start period (1997-2001) for operator i in water district j,
KWB is an indicator variable indicating whether that plot is a member of the Kern Water Bank,
 , is an operator fixed-effect controlling for all time-invariant differences between companies or
individuals farming over this period in Kern County. Differencing controls for any time-invariant
differences in levels between plots. The residuals are clustered at the operator and water-district
level.

Our second identification strategy uses the fact that the value of water banking is highest during
times of scarcity and the fact that five out of 19 years in our sample were categorized as
“critically dry” by the California Department of Natural Resources (namely 2007, 2008, 2013,
2014, and 2015).

 = ℎ ∗ + + + +

Where is the either the share or the area of either annual or perennial crops in land

belonging to operator i in irrigation district j in year t. Drought is an indicator variable indicating
whether the water year for that irrigation season (i.e. from fall of the previous year through
spring of the current year) was critically dry. and are fixed-effects that flexibly control for
common time-varying shocks and time-invariant characteristics. In all regressions, residuals are
clustered at the operator and water-district level.

In addition to these specifications, we also present results that include operator fixed-effects.
These help alleviate concerns that certain characteristics of growers within irrigation districts that
are part of the KWB made them more likely to switch into perennial crops. These fixed-effects
control for all time-invariant differences between the individuals or companies farming in Kern
County, but limits the estimating variation to operators with holdings in more than one irrigation
district. The distribution of the number of irrigation districts by operator is given in Figure A2.
Thirty percent of operators farm in more than one irrigation district and 12% in 3 or more.

 11
Section 5: Results

A simple visualization of changes in cropping patterns inside vs outside the KWB is shown in
Figure 3. Changes between 2000 and 2018 are dominated by a switch away from field crops,
primarily wheat, alfalfa and cotton, and into tree nuts, primarily almonds and pistachios.
Although nut expansion has occurred throughout Kern County, the switch away from field crops
occurred far earlier in areas with access to the water bank. Total area classified as inside the
water bank has increased somewhat due to expansion of area associated with Westside Mutual
Water Company.

Figure 3: Change in cropping patterns in Kern County for land in vs outside of the KWB.

These observations are confirmed by results from the long-differences regression, shown in
Table 1. Between the periods 1997-2001 and 2014-2018, we see evidence of a faster switch
away from annual crops and into perennials within the KWB. The average area of perennial plots
grew 52% faster for holdings within the KWB compared to outside of it, while the area of
annuals shrank 67% faster. Controlling for operator fixed-effects, we see evidence that operators

 12
with plots both inside and outside the KWB chose to switch expand perennials faster in the plots
within the KWB compared to outside it.

There are some water districts in the east side of Kern County which had a high fraction of
perennial crops in the start of the period, mostly specializing in grape production. Water for these
crops comes from the local Kern River, supplemented by groundwater pumping and produced
water from the oil and gas industry during dry years (KCWA, 2011). Inclusion of these might
change the interpretation of our findings, and so we also report result that exclude four water
districts with average share of perennial crops greater that 85% in the first three years of the
dataset. Results shown in Table A3 shows that excluding these districts does not change the size
or sign of the estimated coefficients, but does substantially reduce power so that findings on
perennial area are not significant. However, we still see evidence that the share of perennials
increased more rapidly (and the share of annual crops decreased more rapidly) within the KWB
compared to outside it.

Table 1: Long-difference estimates of the effect of water banking on cultivation decisions
 asinh(area) Share
 Perennials Annuals Perennials Annuals
 (1) (2) (3) (4) (5) (6) (7) (8)
 Banking 0.517* 0.150 -0.669* -0.535** 0.146* 0.106** -0.152* -0.119***
 (0.291) (0.305) (0.370) (0.229) (0.079) (0.041) (0.076) (0.040)
 Operator FE No Yes No Yes No Yes No Yes
 R-squared 0.010 0.661 0.014 0.571 0.036 0.649 0.042 0.677
 Observations 607 320 607 320 607 320 607 320
Notes: Standard errors (in parenthesis) clustered at Operator and Water District level. * p
Excluding the eastern water districts with widespread perennial adoption at the beginning of the
period does not change these findings (Table A4).

Table 2: Panel estimates of the effect of water banking and droughts on cultivation
decisions
 asinh(area) Share
 Perennials Annuals Perennials Annuals
 (1) (2) (3) (4) (5) (6) (7) (8)
 Bank*Drought 0.628*** 0.207* -0.571*** -0.131* 0.078*** 0.029* -0.083*** -0.028**
 (0.154) (0.105) (0.094) (0.074) (0.011) (0.015) (0.011) (0.013)
 Operator FE No Yes No Yes No Yes No Yes
 Year FE Yes Yes Yes Yes Yes Yes Yes Yes
 WD FE Yes Yes Yes Yes Yes Yes Yes Yes
 R-squared 0.201 0.788 0.220 0.824 0.240 0.858 0.252 0.862
 Observations 27686 27308 27686 27308 27686 27308 27686 27308
Notes: Standard errors (in parenthesis) clustered at the Operator and Water District level.
* p
Table 3: Panel estimates of the effect of neighboring the KWB and droughts on cultivation
decisions
 asinh(area) Share
 Perennials Annuals Perennials Annuals
 (1) (2) (3) (4) (5) (6) (7) (8)
 Rosedale*Drought -0.032 0.023 -0.283*** -0.230** 0.046*** 0.035*** -0.040*** -0.031***
 (0.045) (0.058) (0.066) (0.079) (0.009) (0.010) (0.008) (0.009)
 Operator FE No Yes No Yes No Yes No Yes
 Year FE Yes Yes Yes Yes Yes Yes Yes Yes
 WD FE Yes Yes Yes Yes Yes Yes Yes Yes
 R-squared 0.227 0.821 0.213 0.842 0.245 0.872 0.253 0.874
 Observations 19308 18929 19308 18929 19308 18929 19308 18929
Notes: Standard errors (in parenthesis) clustered at the Permittee and Water District level.
* p
References
Barringer, F. (2011, July 26). Storing Water for a Dry Day Leads to Suits. New York Times.
 Retrieved from https://www.nytimes.com/2011/07/27/science/earth/27waterbank.html
Bedsworth, L., Cayan, D. R., Franco, G., Fisher, L., & Ziaja, S. (2018). California’s Fourth
 Climate Change Assessment: Statewide Summary Report. Sacramento, CA.
Bruno, E. M., & Jessoe, K. (2019). Water Markets and Climate Change Adaptation: Micro-level
 Evidence on Agricultural Water Demand. Retrieved from
 https://ellenbrunocom.files.wordpress.com/2019/02/bruno_jessoe_watermarkets_20190118.
 pdf
California, S. of. (2016). Sustainable Groundwater Management. Retrieved March 8, 2016, from
 groundwater.ca.gov
CDFA. (2018). California Agricultural Statistics Review 2017-2018. Sacramento, CA.
CDWR. (2015). California’s Groundwater Update 2013. Sacramento, CA.
Diffenbaugh, N. S., Swain, D. L., & Touma, D. (2015). Anthropogenic warming has increased
 drought risk in California. Proceedings of the National Academy of Sciences of the United
 States of America, 112(13), 3931–3936. https://doi.org/10.1073/pnas.1422385112
Fankhauser, G. (2019). 2018 Kern County Agricultural Crop Report. Bakersfield, CA.
Feinerman, E., & Tsur, Y. (2014). Perennial crops under stochastic water supply. Agricultural
 Economics, 45(6), 757–766. https://doi.org/10.1111/agec.12120
Hagerty, N. (2019). Liquid Constrained in California: Estimating the Potential Gains from
 Water Markets. Cambridge, MA.
Hanak, E., Escrevia-Bou, A., Gray, B., Green, S., Harter, T., Lund, J. R., … Seavy, N. (2019).
 Water and the Future of the San Joaquin Valley. San Francisco, CA.
Hanak, E., & Lund, J. R. (2012). Adapting California’s water management to climate change.
 Climatic Change, 111(1), 17–44. https://doi.org/10.1007/s10584-011-0241-3
Hanak, E., & Stryjewski, E. (2012). California’s Water Market By the Numbers: Update 2012.
 San Francisco, CA.
Henry, L. (2014, February 28). District Rakes in $14 Million from Water Auction.
 Bakersfield.Com.
Karlan, D., Osei, R., Osei-Akato, I., & Udry, C. R. (2014). Agricultural Decisions After
 Relaxing Credit and Risk Constraints. Quarterly Journal of Economics2, 129(2), 597–652.
KCWA. (2011). Tulare Lake Basin Portion of Kern County Integrated Regional Water
 Management Plan Final Update. Bakersfield, CA.
Koundouri, P., Nauges, C., & Tzouvelekas, V. (2006). Technology Adoption under Production
 Uncertainty: Theory and Application to Irrigation Technology. American Journal of
 Agricultural Economics, 88(3), 657–670. https://doi.org/10.1111/j.1467-8276.2006.00886.x

 16
Lobell, D. B., Hammer, G. L., McLean, G., Messina, C., Roberts, M. J., & Schlenker, W. (2013).
 The Critical Role of Extreme Heat for Maize Production in the United States. Nature
 Climate Change, 3(5), 497–501. https://doi.org/10.1038/nclimate1832
Mallakpour, I., Sadegh, M., & AghaKouchak, A. (2018). A new normal for streamflow in
 California in a warming climate: Wetter wet seasons and drier dry seasons. Journal of
 Hydrology, 567, 203–211. https://doi.org/10.1016/J.JHYDROL.2018.10.023
Marques, G. F., Lund, J. R., & Howitt, R. E. (2005). Modeling irrigated agricultural production
 and water use decisions under water supply uncertainty. Water Resources Research, 41(8).
 https://doi.org/10.1029/2005WR004048
Ortiz-Bobea, A., Wang, H., Carrillo, C. M., & Ault, T. R. (2019). Unpacking the climatic drivers
 of US agricultural yields. Environmental Research Letters, 14(6), 064003.
 https://doi.org/10.1088/1748-9326/ab1e75
Qin, Y., Mueller, N. D., Siebert, S., Jackson, R. B., AghaKouchak, A., Zimmerman, J. B., …
 Davis, S. J. (2019). Flexibility and intensity of global water use. Nature Sustainability, 2(6),
 515–523. https://doi.org/10.1038/s41893-019-0294-2
Rosenzweig, M., & Binswanger, H. P. (1992). Wealth, Weather Risk, and the Composition and
 Proitability of Agricultural Invsetments (No. WPS 1055). Washington DC.
Rosenzweig, M., & Udry, C. R. (2014). Forecasting Profitability (No. 19334). Cambridge, MA.
Schlenker, W, & Roberts, D. L. (2009). Nonlinear Temperature Effects Indicate Severe Damages
 to U.S. Corn Yields Under Climate Change. Proceedings of the National Academy of
 Sciences, 106(37), 15594–15598.
Schlenker, Wolfram, Hanemann, W. M., & Fisher, A. C. (2007). Water Availability, Degree
 Days, and the Potential Impact of Climate Change on Irrigated Agriculture in California.
 Climatic Change, 81(1), 19–38.
Standards, K. C. D. of A. and M. (2019). Kern County Spatial Data. Retrieved August 15, 2019,
 from http://www.kernag.com/gis/gis-data.asp
Swain, D. L., Langenbrunner, B., Neelin, J. D., & Hall, A. (2018). Increasing precipitation
 volatility in twenty-first-century California. Nature Climate Change, 8(5), 427–433.
Tanaka, S. K., Zhu, T., Lund, J. R., Howitt, R. E., Jenkins, M. W., Pulido, M. A., … Ferreira, I.
 C. (2006). Climate Warming and Water Management Adaptation for California. Climatic
 Change, 76(3–4), 361–387. https://doi.org/10.1007/s10584-006-9079-5
Taraz, V. (2017). Adaptation to Climate Change: Historical Evidence from the Indian Monsoon.
 Environment and Development Economics, 22(5), 517–545.
USDA. (2018). County Agriculture Commissioner’s Data Listing. Retrieved from
 http://www.nass.usda.gov/Statistics_by_State/California/Publications/AgComm/Detail/
Zilberman, D., Dinar, A., MacDougall, N., Khanna, M., Brown, C., & Castillo, F. (2002).
 Individual and Institutional Responses to the Drought: The Case of California Agriculture.
 Journal of Contemporary Water Research and Education, 121(1), 3.

 17
Appendix

First and Second Derivatives of E[NPVa] w.r.t. Drought Risk p

The first derivative of equation (3) with respect to p is given by:
 [ ] 1 (1 − )
 = [− − ]∗ ∗
 ( + )2 ( + )(1 − ) (1 + )
which is negative for 0
Year Plots mapped Plots permitted % Mapped
 1997 9,447 12,793 74
 1998 10,311 13,309 77
 1999 12,868 13,074 98
 2000 13,483 13,483 100
 2001 13,336 13,336 100
 2002 13,217 13,217 100
 2003 13,162 13,162 100
 2004 12,946 12,946 100
 2005 12,803 12,803 100
 2006 12,923 12,923 100
 2007 13,257 13,257 100
 2008 13,477 13,477 100
 2009 13,081 13,081 100
 2010 13,150 13,150 100
 2011 13,599 13,599 100
 2012 13,942 13,942 100
 2013 13,997 13,997 100
 2014 13,906 13,906 100
 2015 14,057 14,057 100
 2016 14,017 14,017 100
 2017 14,287 14,287 100
 2018 14,437 14,437 100
Source: http://www.kernag.com/gis/gis-data.asp

Table A1: Number of plots contained in the Kern county crop boundaries, 1997-2018

 19
a) 2000

 b) 2018

Figure A1. Plot boundaries of Kern county in 2000 and 2018 by major crop group.

 20
Figure A2: Number of irrigation districts each operator has plots in for 2018.

Table A2: Important perennial and annual crops in Kern County in 2018

 21
asinh(area) Share
 Perennials Annuals Perennials Annuals
 (1) (2) (3) (4) (5) (6) (7) (8)
 Banking 0.476 0.146 -0.624 -0.545** 0.139* 0.106** -0.146* -0.121**
 (0.297) (0.318) (0.370) (0.237) (0.079) (0.043) (0.075) (0.041)
 Permittee FE No Yes No Yes No Yes No Yes
 R-squared 0.009 0.661 0.012 0.613 0.033 0.679 0.039 0.702
 Observations 559 271 559 271 559 271 559 271
Notes: Standard errors (in parenthesis) clustered at Permittee and Water District level. * p
asinh(area) Share
 Perennials Annuals Perennials Annuals
 (1) (2) (3) (4) (5) (6) (7) (8)
 Rosedale*Drought -0.032 0.023 -0.283*** -0.230** 0.046*** 0.035*** -0.040*** -0.031***
 (0.045) (0.058) (0.066) (0.079) (0.009) (0.010) (0.008) (0.009)
 Permittee FE No Yes No Yes No Yes No Yes
 Year FE Yes Yes Yes Yes Yes Yes Yes Yes
 WD FE Yes Yes Yes Yes Yes Yes Yes Yes
 R-squared 0.227 0.821 0.213 0.842 0.245 0.872 0.253 0.874
 Observations 19308 18929 19308 18929 19308 18929 19308 18929
Notes: Standard errors (in parenthesis) clustered at the Permittee and Water District level.
* p
You can also read