Communication, Monitoring, and Measurement: Water Efficiency in the Coachella Valley
←
→
Page content transcription
If your browser does not render page correctly, please read the page content below
Communication, Monitoring, and Measurement:
                                                   Water Efficiency in the Coachella Valley
By Michael J. Cohen

     Introduction
     In the desert of southeastern California, two recent programs have increased agricultural water
     use efficiency while maintaining or improving crop yields and boosting agency productivity.
     These two programs demonstrate that sophisticated information-gathering methods can be an
     effective tool to improve water use efficiency and agricultural productivity, even in a district that
     already demonstrates high efficiency. Elements of these programs could be adapted by other
     water districts that are interested in cost-effective strategies to improve agricultural water use
     efficiency.

     In 2004, the Coachella Valley Water District (CVWD) began a multi-year agricultural water
     efficiency initiative known as the Extraordinary Water Conservation Program (ECP), to meet
     state and federal water conservation targets. The ECP documented savings of more than 75,500
     acre-feet of water over five years, at a cost to the district of about $40/acre-foot. In 2006, CVWD
     completed a district-wide communications and technology upgrade that provides its staff with
     water orders and system status in real time. This technology has greatly increased flexibility and
     autonomy to adjust deliveries to optimize water balancing and system efficiency, decreasing
     waste and better meeting irrigators’ needs.

     Background
     CVWD, formed in 1918, delivers domestic and irrigation water in the lower Coachella Valley,
     primarily in Riverside County, California (Figure 1). Reference evapotranspiration rates in the
     valley are very high, regularly exceeding 74 inches per year, markedly higher than the 57-58
     inches per year in the Central Valley and the 33 inches per year along the coast. Precipitation in
     the district averages about three inches annually. This means that crop water demand is high;
     with limited water supplies it is especially critical to maximize water-use efficiency.
     Temperatures exceed 100°F more than one hundred days a year, with a frost-free growing season
     greater than 300 days. This makes the valley ideal for growing fruits and vegetables, such as
     table grapes, peppers, and citrus, for the winter market.

     1∣ Pacific Institute Farm Water Success Stories: Improved Communication, Monitoring, and Measurement
Figure 1. California districts receiving Colorado River water
Source: MWDh20.com

Water Source and Distribution Network
Irrigators in the district originally relied on groundwater, but over-extraction and subsidence
problems prompted a shift to Colorado River water,1 first brought to the valley in 1948 by the
Coachella branch of the All American Canal. Early on, CVWD took the unusual step of
delivering water via a pipeline distribution system and metered deliveries to each account, to
minimize evaporative losses and maximize water use efficiency. Farms in the district have about
2,300 miles of subsurface drains and almost no surface drains, almost wholly eliminating
tailwater (surface) runoff.2 Irrigators in the district also benefit from the absence of downstream
diversions. Instead, the Salton Sea, an irrigation drainage depository designated in 1928 that
receives agricultural drainage and stormwater runoff, enables irrigators to avoid water-quality
standards that would exist if their drainage were applied to downstream fields. In recent years,
Colorado River salinity at Imperial Dam, the diversion point for CVWD, has averaged about 700
mg/L TDS (total dissolved solids) though this rises to about 780 mg/L TDS by the time the water
flows some 160 miles through the desert to the district. To push accumulating salts away from
the root zone, farmers apply additional irrigation water to leach the soil. This leaching fraction
varies based on soil type, irrigation demand, and crop type.

1
 For information on CVWD’s rights to Colorado River water, see http://www.cvwd.org/about/waterandcv.php.
2
 Subsurface drains, also known as tile drains, collect and remove water below the land surface (often known as “tile
water”). Surface drains, which may be little more than ditches at the end of the field or may be carefully constructed
catchment basins, collect water (often known as “tail water”) running off the surface of the field.

2∣ Pacific Institute Farm Water Success Stories: Improved Communication, Monitoring, and Measurement
Customers and Costs
CVWD distributes irrigation water to more than 1,100 active accounts, representing more than
78,000 irrigable acres. In 2006, CVWD delivered 242,000 acre-feet of Colorado River water to
its customers, who irrigated about 10,300 acres of table grapes; 8,500 acres of citrus; 7,400 acres
of dates; 4,500 acres of peppers; and 3,600 acres of lettuce, among other crops, generating an
estimated $575 million in revenue. Many of these are niche crops, benefitting from the valley’s
temperate winters to bring crops to market when other regions are unable to harvest.

In 2009, typical irrigators paid $24.05 per acre-foot, plus a $5 per acre-foot quagga mussel
surcharge (to cover costs associated with preventing the spread of this invasive species) and a
gate charge of $11.50 per day. Additionally, irrigators pay an “availability charge” of $91.39 per
acre for general farming uses, which may be satisfied by water use charges. That is, payment of
water charges goes toward satisfying the availability charge, and therefore the availability charge
only applies to properties using less than $91.39 of water per acre. For an irrigator applying four
acre-feet per acre, total water charges would come to $116.20 per acre, or an average unit cost of
about $29.05 per acre-foot, not including gate charges. In 2006, 26% of reported acreage was
flood irrigated, 20% was irrigated by sprinkler, and 54% was drip irrigated.

Genesis of CVWD’s Conservation Efforts
In October, 2003, the Secretary of the Interior signed the Colorado River Water Delivery
Agreement with California’s Colorado River contractors, including CVWD. The agreement
requires CVWD and other California water districts to reduce their use of Colorado River water
in certain years, as shown in the table below, to pay back the use of Colorado River water in
excess of entitlement accrued in 2001 and 2002. Under the terms of the agreement, each district
may accelerate payback, at its own discretion. At the beginning of 2004, the U.S. Bureau of
Reclamation’s Inadvertent Overrun and Payback Policy (IOPP) went into effect. The IOPP
requires Colorado River water contractors generally to undertake “extraordinary conservation”
efforts to reduce their use of Colorado River water in order to pay back previous use in excess of
the contractor’s entitlement (Table 1). “Extraordinary conservation” here means measures that
reduce Colorado River water consumptive use “above and beyond reductions that would
otherwise normally occur.”

3∣ Pacific Institute Farm Water Success Stories: Improved Communication, Monitoring, and Measurement
Table 1. Payback Schedule of Overruns for Calendar Years 2001 and 2002,
in Acre-feet
Source: Exhibit C of the Colorado River Water Delivery Agreement of 2003
 Year        IID            CVWD           MWD           Total
 2004        18,900         9,100          11,000        39,000
 2005        18,900         9,100          11,000        39,000
 2006        18,900         9,100          11,100        39,100
 2007        18,900         9,100          11,100        39,100
 2008        18,900         9,200          11,100        39,200
 2009        18,900         9,200          11,100        39,200
 2010        19,000         9,200          11,100        39,300
 2011        19,000         9,200          11,100        39,300
 Total       151,400        73,200         88,600        313,200

In addition to the 73,200 acre-feet of overruns accrued in 2001-2002, CVWD accrued an
additional 2,347 acre-foot payback obligation in 2007. To satisfy its payback obligations,
CVWD implemented an extraordinary agricultural water conservation program in 2004, known
as the ECP. The ECP enabled CVWD to pay back its overrun obligations by June 2009.

CVWD Extraordinary Water Conservation Program
CVWD hired a consultant to develop and implement the ECP, providing a series of conservation
services including “Scientific Irrigation Scheduling,” “Scientific Salinity Management,” and
“Conversion to Micro-irrigation.” CVWD paid for the program; farmers could participate at no
additional charge (D. Parks, Assistant General Manager, Coachella Valley Water District,
personal communication, December 16, 2009). Under the program, the consultant enrolled
willing growers in the district, reviewed their irrigation practices, identified individual fields for
detailed assessment and monitoring, collected and analyzed data from the fields, and created
reports and recommendations. A key element of the program was the assessment of monthly and
annual water deliveries to “entities.” The consultant defined “entities” as the smallest unit of
irrigated land served by an individual water meter, enabling direct measurement of water use per
acre. The consultant then researched the entities’ water use in 1999. The use of entities permitted
comparison of water usage and calculation of water savings, adjusted for differences in
evapotranspiration, between the baseline year of 1999 and current year usage.

To satisfy state and federal payback obligations, repayment could only be claimed for lands
irrigated with Colorado River water that could additionally demonstrate extraordinary
conservation relative to a historic baseline. The ECP only recorded water conserved by irrigators
meeting these two requirements. However, the ECP enrolled some irrigators who did not meet
either or both of these requirements, even though these irrigators’ conservation efforts were not
counted toward payback obligations. For example, the ECP enrolled farmers irrigating with

4∣ Pacific Institute Farm Water Success Stories: Improved Communication, Monitoring, and Measurement
groundwater, rather than Colorado River water delivered via canal, even though conservation of
groundwater did not satisfy payback obligations. As a result, the ECP actually conserved more
water than documented. For example, as shown in the Table 2, in 2004, water conserved on 17%
of the total acreage participating in the ECP did not count toward payback obligations and was
not included in the 19,957 acre-feet claimed as extraordinary conservation that year. Assuming
that the other fields conserved at roughly the same rate suggests that the ECP may have
generated a total of 23,900 acre-feet of conserved water in 2004, and 91,000 acre-feet through
2009.
Table 2. ECP Acreage, 2004
Number Entities Acres % of total
Total enrolled fields 1,051 26,377 100%
with canal delivery 929 258 23,593 89%
with 1999 data 855 230 22,016 83%
Irrigation Scheduling
Although the ECP converted 444 acres to micro-irrigation in 2004, the core elements of the
program were scientific irrigation scheduling and scientific salinity management. Scientific
irrigation scheduling seeks to determine the optimal timing and volumes of water to apply to
each crop. To do this, the consultants:
identified various factors affecting irrigation scheduling, including crop, soil type,
irrigation method, and management characteristics;
measured water use and soil moisture, using multiple soil probes;
measured irrigation rates and uniformity across fields;
measured crop cover, development, stage, and root depth;
monitored fertilizer application and harvesting;
recorded actual irrigation schedules and volumes from program participants; and
summarized crop productivity and water use.
Using evapotranspiration (ET) requirements for specific crops, calculated from CIMIS data, the
consultants used the data acquired from the actions listed above to optimize irrigation schedules.
Historically, irrigators may have over-applied water, to avoid the risk of crop stress and reduced
yield. One of the major benefits of the program’s monitoring and measurement was an improved
understanding of actual crop water requirements (P. Nelson, Vice President, CVWD Board of
Directors, personal communication, December 16, 2009). In 2004, growers with 18,333 acres of
land, or 70% of total acreage enrolled in the program, participated in scientific irrigation
scheduling (most participants enrolled in both irrigation scheduling and salinity management).
For more information on irrigation scheduling, see chapter 3.
Salinity Management
By the time it reaches CVWD, the Colorado River water used for irrigation carries about a ton of
salt per acre-foot. In the absence of surface drainage and under the valley’s high
evapotranspiration rates, these salts can quickly accumulate in crops’ root zones, impairing
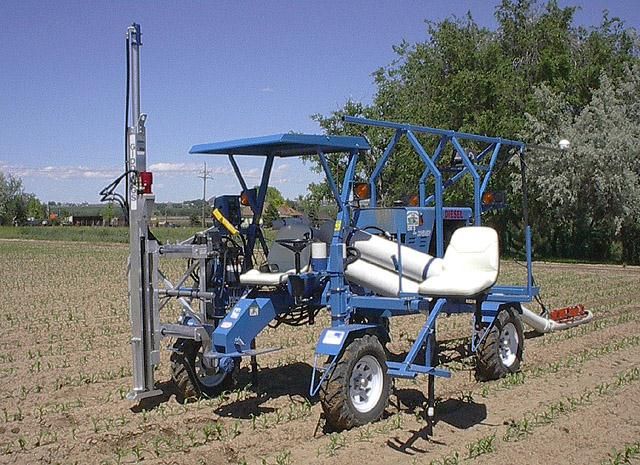
5∣ Pacific Institute Farm Water Success Stories: Improved Communication, Monitoring, and Measurementgrowth and productivity. Irrigators flush, or leach, salts from the root zone every few years, by applying water via flood irrigation or sprinklers. Through precise monitoring of soil salinity and consistent with crop salinity tolerances, irrigators can refine their application of water for leaching, potentially conserving water without affecting crop yield. Through the ECP, the consultant reviewed irrigation and leaching practices to determine which growers might benefit from scientific salinity management. In 2004, the consultants enrolled growers with 784 fields, representing 20,558 acres of land and 78% of the acreage enrolled in the ECP as a whole, in the scientific salinity management program. As part of the program, the consultant: identified fields to be leached that year; evaluated historic leaching practices; determined factors affecting leaching requirements (e.g., crop type, soil texture, salinity of applied water); determined the leaching requirement based on soil salinity and the calculated water requirement; monitored leaching use; and analyzed leaching activities, with additional soil sampling and analysis and a comparison of empirical and predicted values. The ECP enabled growers to refine their application of water for leaching, targeting areas of fields identified as high in salinity. In some cases, this could conserve water, by avoiding untargeted leaching or optimizing leaching volumes, though the ECP did not specifically identify savings resulting from better salinity management rather than better irrigation management. Instead, the program simply determined water conservation by entities in the program generally. To optimize crop production, the consultant would recommend the application of more water for leaching than had been applied historically, if it determined that soil salinity warranted such action. Figure 2. The Coachella Valley Resource Conservation District “Salt Sniffer,” used to measure soil salinity Source: Scott Lesch, U.S. Department of Agriculture The Salt Sniffer collects geo-referenced horizontal and vertical electromagnetic conductivity data at multiple locations across farmers’ fields, enabling the creation of detailed maps of field salinity and identification of problem areas (Figure 2). The Salt Sniffer can also extract soil cores, to depths of 48 inches, for further analysis (Lesh and LeMert 2000). 6∣ Pacific Institute Farm Water Success Stories: Improved Communication, Monitoring, and Measurement
Determining Conservation Volumes
To project total annual extraordinary water conservation, the program assumed a target irrigation
efficiency rate of 92% would be achieved through program components. The consultant
measured actual annual water conservation by calculating a water balance for each participating
entity. The water balance used CVWD delivery records to determine the entity’s water use in the
baseline year of 1999, and then adjusted this 1999 water use for differences in monthly reference
crop ET between 1999 and the program year. The difference between the adjusted 1999 water
use and the measured use in the program year represented the volume of water conserved. The
U.S. Bureau of Reclamation’s Inadvertent Overrun and Payback Technical Committee reviewed
the ECP each year and verified ECP performance with a series of spot checks on 5% of program
acreage. These spot checks included meter readings, field visits, and interviews with irrigators.

Results

        “With the use of the irrigation scheduling we realized water savings
        from 10 to 15 percent, and better crop yields, especially with vegetables.
        The soil moisture monitoring was very accurate, very timely and soil
        sample results were analyzed quickly and efficiently.”
                 - Chuck Schmidt, with Richard Bagdasarian, Inc., headquartered in Mecca and among the
                 Coachella Valley's largest producers of table grapes, citrus, and vegetables

CVWD and its consultant initially projected that the ECP would satisfy the 73,200 acre-foot
payback obligation by 2007. However, limited funding in 2007 diminished the scope of the
program and the number of irrigators that could enroll, delaying full payback until 2009, as
shown in Table 3.
Table 3. Annual Extraordinary Conservation Program water savings, in acre-feet

               CRWDA                             2007
  Year         Schedule        Calculated       Payback        Anticipated
   2004          9,100          19,957                           19,100
   2005          9,100          18,491                           19,100
   2006          9,100          16,608                           17,360
   2007          9,100           7,404                           17,640
   2008          9,200           6,753            2,347
   2009          9,200          3,987*
   2010          9,200
   2011          9,200
  Totals        73,200           73,200           2,347           73,200
 CRWDA & 2007 Total            75,547
*provisional

The consultant’s first objective was to optimize crop yields. In many instances, the consultant
determined that irrigators were applying insufficient irrigation water, or needed to increase the
volume of water applied for leaching, over and above the irrigator’s historic practice. In 2004,
7∣ Pacific Institute Farm Water Success Stories: Improved Communication, Monitoring, and Measurement
for example, 95 of the 230 entities actually increased their water use per acre. However, the
majority of entities conserved water through the ECP. Average water savings in 2004 for the 230
entities was 0.8 acre-feet per acre (Figure 3), representing a 17% reduction in use relative to the
adjusted 1999 baseline. Because many growers participated in both the Scientific Irrigation
Scheduling and Scientific Salinity Management elements of the ECP, conservation data specific
to program or crop type are not available.
50
45
40
35
Number of Entities
30
25
20
15
10
5
0
-5 -4 -3 -2 -1 0 1 2 3 4 5 6 More
Water Conserved (AF/acre)
Figure 3. Water Conserved by entity, 2004
Communications Upgrade
Communication is a critical component of irrigation water delivery. Unlike the pressurized
systems found in homes, where the user can simply open a valve to deliver the desired amount of
water, most deliveries for farm irrigation are gravity-fed and require carefully controlled releases
from canals, laterals, and reservoirs to deliver the desired volume of water to the user, without
spilling water from the end of the system. Such agricultural deliveries require careful planning,
to balance system contents, deliver the water at the desired time, and avoid operational spills. In
CVWD, the zanjero (Spanish for “ditch-rider”) is responsible for matching water orders with
water deliveries, by riding along the canals and laterals and opening and closing gates to release
the appropriate amount of water to fields and irrigators’ water delivery systems.
Irrigators order water at a variety of time scales. Each October, CVWD estimates its water needs
for the coming year and submits this to the U.S. Bureau of Reclamation, which controls releases
from Hoover Dam to meet downstream demands. CVWD also submits weekly water orders, six
days in advance, to account for the time it takes releases from Hoover to flow 293 miles to the
diversion at Imperial Dam, and then another 160 miles through the All-American and Coachella
canals to the district. In 1969, CVWD constructed Lake Cahuilla, a 1,500 acre-foot reservoir that
8∣ Pacific Institute Farm Water Success Stories: Improved Communication, Monitoring, and Measurementprovides some operational flexibility, but in general, CVWD and its zanjeros must balance water
orders with water currently available in the canals and laterals.
CVWD has repeatedly upgraded its water delivery communication and control systems to
optimize deliveries to irrigators while minimizing waste. More than forty years ago, CVWD
centralized operations, enabling staff at headquarters to monitor and control, via telemetry, canal
check gates and lateral gates throughout the district’s 1000-square-mile service area. In 1997,
CVWD increased operational flexibility and efficiency by moving away from fixed water order
and delivery schedules to allowing water orders to be placed and delivered 24 hours a day. This
flexibility benefits farmers by enabling them to schedule water deliveries according to their own,
rather than the district’s, timetable.
Wireless Upgrade
“The improved communications system has had more benefits than
I can list. It used to be that when you were in the field, you wished you
were back at your desk where you could look up information. Now, we
can be in the field and behind the computer at the same time. It makes
it easier for us to do a good job and has improved customer service.
It has truly been a blessing.”
– Eric Urban, Zanjero Supervisor at CVWD
In 2005, CVWD replaced its 25-year-old low-band radio system with an integrated voice and
data trunked radio system, the first system of its kind in California and the first in the area to
employ data subscribers. Implemented largely to improve emergency preparedness, CVWD
quickly realized the potential benefits the upgrade presented to many of its core services,
including water delivery, and took the opportunity to bundle multiple projects with the upgrade.
Although CVWD would not have upgraded its water delivery communications system
independent of the general system upgrade, its success suggests that other districts should
evaluate the potential benefits available when upgrading their communications and data systems.
The upgrade provides secure wireless connectivity between those in the field and the CVWD
control center, allowing real-time communication. Previously, zanjeros had used hand-held
devices to record meter readings. Prior to the shift, information for the day’s water orders were
loaded onto the devices; at the end of the shift, meter readings were unloaded and processed.
This meant that water orders, and changes in water orders, required verbal communication with
the zanjero after the shift began. Since zanjeros were often in the field and away from their
vehicle’s radios, such information often was not conveyed. The old system presented other
drawbacks, including: errors associated with transferring data from the handheld devices at the
end of the shift; billing inaccuracies and disputes due to handwritten changes to orders and other
information on field changes that could not be sufficiently documented; a single on/off
transaction per day, per account; and paper-based infrastructure repair orders written by zanjeros
on their routes that were not effectively communicated to repair crews. Zanjeros had to be in
frequent contact with the control room, to check water levels in canals and laterals and request
changes to gates to facilitate water deliveries and system balancing. Lack of careful balancing
can lead to insufficient water to deliver to fields, or conversely to excess water at the end of the
9∣ Pacific Institute Farm Water Success Stories: Improved Communication, Monitoring, and Measurementline, leading to operational spills. In recent years, CVWD has reported an average of about 1,670
acre-feet per year of such spills, though these are spread over almost 50 separate locations.
With the upgrade, CVWD outfitted each zanjero’s vehicle with a computer and communication
device capable of transmitting water orders and system status in real time. This new system
provides many benefits:
the control room can transmit emergency and last-minute orders directly to the zanjero’s
on-board computer, documenting changes that the zanjero can retrieve when back in the
vehicle;
zanjeros enter meter reads directly into the system, providing immediate updates to the
control room and improving water delivery management;
the system provides real-time data on water elevations in canals and laterals, providing
rapid feedback to the zanjero on water flows and balancing;
maintenance orders are entered directly into the system, expediting maintenance efforts
and decreasing system losses due to neglected repairs;
change orders are entered directly into the system, providing clear documentation that
improves billing and minimizes disputes, increasing revenue for the district;
autonomy of field staff is increased, enabling them to react quickly to changes as needed;
and
water balancing throughout the system is improved, while decreasing waste and spills at
the end of the system.
These upgrades have improved communications with field staff and optimized management of
water deliveries and canal management. The zanjeros have expressed great satisfaction with the
new system, since it provides them with better and faster information on the effects of their water
deliveries on water balancing in the system generally, enabling them to make route sequencing
decisions independently. The new system also affords the zanjeros greater autonomy by releasing
them from the need to repeatedly radio back and forth with the control center. The
communications upgrade is still too recent to have firm data on its affect on the volume of
operational spills or on growers’ productivity. But anecdotal data are promising, and show the
value of flexibility and communication.
Conclusions
CVWD, constrained by a limited water supply and extreme climatic conditions, has long been at
the forefront of water conservation efficiency. Two recent initiatives––the Extraordinary Water
Conservation Program and a communications upgrade––have continued this trend, with
documented water savings in the former and improved management more generally in the latter.
Through the ECP, CVWD conserved more than 75,000 acre-feet of water, at a cost to the district
of about $40 per acre-foot (and at no additional cost to participating irrigators). Although water
savings from the communications upgrade have not yet been quantified, the upgrade has
improved communications between field staff and the district, and benefitted growers by
increasing the flexibility of water deliveries.
10∣ Pacific Institute Farm Water Success Stories: Improved Communication, Monitoring, and MeasurementThese two initiatives demonstrate that improving technology can bring benefits, especially a more rapid exchange of information and targeted information for growers, enabling them to make better decisions. While some elements of these initiatives may not be transferable to other districts, in general the programs could be adapted by growers in other areas, enabling them to improve irrigation scheduling and salinity management, as well as improving flexibility and operational controls in the field. 11∣ Pacific Institute Farm Water Success Stories: Improved Communication, Monitoring, and Measurement
References
Bourre, M. 2006. “Making Ever Drop Count,” RadioResource Mission Critical Communications.
October. Available at www.mccmag.com.

Coachella Valley Water District (CVWD). 2009. 2008-09 Annual Review & Water Quality
Report. 27 pp. Available at
www.cvwd.org/news/publicinfo/2009_annual_review_water_quality_report.pdf.

Coachella Valley Water District (CVWD). 2002. Coachella Valley Final Water Management
Plan. 278 pp. Available at www.cvwd.org/news/publicinfo/Coachella_Valley_Final_WMP.pdf

Coachella Valley Water District (CVWD). 2005. Farm Water Watch Vol. 9. November.
Available at www.cvwd.org/news/fww/11012005_FWW.pdf

International Boundary and Water Commission (IBWC). (2009). A Report on Colorado River
Salinity Operations, Under International Boundary and Water Commission Minute No. 242:
January 1 to December 31, 2007. Available at
www.ibwc.state.gov/Files/Annual_CO_Salinity_Report-2007.pdf.

JM Lord, Inc. 2005-2006. Extraordinary Water Conservation Program: Annual Report. Prepared
for Coachella Valley Water District. On file with author.

JM Lord, Inc. 2004-2009. Proposal for Engineering and Agronomic Services: Coachella Valley
Water District - Extraordinary Water Conservation Program. On file with author.

Lesch, S and R LeMert. 2000. Development of the CVRCD Mobilized Salinity Assessment
Platform. GEBJSL Technology Transfer Announcement. Available at
www.ussl.ars.usda.gov/lcrsan/cvrcd_sniffer.PDF.

Nelson, Peter. December 16, 2009. Vice President, CVWD Board of Directors. 2009. Personal
communication.

Parks, Dan. December 16, 2009. Assistant General Manager, Coachella Valley Water District.
Personal communication.

U.S. Bureau of Reclamation. Annual. Crop and Water Data. Form 7-2045. Lower Colorado
River Region.

12∣ Pacific Institute Farm Water Success Stories: Improved Communication, Monitoring, and Measurement
You can also read