How California's bike budget can triple bicycling by 2020
←
→
Page content transcription
If your browser does not render page correctly, please read the page content below

How California’s bike budget can triple bicycling by 2020
and why it’s a great idea and how much it will cost
Executive Summary
A new federal transportation program has cut dedicated bike/ped funding by a third, but it
maintained the program’s flexibility. The California Transportation Agency has proposed using
that flexibility to actually increase bike/ped funding. However, the increase of approximately 30%
is part of a plan to eliminate a number of long standing bike/ped programs into a larger
consolidated Active Transportation Program (ATP).
The California Bicycle Coalition supports the consolidation of existing programs into the ATP
because it supports the single most important strategy to accomplish our goal of tripling bicycling
by 2020: increasing the state’s investment in bicycling infrastructure. As this report shows, the
ATP’s funding is a small fraction of the $8 billion needed to build the necessary bicycle
networks, but it is an incredibly costeffective investment as this report also shows. The ATP is
a good start, but its size should dramatically increase and its rules should leverage much more
local funding and locallycontrolled funding. These proposals will enable more Californians to
bike and induce millions more bike trips every day.
Eight billion dollars over the next ten years, say, is a small fraction of the nearly $300 billion
expected to be spent on transportation in that time frame, and it will have sensational benefits.
For every $1 million invested in bicycle infrastructure there is a $2.8 million dollar return on
healthcare. Replacing short distance trips (2mile trips account for 40% of all trips in California)
with bike trips could change communities and help achieve our state’s greenhouse gas emission
reduction goals. In communities with safe biking networks bikers shop more frequently, closer to
home, and spend more per capita, partially because 75% of every dollar spent on gas is
dedicated to crude oil.
We propose a number of ways that the state can induce the increase in bicycling investment
necessary to triple the amount of biking in California:
1. Establish an official goal of tripling biking, and require annual reporting.
2. Require transit capital projects to dedicate 1% of funding to strictly bicycle access.
3. Strengthen the complete streets requirement by requiring safe bike accommodations on
every project or a setaside 1% of the budget for bike safety.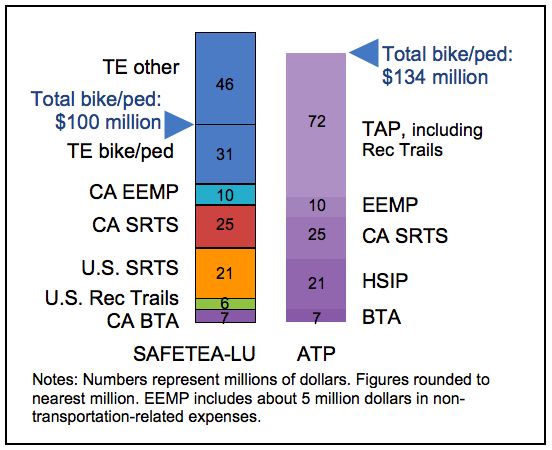
4. Increase the ATP to at least $300 million per year.
We also propose a number of ways the state’s investment can leverage the greatest change on
behalf of more bicyclefriendly communities:
1. Provide some very large grants, in the range of $25$50 million, for communities that are
prepared to develop whole networks that meet certain standards and who are willing to
match state funding with a similar amount of local money.
2. Provide some relatively small grants to projects that are similar to the projects currently
funded by the Safe Routes to School program and the Bicycle Transportation Account.
3. Require the adoption of strong complete streets policies to qualify for state funding.
4. Hire staff at the California Transportation Commission to ensure the success of the
Active Transportation Program.
5. Require the incorporation of best practice in bikeway designs including the use of
protected bikeways.
Introduction
The new federal program for funding transportation presents both threats and opportunities to
our vision of tripling bicycling in California. Moving Ahead for Progress in the 21st Century
(MAP21) reduces the federal setaside for bicycling and walking and broadens the range of
projects that can compete for that setaside. It makes much of that setaside optional. It
eliminates the Safe Routes to School Program. Yet it doubles the size of the Highway Safety
Improvement Program (HSIP) and continues to provide tremendous flexibility in how state and
local government can spend most major funding categories.
In California there is much more opportunity and we can use that flexibility. Our state’s goals to
reduce greenhouse gases are enforced with a law requiring regional planning organizations to
produce transportation plans that will reduce vehicle miles traveled. Most regions have
completed ambitious bicycle plans that illustrate the role of bicycling in their transportation
systems. A history of support for bicycling means that California can increase funding for
bicycling and make the state a world leader in bicycle use.
We are producing this report to show why and how California
should take advantage of this opportunity to enable more
people to bicycle. Tripling the number of trips by bike is
possible, desirable, and the most affordable strategy to meet
our state’s goals. We can accomplish that by 2020 if the
recommendations in this paper are followed.
I. How will California benefit from a tripling of trips by bicycle?
Using the best available mix of data, we estimate that Californians made about 700 million biketrips in 2011, accounting for 1 2 % of all trips.1 To triple bike trips, then, means to induce an
additional 1.4 billion trips per year, or 2.8 million each day. What happens to our state when we
do that is nothing short of sensational.
More bicycling means more freedom of choice in transportation.
California’s traffic congestion is among the worst in the country, with the San Francisco Bay
Area and Los Angeles regions ranking in the top 3 for the most time lost during commute.2
People are forced to sit in this miserable traffic making it worse in the process even though
a large number of them would prefer to be on their bikes. Surveys show that nearly half of
Californians would ride a bike for some of their trips if the streets were safer.3 Giving them that
choice is a smart investment.
More bicycling makes us much healthier in many ways.
Anybody who rides a bike after a hiatus knows this fact: bicycling makes you happier. That’s
visceral proof of the welldocumented health benefits of cycling.4 California residents average 4
minutes of walking or biking each day 5 but need at least 22 minutes of daily exercise to be
healthy, as recommended by the U.S. Surgeon General. Meanwhile Americans spend on
average of 62 minutes per day on car trips 6, half of which are less than
5 miles long! Enabling more people to choose a bicycle for some of
these short trips is a public health priority. If half of the 1.5 to 5mile long
car trips taken by Bay Area residents were made by bike instead, 1 in 7
incidences of diabetes and heart disease would never materialize.
That’s 2,404 people who would avoid premature death from those
7
diseases! Broadly, the benefits of increased physical activity of shifting from driving to bicycling
(3 to 14 months gained) outweigh the effects of increased inhaled air pollution (0.8 to 40 days
lost) and increased traffic accidents (5 to 9 days lost). Put into monetary terms, for every $1
million invested in bike infrastructure returns in $2.8 million in health care savings alone.8
More bicycling means a more sustainable environment.
Considering that 40% of all trips in California are under 2 miles 9, shifting short trips from driving
1
McGuckin, N. (2012). Walking and Biking in California: Analysis of the CANHTS (No. UCDITSRR1213). Counting the
current number of bike trips is very difficult. A variety of surveys including the Census and traffic counts exist, but they each do
an inadequate job differently.
2
Lomax, T., Turner, S., Eisele, B., Schrank, D., Geng, L., & Shollar, B. (2012). Refining the RealTimed Urban Mobility Report
(No. UTCM 110673).
3
Thornton, A. (2010). Climate Change and Travel Choices: Segmentation Study–Interim Report.
4
Pucher, J. R., & Buehler, R. (2012). City cycling. MIT Press.
5
Maizlish, N. A., Woodcock, J. D., Co, S., Ostro, B., Fairley, D., & Fanai, A. (2011). Health CoBenefits and
TransportationRelated Reductions in Greenhouse Gas Emissions in the Bay Area—Technical Report.
6
NHTS 2009
7
ibid
8
Gotschi, T. (2011). Costs and benefits of bicycling investments in Portland, Oregon. Journal of Physical Activity and Health,
8(1), S49S58.
9
NPTS 2009to biking will play a pivotal role in achieving the reductions required by SB 375. Approximately 25% of greenhouse gas emissions (GHG) from vehicles occur as the car is warming up.10 From an emissions standpoint, this means the savings from 10 people biking their 4mile commute (round trip) instead of driving will reduce four times as many GHG emissions than if a single person switched one 40 mile commute to a bike. More bicycling creates jobs and makes our communities richer. Investing in bike infrastructure creates more jobs than investing in other kinds of transportation infrastructure. Nationally, 11.4 jobs are created for every $1 million invested, compared to just 7.8 jobs created with that same investment in roadonly projects.11 Furthermore, with 75¢ of every dollar spent on gasoline dedicated to the cost of crude oil, a mostly imported resource;, expenses on gas do not benefit the local community. People who use less gasoline have more money to spend in their local economy. Shoppers who travel by bike spend more money per capita, shop closer to home, and visit stores more frequently than their driving and transitriding counterparts.12 Bike infrastructure increases sales on a street.13 II. How much funding do we need? There are few government expenditures that provide such benefits in health, happiness, environment, and economy for such little cost. Yet California is spending less than a little, i.e. less than 1% of its transportation budget, on bikes. If the Secretary of California’s Business, Transportation & Housing Agency Brian Kelly is sincere in his assertion that bike infrastructure “has to be central to our investment [in transportation]”14 for all the reasons cited above, how much should he choose to spend on bicycle infrastructure? There are a number of ways to estimate how much funding is necessary to triple biking by 2020. One way is to consider the rate at which bike infrastructure actually generates bike trips. We have three examples where the increase in bike trips was measured relative to the level of investment: Portland, OR; San Francisco, CA; and the four cities in the NonMotorized Transportation Pilot Program. For every $1 million of state and federal funding invested in bike infrastructure between 1995 and 10 http://www.fhwa.dot.gov/environment/air_quality/publications/fact_book/page15.cfm; using 4 miles per day 11 GarrettPeltier, H. (2011). Pedestrian and Bicycle Infrastructure: A National Study of Employment Impacts. Amherst, MA: Political Economy Research Institute. Local figures vary from the national average but tend to confirm the ratio of jobs created by bke infrastructure compared to car infrastructure. A study in Santa Cruz showed 8.5 jobs created per million dollars invested in bike infrastructure compared to 5.1 jobs for roads alone, and a study in Baltimore showed 14.3 jobs created by the construction of bike infrastructure. 12 Transportation Alternatives. (2012) East Village Shopping Survey: A Snapshot of Travel and Spending Patterns of Residents and Visitors in the East Village.; Clifton, K. J., Morrissey, S., & Ritter, C. (2012). Exploring the Relationship Between Consumer Behavior and Mode Choice. TR News, (280). 13 NYC DOT found that protected bikeways had a significant positive impact on local business strength. After the construction of a protected bicycle lane on 9th Avenue, local businesses saw a 49% increase in retail sales. In comparison, local businesses throughout Manhattan only saw a 3% increase in retail sales. A Toronto study and a San Francisco study found separately that customers arriving to a shopping district by bike spend more in a month (although less per trip) than customers arriving by car. 14 Brian Kelly speaking to stakeholders in a California Assembly hearing room, April 2013.
2010, Portland increased bike commute share by 98 trips per day.15 San Francisco estimates that it needs to spend $200 million to (roughly) triple its bicycle mode share from 3% to 10%.16 Extrapolated to California, that equates to a $9 billion requirement. Finally, the 2007 pilot program for nonmotorized transportation funded four regions to experiment with bike and pedestrian infrastructure. On average, they increased total biking after just 3 years by 101 trips per day per $1 million invested in bicycling programs.17 Extrapolated and translated to California, these examples indicate that we would need to spend from $7 billion to $9 billion to achieve a tripling in bicycle use. Another way to estimate the need is to examine the existing plans for building complete bicycle networks.18 Building out the bike networks in the nine larger metropolitan regions in the state that collectively account for half of the state’s population would cost about $4.6 billion. Doubling that to cover the whole state yields an estimate of $9.2 billion. Remarkably, these different methods of estimating the cost yield similar results ranging from $7 billion to $9.2 billion. Therefore, with reasonable confidence, we estimate that the cost of tripling bicycling in California is about $8 billion, or about $1 billion per year through FY 2021. III. Where do we get $1 billion/year? With an annual expenditure on transportation of $27 billion every year, there is no shortage of funds to make California bicyclefriendly. It’s just a matter of priority. A hodgepodge of sources funds transportation in California: gas taxes, sales taxes, transit fares, and general fund revenues are the most prominent. About half 19 of those funds come from the state (including federal funds); the other half are generated locally. While bicycle infrastructure funding comes mostly from state and federal sources, that is poised to change. Local elected officials see the benefits in their shopping districts and hear from their constituents about how a bike path to a school changed their life. Local sales taxes routinely dedicate as much as 10% of their budgets to walking and bicycling improvements. Development rules can require contributions to bicyclefriendly streetscape improvements. Local bonds and other general fund contributions can fund bicycle safety improvements. There are prospective revenue sources, too, including vehicle license fee 15 See http://blog.bikeleague.org/content/costeffectivenessactivetransportationinvestments. In Portland’s case, by the way, bike infrastructure is 15 times more effective than investments in public transit at encouraging people to switch from driving. Only 6.2 transit trips per day and 8.7 car trips per day were generated per million dollars of spending on transit and auto infrastructure, respectively. 16 In San Francisco’s case, the 150,000 new daily bike trips facilitated by the bike network are 40 times more costeffective than an ongoing investment of nearly $2 billion in a subway that will generate 35,000 new daily transit trips!. 17 This figure is based on an educated approximation that 60% of the relatively undifferentiated expenditures were for bicycling infrastructure, and it includes expenditures in outreach and planning in additional to infrastructure costs. 18 We disregard the current assessment of the California Transportation Commission because it relied on old Regional Transportation Plans developed before SB375’s requirement. That assessment showed a $4.5 billion need over the next ten years (or $3.15 billion through 2020). Looking at newer plans, the Safe Routes to School Network found that the bicycle and pedestrian infrastructure need over the next ten years is closer to $18 billion. 19 53% according to the CTC
increases or even local gas tax increases. If you believe that change starts at the local level and
percolates up, then the future is very good for bicycling.
Still, the state’s role is crucial. California creates accounts set aside for bicycling and the rules
for flexible funds could make bicycle infrastructure more or less eligible for those funds. Local
officials prioritize those projects whose funding is matched by state contributions, even in
communities whose support for bicycling is strong. Other communities rely exclusively on state
funding. Without substantial state funding set aside for bicycling improvements, we cannot
expect local governments to spend what is necessary to triple bicycling and meet the state’s
goals for climate, health, transportation, and the economy. Furthermore, the state itself owns a
number of roads that require investment to make them truly safe for bicycling.
This section of the report recommends two sets of measures: proposals to improve the eligibility
of bicycle projects for flexible funds, and proposals to increase the amount of funding dedicated
specifically to bicycling. Together, these proposals will amount to the provision of about $1 billion
per year for bicycling infrastructure, and Californians will reap the benefits of a tripling in bike
use.
Proposals to improve the use of flexible funds
1. Establish an official goal of tripling bicycle mode share by a specific date, and require the
Governor to report annually on progress toward the goal. This will encourage Caltrans to
take seriously the goal of increasing cycling and propose measures, including increased
funding, if progress toward the goal is behind schedule.
2. Dedicate portions of transit capital projects to bicycle and pedestrian access to the
stations. At least 1% of transit capital projects should be dedicated to bicycling access to
transit (not including 1% that also ought to be set aside for pedestrian access). The
budget includes $1.06 billion for “mass transportation” and $100 million for “blended
system projects” (regional components of the highspeed train system). Setting aside 1%
of those funds for bicycling access would provide $11.6 million.
3. Strengthen the Complete Streets requirement by requiring a contribution to bicycle safety
if bicycle safety cannot be accommodated in a streets project. Caltrans Complete
Streets policy already requires all project developers to consider accommodating safe
travel by road users on bicycles and those walking. However, Caltrans does not provide
guidance on when that consideration must result in accommodations or when providing
for safe bicycle travel is too expensive in any particular case. To provide clearer
guidance, Caltrans should require that projects that do not provide for safe bicycling
accommodations must set aside 1% of the project budget for bicycle safety. This is the
next logical step in Complete Streets funding, first set inmotion by Caltrans Deputy
Directive 64R1.
4. Increase the Active Transportation Program funding to at least $300 million per year. The
governor’s proposed 20132014 budget sets aside $134 million for “active transportation”
in a new account for which broad categories of projects are eligible: bicycling, walking,Safe Routes to School, Recreational Trails, and more. This is not a “bicycle” setaside,
per se, but at least half of these funds are likely to support safe bicycling networks. Later
in this report we discuss ways in which the ATP can be programmed to most effectively
promote the kinds of infrastructure improvements that will triple the amount of bicycling in
California. Where will this additional $170+ million come from?
a. Take a ‘green scissors’ approach to highway expansion projects and flex the
savings into active transportation. The bypass of Willits costs more than $197
million while meeting none of the state’s transportation goals. While the project
shouldn’t be built at all, value engineering could still save millions. Finding savings
amounting to just 2% of the state’s $9.6 billion budget for highways and local
assistance would generate $192 million per year, practically the entire amount
needed.
b. Dedicate 10% of overall Cap and Trade revenues to bicycling projects (see
below), and 50% of transportationrelated capandtrade revenues. Cap and
Trade, the carbon trading market inaugurated this year, will provide a robust
source of funding in future years to combat climate change. Increasing bicycling
trips reduces greenhouse gas emissions directly and indirectly, by enabling
potentially huge numbers of people in relatively urban areas to shed car
ownership. Furthermore, investments that provide “cobenefits” in addition to
greenhouse gas emission reductions are supposed to have priority, and no other
investment provides as many additional benefits! Ten percent of revenues in
20132014 amounts to $50 million. In two years, California should invest $100
million each year from capandtrade revenues.
c. Increase the portion of HSIP funding flexed to the ATP. The Federal Highway
Safety Improvement Program (HSIP) asks states to identify safety hazards and
projects that will mitigate those hazards. In MAP21, Congress doubled HSIP.
With twice the funds, Caltrans can set aside a portion of HSIP funds for bicycle
safety, and request proposals dedicated specifically for mitigating safety hazards
posed to bicycle riders.
IV. How should it be spent?
California’s “Bicycle Transportation Account” (BTA) is one of the few funding sources in the
country exclusively for the “functional commuting needs and physical safety of all bicyclists.”
Even more important than the funding it has provided for bicycle improvements throughout
California, its requirement that local agencies must have complete bicycle plans to be eligible for
its funding prompted local agencies to plan how bicycling could be an integral part of their
transportation systems. The BTA is a success story. Yet its promise was offset by the reality of
its paltry funding level. A mere $7.2 million per year (about onetwentieth of one percent of the
state’s transportation budget) was not enough to make bicycling a practical option for most
Californians. A good strategy to meet our goal of tripling bicycling will be to dramatically increase
funding in the Bicycle Transportation Account.However, Governor Brown’s 20132014 budget proposes eliminating the Bicycle Transportation
Account as part of a consolidation of it and other small bike/ped funding sources into a much
larger fund called the Active Transportation Program. The ATP combines the BTA with the
federal and state Safe Routes to School programs, the Recreational Trails Program, the federal
Transportation Alternatives Program (the TAP replaces Transportation Enhancements from
SAFETEALU), and the Environmental Enhancement and Mitigation program.
This consolidation is a painful challenge to the status quo of funding bicycle and pedestrian
projects. By eliminating Safe Routes to School, for example, we could lose the “social
infrastructure” built up around efforts to make school zones safer. Thousands of Californians
have been brought into our movement as they have learned about active transportation and
safety. The BTA’s funding, though miniscule, means a great deal to small communities where a
single bike lane can spark renewed interest in bicycle safety and lead to much greater things in
the future. The Recreational Trails Program brings parks advocates to the table. These are
elements of the existing programs that should not be lost. The existing proposal for the ATP
does not explain how these needs would be met without these programs and is therefore difficult
to support.
On the other hand, the consolidation of these programs has some positive impacts, too, mostly
because it creates a sizable fund:
1. As indicated in the chart below, the sum total
dedicated to bike/ped funding is increased by
about 34%. This is achieved mostly by the
transfer of 100% of the federal Transportation
Alternatives Program (TAP) into the ATP. Its
predecessor, Transportation Enhancements,
provided only about 40% of its funding for
bike/ped projects.
2. The fund’s larger size creates a bigger political
profile. Policy makers are more likely to pay
attention to a $134 million ATP than they are a $7.2 million BTA. For example, a
campaign to increase the size of the ATP by 50%, if victorious, will win $67 miIlion more
for bike/ped safety, while a campaign to increase the BTA by an equivalent margin will
just win $3.6 million.
3. Its larger size means we are no longer restricted to funding small projects here and there.
We can fund large projects that will transform communities. The consolidation gives us
the chance to “start from scratch” and completely revise how we invest in bicycle
infrastructure.
Because increasing spending on bicycle infrastructure is paramount to the success of
our goal, CalBike supports the consolidation of funds into the ATP, contingent upon the
development of funding guidelines for the ATP that take advantage of this historicopportunity. CalBike makes the following recommendations for programming the ATP,
currently projected to be $134 million, with 50% kept by the state, 40% going to MPOs in major
metropolitan areas and 10% set aside for rural areas.
Now is the time to reiterate an earlier recommendation: increase the fund to at least $300 million.
For the portion of funds provided to MPOs, impose the following requirements.
1. In MPOs with many smaller municipalities, score higher joint applications by multiple
cities. Encourage cooperation and network connections across city boundaries.
2. MPOs and cities applying must have suitable Complete Streets policies to be eligible for
funding. These policies must require a robust consideration of Complete Streets with a
transparent and public process for opting out and (as noted) a requirement that funds
equal to 2% of a project’s total funds be deposited into the region’s fund for improving
bicycle and pedestrian safety. For MPOs who have not yet completed their SCS or have
not adopted a Complete Streets policy, the state will administer their ATP funds until it is
adopted.
For the portion of funds kept by the state, adopt the following recommendations.
1. The California Transportation Commission should establish a new, highlevel staff
position to manage the Active Transportation Program so that it has the best chance to
meet its goals.
2. Narrow the eligibilities in the ATP to just walking and bicycling improvements. Eliminate
landscaping from eligibility. This may require removing funding intended to support the
Environmental Enhancement & Mitigation Program from the ATP reducing its size by
10%. We support that. This would reduce the state portion of the funding to $62 million.
3. Create new formulas for evaluating whole bicycling networks regarding their safety,
convenience, and accessibility to disadvantaged communities.
4. Funding guidelines should include updated bicycle plan requirements to call for specific
outcomes in bicycle safety, accommodation and mode share. Current rules merely
require that certain issues be addressed.
5. Ensure the adoption of updated designs including protected bikeways whenever
necessary.
6. Convene highlevel meetings of nongovernmental stakeholders including but not limited
to the California Bicycle Coalition, the Safe Routes to School National Partnership, the
Rails to Trails Conservancy, and California Walks with the goal of developing new
ways of funding bicycling and walking infrastructure using the funding provided by the
ATP. The specific goals will be to preserve the elements of existing programs we want to
keep and institute new programs that lead to dramatic increases in bicycling and walking
in California communities. Specifically, we recommend that this committee address the
following questions:
a. How can the ATP preserve the noninfrastructure schoolbased education andoutreach that has proven so successful in changing mode share of children?
b. What is the best way for the ATP to fund infrastructure to improve traffic safety
around schools?
c. What is the potential for expending very large grants of $25$50 million on
complete communitywide bicycle networks emphasizing gap closures and levels
of safety and lowstress convenience that will attract significant numbers of
people to bicycling?
V. Summary
The key “positions” that we hold to in our discussions and advocacy are as follows:
1. Ensure the ATP is fully funded to $124 million (without the EEMP) and that its eligibilities
are narrowed to active transportation projects;
2. Figure out how to have a call for projects right away because the delay is badly hurting
our communities' ability to build safe infrastructure;
3. Figure out how to preserve the benefits of the Safe Routes to School Program
(especially the noninfrastructure portion), the Recreational Trails Program, and the
Bicycle Transportation Account (small projects for small communities)
4. Implement the program well, with a dedicated staff person at the CTC and a
stakeholderled process to develop new guidelines for the ATP;
5. Increase the size of the ATP every year by 1050%.
These proposals will enable more Californians to bike and entice millions more bike trips every
day. The benefits are tremendous: better health, a cleaner environment, and prosperous
communities. To realize these benefits, we must provide a serious level of funding about $1
billion per year from all sources instead of the paltry token funding currently provided. There
are plenty of sources for that funding among the existing $27 billion currently expended on
transportation and from new sources. Funding should continue to be spent on existing small
projects like single bike paths and lanes and safe routes to school projects, and this funding
should be supplemented with major grants to communities to build whole networks. Early
investments in bicycle infrastructure in the range of $25$100 million will illustrate the benefits
and spark a renaissance in bicycling accommodation in California.You can also read