Dynamic modelling of the climate change impact in the Conchos River basin water management Modelación dinámica de los efectos del cambio climático ...
←
→
Page content transcription
If your browser does not render page correctly, please read the page content below
2019, Instituto Mexicano de Tecnología del Agua
                                                           Open Access, license CC BY-NC-SA 4.0
                                                           (https://creativecommons.org/licenses/by-nc-
                                                           sa/4.0/)

                                                              DOI: 10.24850/j-tyca-2019-01-08
                                                                                                     Articles

 Dynamic modelling of the climate change impact in the
       Conchos River basin water management
        Modelación dinámica de los efectos del cambio
       climático en gestión del agua en la cuenca del río
                            Conchos

Polioptro F. Martínez-Austria1
Alberto Vargas Hidalgo2
Carlos Patiño-Gómez3

1
 Universidad de las Américas Puebla, Puebla, México,
polioptro.martinez@udlap.mx, ORCID: 0000-0002-9565-1708
2
    Consultor, México, alberto.vargasho@udlap.mx
3
 Universidad de las Américas Puebla, Puebla, México,
carlos.patino@udlap.mx

Corresponding autor: Polioptro F. Martínez-Austria,
polioptro.martinez@udlap.mx

Abstract
In the last decades there have been some deficits in water deliveries
that Mexico must make to the United States under the Water Treaty
between the two countries. Population growth and the effects of climate
change make possible foresee that the difficulties will increase in the
future. This text analyzes the observed changes in rainfall in the basin,
and a dynamic model is developed to estimate the effects of climate
change on the water balance of the Conchos river basin, which
contributes 87% of the amount of water established as Mexicans
commitments in the Treaty. The results of three scenarios are shown
and the effects on water availability in the basin are exposed. A
sensitivity analysis is presented, with the Montecarlo method, regarding
Tecnología y ciencias del agua, 10(1), 207-233. DOI: 10.24850/j-tyca-2019-01-08
                                                                                                             207
2019, Instituto Mexicano de Tecnología del Agua
                                                           Open Access, license CC BY-NC-SA 4.0
                                                           (https://creativecommons.org/licenses/by-nc-
                                                           sa/4.0/)

the main effects of climate change in the basin. To analyze the effects
on irrigation, the main use of water in the basin, a adaptive dynamic
model and its results are also presented. Finally, the expected effects on
future availability are concluded, and general recommendations are
made for adaptation to climate change.
Keywords: Transboundary river basins, United States-Mexico water
treaty, climate change, dynamic modelling, international waters
management, Conchos River basin.

Resumen
En las últimas décadas ha habido algunos déficits en las entregas de
agua que México debe realizar a los Estados Unidos en virtud del
Tratado del Agua entre los dos países. El crecimiento de la población y
los efectos del cambio climático hacen posible prever que las dificultades
aumentarán en el futuro. Este texto analiza los cambios observados en
la precipitación en la cuenca, y se elabora un modelo dinámico para
estimar los efectos del cambio climático en el balance hídrico de la
cuenca del río Conchos, que aporta el 87% de la cantidad de agua
establecida como compromisos mexicanos en el Tratado. Se muestran
los resultados de tres escenarios y se exponen los efectos sobre la
disponibilidad de agua en la cuenca. Se presenta un análisis de
sensibilidad, con el método de Montecarlo, respecto de los principales
efectos del cambio climático en la cuenca. Para analizar los efectos en la
irrigación, principal uso del agua en la cuenca, se presenta también un
modelo dinámico adaptivo y sus resultados. Finalmente, se concluyen
los efectos esperados sobre la disponibilidad futura, y se hacen
recomendaciones generales para la adaptación al cambio climático.
Palabras clave: cuencas transfronterizas, Tratado de agua Estados
Unidos-México, cambio climático, modelación dinámica, gestión de
aguas internacionales, cuenca del río Conchos.

Recived: 21/11/2018
Accepted (invitation): 21/11/2018

                                            Introduction

Tecnología y ciencias del agua, 10(1), 207-233. DOI: 10.24850/j-tyca-2019-01-08
                                                                                                             208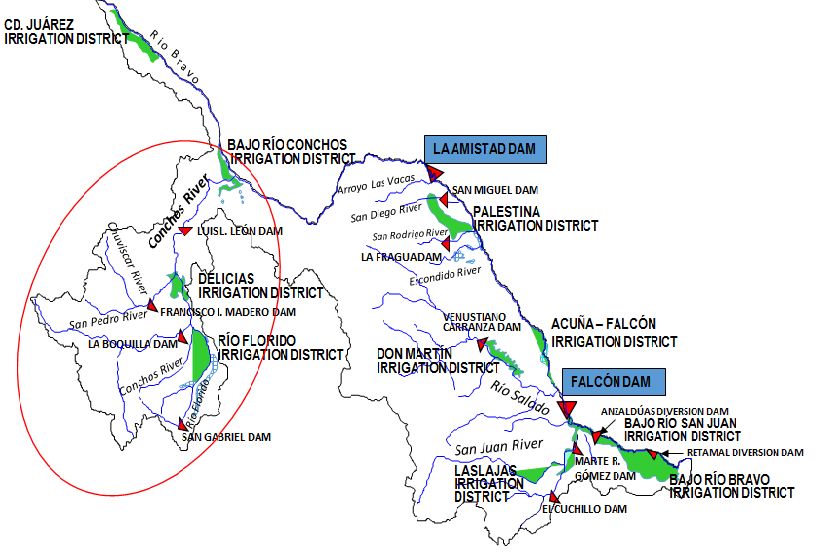
2019, Instituto Mexicano de Tecnología del Agua
                                                           Open Access, license CC BY-NC-SA 4.0
                                                           (https://creativecommons.org/licenses/by-nc-
                                                           sa/4.0/)

The United States and Mexico share one of the largest basins in North
America: the Rio Bravo basin (as known in Mexico) or the Rio Grande
basin (as known in the United States). The total area of this basin is
444,560 km2, 229,796 of which are in the territory of the United States
and 214,764 in Mexico. Part of the main stream of the Bravo River is
also the border between the two countries, with a length of 2,000 km,
along which major population centers are located. The basin is
characterized by semiarid conditions with a very high climate variability
and recurrent droughts.
Due to its demographic and economic development, intensive water use
in the basin has led to a condition of water stress (Aparicio, Ortega,
Hidalgo, & Aldama, 2009). In addition, the expected effects of climate
change will produce a decrease of available water volumes because the
negative anomaly of the precipitation, which, together with demographic
and economic trends, stands as one of the major future challenges in
water management in this international basin. In fact, in recent
decades, Mexico has faced increasing difficulties to meet water rights on
its territory and, as consequence, to deliver the total volume committed
to the United States.
In 1944, both countries signed the Distribution of International Waters
Treaty between the United States of Mexico and the United States of
America (Mexico-USA, 1944, February 3). Under the Treaty, Mexico
receives water from the United States from the Colorado River basin
and, in return, shares water with the United States from the Rio Grande
basin. Volumes from the Rio Grande basin owned by the United States,
with origin in the USA or in the Mexican basin, are stored in the
international Amistad and Falcon dams, in which each country has a
useful capacity assigned.
The Treaty’s provisions for the distribution of water from the Rio Grande
basin establish that all waters draining inside the territory of the United
States belong to that country, and Mexico, by its part, is committed to
sharing with the US part of the waters draining from its territory to the
international mainstream. The volume committed by Mexico is of at
least 431.72 million cubic meters on an annual average basis, in cycles
which are counted every five years, which means that Mexico must
provide the United States with a minimum volume of 2.1586 x 10⁹ cubic

Tecnología y ciencias del agua, 10(1), 207-233. DOI: 10.24850/j-tyca-2019-01-08
                                                                                                             209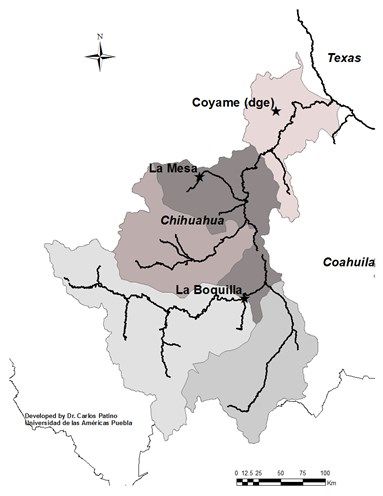
2019, Instituto Mexicano de Tecnología del Agua
                                                           Open Access, license CC BY-NC-SA 4.0
                                                           (https://creativecommons.org/licenses/by-nc-
                                                           sa/4.0/)

meters every five-year cycle. In recognition of the high climatic
variability in the region, Mexico can cover that volume in any order
within the five-year period.

                Figure 1. Rio Bravo Basin. Rio Conchos Basin in red.

The Treaty also provides alternatives for cases of extraordinary
precipitation or drought. In the case of extraordinary rainfall, the Treaty
states that whenever the capacities assigned to the United States in the
international dams were filled, all debits shall be considered fulfilled and
the water accounting cycle is terminated, and a new one begins. For this
reason, there have been treaty cycles with a duration of less than five
years.
On the opposite situation, that of drought, when the committed volume
of water delivery of the Mexican basin could be not delivered to the
United States in a cycle of five years, the Treaty provides that: ―in the
event of extraordinary drought or serious accident to the hydraulic
systems [in the Mexican tributaries] any deficiencies existing at the end
of the aforesaid five-year cycle shall be made up in the following five-

Tecnología y ciencias del agua, 10(1), 207-233. DOI: 10.24850/j-tyca-2019-01-08
                                                                                                             210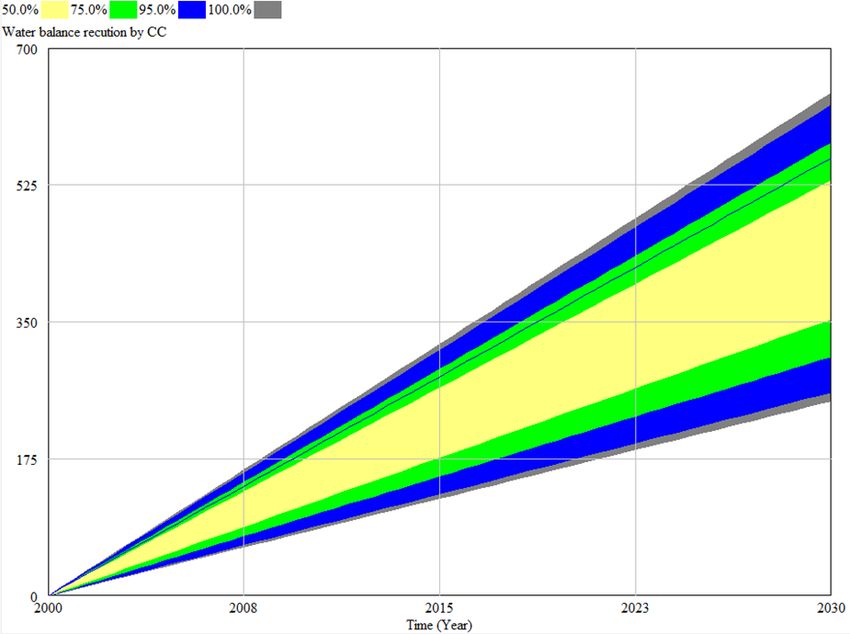
2019, Instituto Mexicano de Tecnología del Agua
                                                           Open Access, license CC BY-NC-SA 4.0
                                                           (https://creativecommons.org/licenses/by-nc-
                                                           sa/4.0/)

year cycle‖, with water from the same tributaries considered in the
Treaty.
For implementing the Treaty and overseeing the fulfilment of
obligations, both countries created a binational institution with
international character, named the International Boundary and Water
Commission (IBWC), which is also in charge of the resolution of conflicts
that may arise as result of the Treaty and its provisions (Article 2 of the
Treaty). Another key aspect of the Treaty is the possibility of sign "acts"
that establish the agreements reached within the IBWC, which, if not
challenged by any of the governments within thirty days, become
binding (Article 25 of the Treaty). This mechanism has greatly facilitated
the water management between the two countries, especially in
conditions of water scarcity.
The construction of the Amistad and Falcon international dams, in 1953,
gave start to the water delivery scheme in five-year cycles. The first
four cycles, from 1953 to 1972, ended with small deficits, that were
covered by Mexico. Once the operation of the hydraulic infrastructure
had been well established, during the following twenty years there were
no major difficulties in delivering water from Mexico to the United
States. However, since the 1992–1997 cycle, important deficits have
been occurring recurrently. That cycle, for example, ended with a deficit
of 1.262 billion cubic meters, equivalent to 58% of the total, and the
1997–2001 cycle ended with an even greater deficit of 1.935 billion
cubic meters, nearly 90% of the total five-year contribution.
Deficits in delivering water from Mexico to the United States during
recent five-year cycles have caused major conflicts between
communities of both countries as well as between local, state and
national authorities, which have required the increasingly frequent
intervention of the US Department of State and the Secretariat of
Foreign Affairs of Mexico (i.e. Texas Center for Water Policy, 2002 and
Rubinstein, 2015). In 2005, Texan farmers sued the Mexican
government, within the framework of International Centre for
Settlement of Investment Disputes (ICSID), for alleged NAFTA violations
(ICSID, 2007), in relation with the last drought and deficit delivery. The
complaint did not proceed, but it is a clear indication of the level that
the water dispute between Texas and Mexico has reached. So far, these
conflicts have been resolved through the participation of society,
governments, and binational institutions that both countries have

Tecnología y ciencias del agua, 10(1), 207-233. DOI: 10.24850/j-tyca-2019-01-08
                                                                                                             211
2019, Instituto Mexicano de Tecnología del Agua
Open Access, license CC BY-NC-SA 4.0
(https://creativecommons.org/licenses/by-nc-
sa/4.0/)
created to address issues of binational interest on their borders
(Martinez-Austria, Derbez, & Giner, 2013; Chavez, 1999).
However, the difficulty of water allocation continues to grow. Even
without climate change, considering only population growth in the
region, the volume of renewable water per capita in the Mexican side of
the basin is now just 1,063 m3/person/year, placing it on the edge of
extreme scarcity (Conagua, 2014).
Moreover, under the Treaty, Mexican contributions to the United States
cannot come from any of the tributaries of the Rio Grande, but only
from the Conchos, San Diego, San Rodrigo, Escondido, and Salado
rivers or from the Arroyo de las Vacas Streem. Of these tributaries, the
Conchos River delivers 87% of the total water availability. Hence its
importance for both, social development of the downstream Mexican
basin, and for complying with the water contributions to the United
States.
On the other hand, the Conchos River basin is characterized by the
periodic occurrence of droughts and high climate variability.
Unfortunately, the history of droughts in Mexico has very little
information from those recorded in the northern region of Mexico (i.e.
Florescano, 2000; Ortega Gaucin, 2013), due mainly to the fact that
these territories were found depopulated or with small populations up
until the late nineteenth century, when the first large urban settlements
were developed. However, it is possible to reconstruct droughts over
long periods of time using proxy data, such as the study of tree rings.
For the state of Chihuahua, where the Conchos River basin is located,
Cerano-Paredes et al (2009) used a series of tree rings from the natural
reserve known as Cerro El Mohinora located in the basin of the Florido
River, a tributary of the Conchos River in the upper area of Chihuahua,
on the border with the states of Sinaloa and Durango. This is the region
of the basin where most of the precipitation occurs. With this technique,
Cerano-Paredes et al (2009) reconstructed the series of precipitation of
the past 350 years. They found intense drought during the 1698-1718,
1785-1786, 1798, 1807, 1908, 1935, 1970 and 1994-2005 periods. The
stages of more intense droughts on record coincide with historical data
chronicled from their effects on the society of the time.
Data analysis and methodology
Tecnología y ciencias del agua, 10(1), 207-233. DOI: 10.24850/j-tyca-2019-01-08
2122019, Instituto Mexicano de Tecnología del Agua
Open Access, license CC BY-NC-SA 4.0
(https://creativecommons.org/licenses/by-nc-
sa/4.0/)
While proxy series analysis allows observe trends in a very long term,
this type of analysis does not permit sufficiently accurate analysis of
rainfall trends and variability, especially in a climate that may have
changed in recent decades. Additionally, the series of tree rings studied
by Cerano-Paredes et al (2009) correspond to the region with the
highest precipitation in the basin, and are hardly representative of the
rest, which is a markedly arid zone. In this case, the direct study of
historical series in various areas of the basin is required.
For a study of recent historical rainfall trends in the basin, the
Standardized Precipitation Index (SPI) is being used, which is a method
used and recommended by various renowned meteorological and
research centres (Hayes, Svoboda, Wall, & Widhal, 2011). According to
the observed SPI value, the actual precipitation could be characterized,
as shown in Table 1, from extremely wet (SPI ≥ 2) to extremely dry
(SPI ≤ -2).
The SPI can be calculated in different periods, the most frequently used
are one, three, six, and twelve months. Each of these periods have a
different physical meaning. SPI values of one and three months reflect
the condition of rainfall in very short periods. They can be used to
identify the onset of drought, or to determine the effects of a significant
deficit in short periods; for example, during the planting season or the
flowering of crops. Caution is needed in the interpretation of these
parameters in regions where low rainfall is normal during the dry
season. The SPI at six months is significant to identify variations in
precipitation between stations, and SPI for twelve months can be used
to identify droughts of long duration. Moreover, if an SPI value of
drought occurs during the rainy season, it can be a signal of a period of
drought that will have important impacts on society.
Table 1. Standardized Precipitation Index and wet or dry conditions
(WMO, 2012).
Standardized
Wet or dry
Precipitation
conditions
Index
Tecnología y ciencias del agua, 10(1), 207-233. DOI: 10.24850/j-tyca-2019-01-08
2132019, Instituto Mexicano de Tecnología del Agua
Open Access, license CC BY-NC-SA 4.0
(https://creativecommons.org/licenses/by-nc-
sa/4.0/)
2.0 and more Extremely wet
1.5 to 1.99 Very wet
1.0 to 1.49 Moderately wet
-0.99 to 0.99 Near normal
-1.0 to -1.49 Moderately dry
-1.5 to -1.99 Severely dry
-2 and less Extremely dry
In this paper, we use the SPI trend analysis to study the recent
precipitation tendency, and determine if there are signals of climate
change effects on the basin, as the general circulation models suggests
for the region.
Once the recent trends of precipitation are determined, it is necessary to
establish possible future scenarios. Complex systems, such as a
drainage basin, are subject to high uncertainty, so one of the most
widely applied techniques for modelling the future are dynamic
simulators, which allow to study and predict the behaviour of the system
under different possible scenarios (Simonovic, 2009). There are several
computer systems designed specifically for systems simulation. In this
research, Vensim has been used, which is one of the most widely used
software for the modelling of complex systems, in general, and for water
resources management in particular (i.e. Goncalves & Giorgetti, 2013
and Abadi Khalegh, Shamsai, & Goharnejad, 2015).
The dynamic simulation model will be used to assess the change over
time of the water balance as it is affected by changes in the governing
variables, mainly population, temperature, and water supply and
demand. In order to compare with endorsed data, the water balance will
be calculated using the official procedure set by the National Water
Commission of Mexico, that is the Mexican Official Standard NOM-011-
Conagua-2015, that establishes the specifications and method for
determining the annual average water availability (Comisión Nacional
del Agua, 2015). According to this standard, the average annual
availability is given by the equation:
(1)
Tecnología y ciencias del agua, 10(1), 207-233. DOI: 10.24850/j-tyca-2019-01-08
2142019, Instituto Mexicano de Tecnología del Agua
Open Access, license CC BY-NC-SA 4.0
(https://creativecommons.org/licenses/by-nc-
sa/4.0/)
Where Dm is the average annual surface water availability in the basin,
Ve is the average annual runoff volume of the basin toward downstream,
and Vc is the volume committed downstream.
The Ve volume is calculated by the following equation:
(2)
Where:
Vaa = Average annual runoff volume from the catchment upstream
Vn = Annual average volume of natural runoff in the basin
Vr = Annual volume of returns of the various water uses
Vi = Volume of water imported from other basins
Vex = Annual volume of water exported from the basin to other basins
Da = Annual volume of surface water consumption, i. e. water demand
for different uses
Vev = Annual volume of evaporation from reservoirs
Vd = Annual average volume variation of reservoir storage.
This equation, seemingly simple, becomes complicated when variation
over time is analysed, because the variables are interrelated, and their
determination is not simple. For example, urban water demand will
depend on changes in population over time, and the agricultural water
demand depends on temperature and the kind of crop, which affects the
water requirements of crops.
Study area
The Conchos River basin is located almost entirely in the state of
Chihuahua, except a very small fraction in the upper basin, which
belongs to the state of Durango. Most of its population lives in urban
Tecnología y ciencias del agua, 10(1), 207-233. DOI: 10.24850/j-tyca-2019-01-08
2152019, Instituto Mexicano de Tecnología del Agua
Open Access, license CC BY-NC-SA 4.0
(https://creativecommons.org/licenses/by-nc-
sa/4.0/)
areas; according to the population census of 2010, only 17% is located
in rural villages.
The state of Chihuahua, with a population of over 3 million, has 43
municipalities within the Conchos River basin, where a population of 1.7
million is located, with growth rates shown in Table 2. These high
historical growth rates will be maintained in the coming decades. Figure
2 shows the estimated population growth in the basin until 2030, using
estimations of the CONAPO (National Commission of Population) when
population in the Conchos River basin will reach 1.86 million.
Nevertheless, the rate of population growth is declining, which is taken
into account in the simulation model.
Precipitation in the basin is very variable, reaching 700 mm per year on
average in the upper part of the basin, 350 mm per year in the middle,
and only 250 mm at the lower region. Hence, this basin is located in a
semiarid region; the main runoffs occur in the upper area, in the
mountains that surround it.
Table 2. Population growth rates/by year (%) (inter-census average) of
Rio Bravo and Conchos Basins (calculated with INEGI census data).
1995 2000 2005 2010
Rio Bravo
Basin 3.18 2.08 1.45 0.96
Conchos River
Basin 1.89 0.70 1.42 1.63
Tecnología y ciencias del agua, 10(1), 207-233. DOI: 10.24850/j-tyca-2019-01-08
2162019, Instituto Mexicano de Tecnología del Agua
Open Access, license CC BY-NC-SA 4.0
(https://creativecommons.org/licenses/by-nc-
sa/4.0/)
Figure 2. Projections of the population living in the Conchos River Basin
(data from the National Population Commission CONAPO).
The Conchos River basin has a total area of 65,770 km2, and is
composed by the sub-basins of the Florido, Parral, Ballymena, San
Pedro, and Chuviscar rivers, besides its own basin (Conagua, 2011). A
major water infrastructure has been built in the Conchos River and its
tributaries, including large dams with a total storage capacity of 3.87
billion cubic meters, apart from other small dams and levees.
The main water use is agriculture. There are four irrigation districts in
the basin, covering an irrigable area of 128,137 hectares, rarely
cultivated in full. In the 2013-2014 agricultural cycle, for example, only
58% of the total area (Conagua, 2015) was planted. Ninety percent of
the volume of water consumed in the basin is for agricultural use..
Results and Discussion
Precipitation trends
In trend analysis of precipitation, data from meteorological stations
located in the basin must be used. In the Conchos River basin, several
stations are located, however, many of them have stopped operating for
several years, others have long historical periods but with poor quality,
and others have a period of registration too short for an analysis of
variability. However, as one of Mexico's largest basins with water
infrastructure, it was possible to have enough information stations in the
upper, middle and lower part of the basin. Table 3 shows the stations
used in the analysis and their graphical location in the basin can be seen
in Figure 3.
Table 3. Climatological stations used in the study.
Tecnología y ciencias del agua, 10(1), 207-233. DOI: 10.24850/j-tyca-2019-01-08
2172019, Instituto Mexicano de Tecnología del Agua
Open Access, license CC BY-NC-SA 4.0
(https://creativecommons.org/licenses/by-nc-
sa/4.0/)
Station Date of operation
Name
number start
8037 Coyame 01/10/1964
8085 La Boquilla 01/06/1949
8270 La Mesa 01/11/1975
Figure 3. Climatological stations considered in the study. Sketch
location in the basin.
As mentioned above, to determine recent trends in precipitation,
Standardized Precipitation Index values for 6, 9, and 12 months were
calculated, as shown in Figures 4, 5, and 6.
Tecnología y ciencias del agua, 10(1), 207-233. DOI: 10.24850/j-tyca-2019-01-08
2182019, Instituto Mexicano de Tecnología del Agua
Open Access, license CC BY-NC-SA 4.0
(https://creativecommons.org/licenses/by-nc-
sa/4.0/)
Figure 4. Standardized Precipitation Index (SPI) for 6, 9, and 12
months, La Boquilla station. SPI linear trend for 12 months is also
shown.
Figure 5. Standardized Precipitation Index (SPI) for 6, 9, and 12
months, La Mesa station. SPI linear trend for 12 months is also shown.
Tecnología y ciencias del agua, 10(1), 207-233. DOI: 10.24850/j-tyca-2019-01-08
2192019, Instituto Mexicano de Tecnología del Agua
Open Access, license CC BY-NC-SA 4.0
(https://creativecommons.org/licenses/by-nc-
sa/4.0/)
Figure 6. Standardized Precipitation Index (SPI) for 6, 9, and 12
months, Coyame station. SPI linear trend for 12 months is also shown.
Throughout the basin, especially since the nineties, a decrease in
precipitation is observed. This trend is less pronounced in the upper part
of the basin (La Boquilla station), and clearer and more significant in the
middle (La Mesa station) and the lower area (Coyame station).
In addition, also since the nineties, a decrease is observed in climate
variability, particularly in the lower part of the basin, the most arid zone.
Thus, in the Coyame station, since 1994, SPI values are maintained in
the range of dry or slightly dry, except for a rain event in 1998 that is
recorded in the SPI 6. This behaviour contrasts with the precipitation
variability observed in the 1975-1992 period, in which periods of high
values of SPI alternated with other dry or slightly dry periods.
In the middle part of the basin, characterized by the La Mesa station, it
is also observed a decreasing precipitation trend since l990. Since then,
there have been no recorded SPI values above 1.5, as happened several
times in the registry between 1980 and 1990. In fact, since 1990 the
SPI 12 no reached values greater than 1, indicative of moderately humid
climate, remaining since in then the range from 0.5 to -0.5; which also
indicates a decrease of climate variability.
Finally, in the upper part of the basin, characterized by La Boquilla
station, a decrease in precipitation is also observed since the nineties. At
this station, located in the area of highest rainfall of the basin, the trend
is less evident. However, it can be seen that while in the period from
1957 to 1985 several wet or moderately wet episodes were recorded,
Tecnología y ciencias del agua, 10(1), 207-233. DOI: 10.24850/j-tyca-2019-01-08
2202019, Instituto Mexicano de Tecnología del Agua
Open Access, license CC BY-NC-SA 4.0
(https://creativecommons.org/licenses/by-nc-
sa/4.0/)
since 1985 no SPI-12 values greater than 1 have been observed, and
prolonged periods of moderate drought were observed in the years
1989-1992 and 2000-2002.
In general, in all records analysed, the linear regression curve (which
can only be considered as indicative of a trend) is clearly negative. In
short, there is already an observable tendency to increased dryness in
the basin.
Moreover, the decrease in rainfall variability is also a major problem for
water management in the basin. This is because they have often been
the extraordinary rains that have produced surpluses in the basin, spills,
and transfers to the lower Rio Grande basin, which has allowed the
fulfilment of the commitments of Mexico with the United States,
provided in the 1944 Treaty.
These observed trends are in accordance with the provisions of climate
change scenarios for the basin. Rivas Acosta, Güitron de los Reyes, &
Ballinas González (2010) implemented a multi-model and downscaling
analysis and conducted a detailed analysis of the Conchos River basin.
As a result, they estimate that the decline in rainfall at the end of the
century will be between 15 and 21% over that recorded historically until
2009, by the SRES A2 scenario.
Rivas Acosta, Güitron de los Reyes, & Ballinas González (2010)
conducted an assessment of the expected variations in runoff for the
Conchos River using the so-called indirect method recommended by the
National Water Commission (Comisión Nacional del Agua, 2015). For the
A2 scenario, they predict decreases in runoff between 23 and 27% by
the end of the century, as shown in Figure 7. These estimates will be
considered in the dynamic simulation model to calculate the decrease in
water availability.
Tecnología y ciencias del agua, 10(1), 207-233. DOI: 10.24850/j-tyca-2019-01-08
2212019, Instituto Mexicano de Tecnología del Agua
Open Access, license CC BY-NC-SA 4.0
(https://creativecommons.org/licenses/by-nc-
sa/4.0/)
Figure 7. Changes expected in the natural availability in the Conchos
River basin towards the end of the century, on the A2 scenario. Percent
of decrease. (Rivas Acosta, Güitron de los Reyes, & Ballinas González,
2010).
Dynamic Simulation Model
Figure 8 shows the dynamic simulation model in Vensim. The main
water uses considered are agricultural demand, which is separated for
each of the irrigation districts, and which will change due to the effects
Tecnología y ciencias del agua, 10(1), 207-233. DOI: 10.24850/j-tyca-2019-01-08
2222019, Instituto Mexicano de Tecnología del Agua
Open Access, license CC BY-NC-SA 4.0
(https://creativecommons.org/licenses/by-nc-
sa/4.0/)
of climate change; and urban water demand, which will be modified
mainly by population increase.
Figure 8. Dynamic model of the Rio Conchos Basin.
The basic information considered for modelling consisted on the water
demands for different consumptive uses—agricultural, urban public,
industrial, livestock and other minor uses—as well as population and
surface irrigation data. This basic information was obtained from the
study on water availability in the basin, published by the National Water
Commission (Conagua, 2011). In the simulation model, the irrigation
demands used were those reported by the National Water Commission
in the agricultural statistics report (Conagua, 2015).
In the model, three scenarios were simulated, one without considering
climate change and two others considering climate change under the
A1B and A2 scenarios. In these scenarios we use the above mentioned
results of Rivas Acosta, Güitron de los Reyes, & Ballinas González
(2010) for changes in water availability; and RCP 6.0 and 8.5 for
temperature scenarios, published by the National Institute of Ecology
and Climate Change (INECC, 2016). The resulting changes in
Tecnología y ciencias del agua, 10(1), 207-233. DOI: 10.24850/j-tyca-2019-01-08
2232019, Instituto Mexicano de Tecnología del Agua
Open Access, license CC BY-NC-SA 4.0
(https://creativecommons.org/licenses/by-nc-
sa/4.0/)
temperature, population, and natural availability due to climate change
are shown in Table 4.
Table 4. Simulated scenarios with and without climate change effects.
Population Change in Change in
increase water temperature
SCENARIO availability (°C) 2010-
2010-
2030 2010-2030 2030
BASELINE
289,000 0 0
SCENARIO
SCENARIO
289,000 -17% +1.5 °C
1
SCENARIO
289,000 -20% +2 °C
2
The increase in urban water demand is related directly to population
growth. According to population projections, there will be a declining
growth rate of 0.01 per year in 2010 to 0.006 in 2020. The model
assumes that the population growth rate will stabilize, as of 2020, at
0.005 annually.
The increase in agricultural water demand due to climate change is
calculated by considering the change in the consumptive use caused by
the change in temperature. For this purpose, the Blaney-Criddle method
is used, which was developed in the same climatic region in the United
States, and has produced good results in Mexico. It is the method
recommended by the Ministry of Agriculture of Mexico (Sagarpa-Colegio
de Postgraduados, 2008).
The dynamic model was validated with the water balance data produced
by the National Water Commission (Conagua, 2011). With a total
availability in the basin of 2,254.9 Hm3, the difference between the
dynamic model results and those calculated by Conagua in the water
balance at the basin outlet is 36.8 Hm3, which is considered a good
aproximation.
The first scenario, referred to as the "baseline scenario" in this paper,
does not consider the effects of climate change, but only the effects of
population growth. Subsequently, the results of two climate change
Tecnología y ciencias del agua, 10(1), 207-233. DOI: 10.24850/j-tyca-2019-01-08
2242019, Instituto Mexicano de Tecnología del Agua
Open Access, license CC BY-NC-SA 4.0
(https://creativecommons.org/licenses/by-nc-
sa/4.0/)
scenarios were tested. In Scenario 1 a temperature increase of 1.5°C
and a decrease in water availability of 17% between 2000 and 2030
were considered. The second scenario considered an increase in
temperature of 2°C and a decreased water availability of 20% between
2000 and 2030.
Figure 9 shows the results of change in the total consumptive use in
those three scenarios. The most important impact on water use in the
basin is agriculture, which accounts for over 90% of the total, so the
increase in water irrigation demand caused by climate change is very
relevant. In the baseline scenario, however, in which only the population
growth impact the water demand, increased consumptive use is much
more moderate.
Figure 9. Change in total consumptive use in the basin under various
scenarios, with and without climate change.
The water balance of the basin, meanwhile, would change dramatically
in the coming years, becoming negative in eight years, in scenario 2,
and in 13 years, in scenario 1, as shown in Figure 10. In the case of a
scenario without climate change (baseline scenario), the water balance
would decline slightly, which is almost not perceptible in the graph, as a
result only of population increase.
Tecnología y ciencias del agua, 10(1), 207-233. DOI: 10.24850/j-tyca-2019-01-08
2252019, Instituto Mexicano de Tecnología del Agua
Open Access, license CC BY-NC-SA 4.0
(https://creativecommons.org/licenses/by-nc-
sa/4.0/)
Figure 10. Change in the water balance in the basin under different
scenarios, with and without climate change.
Finally, the water availability per inhabitant would exhibit the variation
shown in Figure 11, approaching the condition of extreme scarcity at the
end of the analysis period.
Tecnología y ciencias del agua, 10(1), 207-233. DOI: 10.24850/j-tyca-2019-01-08
2262019, Instituto Mexicano de Tecnología del Agua
Open Access, license CC BY-NC-SA 4.0
(https://creativecommons.org/licenses/by-nc-
sa/4.0/)
Figure 11. Change in per capita water availability in the different
scenarios.
Sensitivity Analysis
As the previous results shown, the main driving forces of the system are
those related with climate change. Both, the diminishing of the natural
availability and the increase on irrigation water demand. As these
parameters are scenarios dependent, it is important to study the system
sensitivity in relation with them.
Hence, a Montecarlo analysis was performed, with the aim of analyse
the system behaviour against variations of climate change variables. We
use a range of water availability variation between -10 until -25%; and
a range of temperature variation between +0.5 °C to 2.0 °C. A uniform
probability distribution was used in the Montecarlo analysis.
The resulting sensitivity range is shown in figure 12, for the water
balance reduction effect of climate change in the system. With a
Tecnología y ciencias del agua, 10(1), 207-233. DOI: 10.24850/j-tyca-2019-01-08
2272019, Instituto Mexicano de Tecnología del Agua
Open Access, license CC BY-NC-SA 4.0
(https://creativecommons.org/licenses/by-nc-
sa/4.0/)
probability of 95%, the water balance will result reduced among 260
and 610 millions of cubic meters.
Figure 12. Sensitivity analysis of climate change variables effect over
the system. Water Balance reduction (Hm3).
Adaptive dynamic model
It is evident that it is impossible the water management in the
watershed with a negative water balance. Hence, we develop an
adaptive dynamic model, through which we can calculate the farming
surface land what could it be irrigated with the water available reduction
and the demand increase due to climate change, under the scenarios
described above.
Tecnología y ciencias del agua, 10(1), 207-233. DOI: 10.24850/j-tyca-2019-01-08
2282019, Instituto Mexicano de Tecnología del Agua
Open Access, license CC BY-NC-SA 4.0
(https://creativecommons.org/licenses/by-nc-
sa/4.0/)
Figure 13 shows the adaptive dynamic model. In this case, the irrigation
surface will change, adjusting the water availability. The rest of the
water uses, because they are very small, will remain without any adjust.
That is, the climate change adaptation must happen in the irrigation
system.
Figure 13. Adaptive dynamic model.
The changes in the resulting irrigated land are presented in figure 14,
under the three simulated scenarios. The irrigation surface reduction, at
the end of the period analysed, could be among 18,160 Ha in the
scenario 1, until 20,990 Ha in scenario 1. This means a reduction
between 15.7% and 18.2% with respect to the total irrigation surface
now a day.
Tecnología y ciencias del agua, 10(1), 207-233. DOI: 10.24850/j-tyca-2019-01-08
2292019, Instituto Mexicano de Tecnología del Agua
Open Access, license CC BY-NC-SA 4.0
(https://creativecommons.org/licenses/by-nc-
sa/4.0/)
Figure 14. Irrigation surface reduction (Ha).
Conclusions
The Conchos River basin contributes with 87% of the volume that
Mexico must deliver to the United States under the Treaty of Water
Distribution between the two countries. The hydraulic infrastructure built
in the Conchos River basin uses virtually all the water in average years,
and the fulfilment of Mexico’s commitments has been historically
achieved with contributions from rainy years. Because of the great
historical hydrological variability, this criterion had allowed compliance
with the Treaty on the five-year cycles mentioned above. However, as
shown in this text, precipitation in the basin is declining, most likely due
to climate change. Another concern is that variability is decreasing, with
fewer years of extreme high precipitation. Climate change models
predict significant temperature increases in this region and decreases in
natural water availability.
Tecnología y ciencias del agua, 10(1), 207-233. DOI: 10.24850/j-tyca-2019-01-08
2302019, Instituto Mexicano de Tecnología del Agua
Open Access, license CC BY-NC-SA 4.0
(https://creativecommons.org/licenses/by-nc-
sa/4.0/)
To estimate the future effects of population growth and climate change
on the water balance, a dynamic simulation model was developed, which
estimates the effects of these variables on the average water availability
and water balance in the basin. In the two climate change scenarios,
within 8 to 11 years, the water balance of the basin will become
negative, i.e., it will not be possible to meet the demand of water
allocated in the basin. As the adaptive dynamic model has shown,
without adaptation measurements, the irrigation surface will be
drastically reduced. In order for Mexico to meet the demands of its own
water users in the basin as well as its commitments established in the
Water Treaty with the United States, an extensive program of climate
change adaptation must be designed and implemented immediately,
based basically on irrigation efficiency, but considering also the care and
rational use of water by the population in urban centers
Acknowledgements
This paper is part of the research project 248 080 `Integrated Water
Management of the Rio Grande Basin under Climate Change Scenarios´,
funded by the National Council of Science and Technology of Mexico
(CONACYT).
References
Abadi Khalegh, L. S., Shamsai, A., & Goharnejad, H. (2015). An analysis
of the sustainability of basin resources using Vensim model. KSCE
Journal of civil engineering, 19(6), 1941-1949.
Aparicio, F. J., Ortega, E., Hidalgo, J., & Aldama, A. (2009). Recursos
hídricos en la frontera norte. Jiutepec, Morelos, México: Instituto
Mexicano de Tecnología del Agua.
Cerano-Paredes, J., Villanueva-Díaz, J., G., Avila-Arreola, J. D.,
Sánchez-Cohen, I., Valdez-Cepeda R. D. & García-Herrera, G. (2009).
Reconstrucción de 350 años de precipitación para el suroeste de
Chihuahua, México. Madera y Bosques, 15(2), 27-44.
Chavez, O. E. (1999). The 1994-1995 drought, what did we lwen from
it?: The mexican perspective. Natural Resources Journal, 39(Winter),
35-60.
Comisión Nacional del Agua. (2015, marzo 27). NOM-011-Conagua-
2015- Que establece las especificaciones y el método para determinar la
Tecnología y ciencias del agua, 10(1), 207-233. DOI: 10.24850/j-tyca-2019-01-08
2312019, Instituto Mexicano de Tecnología del Agua
Open Access, license CC BY-NC-SA 4.0
(https://creativecommons.org/licenses/by-nc-
sa/4.0/)
disponibilidad media natural de las aguas nacionales. Diario Oficial de la
Federación.
Conagua. (2011, junio 2). Acuerdo por el que se da a conocer el
resultado de los estudios técnicos de la región hidrológica número 24
Bravo-Conchos. Diario Oficial de la Federación.
Conagua. (2014). Atlas del agua en México 2014. México: Comisión
Nacional del Agua.
Conagua. (2015). Estadísticas agrícolas de los distritos de riego 2013-
2014. México: Subdirección General de Infraestructura Hidroagrícola.
Florescano, E. (2000). Breve historia de la sequía en México. Ciudad de
México, Distrito Federal, México: Consejo Nacional para la Cultura y las
Artes.
Goncalves, J. C., & Giorgetti, M. F. (2013). Mathematical model for the
simulation of water quality in rivers using the Vesnim PLE software.
Journal of Urban and Environmental Engineering, 7(1), 48-63.
Hayes, M., Svoboda, M., Wall, N., & Widhal, M. (2011). The Lincoln
declaration on drought indices. American Meteorological Society (April),
485-488.
ICSID. (2007, June 19). ICSID Case No. ARB (AF)/05/1. Retrieved from
International Water Law Project: www.waterlaw.org
INECC. (2016, junio 16). Escenarios de cambio climático. Retrieved from
INECC Cambio Climático: http://escenarios.inecc.gob.mx/
Martinez-Austria, P., Derbez, L., & Giner, M. E. (2013). The US-Mexico
institutional arrangement for transboundary water governance. In Free
Flow. Reaching water security through cooperation. (pp. 182-197).
Paris: Tudor Rouse and UNESCO.
Mexico-USA. (1944, February 3). USA and Mexico Treaty on the
Utilization of waters of Colorado and Tijuana Rivers and of the Rio
Grande. Retrieved from http://www.ibwc.state.gov/Files/1944Treaty.pdf
Ortega Gaucin, D. (2013). Impacto de las sequías en Nuevo León.
Ciencia UANL(63), 8-14.
Rivas Acosta, I., Güitron de los Reyes, A., & Ballinas González, H.
(2010). Vulnerabilidad hídrica global: aguas superficiales. In P. Martínez
Austria, & C. Patiño Gómez (Eds.), Atlas de vulnerabilidad hídrica de
México ante el cambio climático (pp. 81-114). Jiutepec, México:
Instituto Mexicano de Tecnología del agua.
Tecnología y ciencias del agua, 10(1), 207-233. DOI: 10.24850/j-tyca-2019-01-08
2322019, Instituto Mexicano de Tecnología del Agua
Open Access, license CC BY-NC-SA 4.0
(https://creativecommons.org/licenses/by-nc-
sa/4.0/)
Rubinstein, C. (2015). The price Texas pays for Mexico´s water debt. (T.
W. Institute, Ed.) Texas Water Journal, 6(1), 1-10.
SAGARPA - COLEGIO DE POSTGRADUADOS. (2008). Estimación de las
demandas de consumo de agua. México: Secretaría de Agricultura,
Desarrollo Rural, Pesca y Alimentación.
Tecnología y ciencias del agua, 10(1), 207-233. DOI: 10.24850/j-tyca-2019-01-08
233You can also read