Forewarned is forearmed - Exploring the value of new forecast products from the BOM to enable more informed decisions on profit and risk on grain ...
←
→
Page content transcription
If your browser does not render page correctly, please read the page content below
Forewarned is forearmed – Exploring the value of new forecast products
from the BOM to enable more informed decisions on profit and risk
on grain farms
Peter Hayman1and Debbie Hudson2
1
SARDI Climate Applications
2
Bureau of Meteorology
Key words
seasonal climate forecasting, risk, decision making
GRDC code
Rural R&D for Profit Project 16-03-007 Forewarned is Forearmed
Take home messages
• Climate variability and extremes represent an important risk for grain growers in Australia. GRDC
has partnered with other RDCs and research agencies to invest in the Forewarned is Forearmed
(FWFA) Project, which will provide the grains industry with the first ever forecasts of extreme
climate events weeks to seasons ahead. The project outputs, including new forecasts and risk
management strategies, aim to decrease the impacts of extreme climate events on farm and
business profit
• The Bureau of Meteorology and its research partners are testing a large set of experimental
multi-week and seasonal forecast products with the grains industry to gather feedback on their
utility, appearance, and interpretation. Five of these products will become official Bureau
forecasts, benefiting all agriculture
• Forecasts are expressed as probabilities and this is a challenge for communication. Seasonal
climate forecasts are skilful (better than guessing) and likely to slowly improve. Nevertheless,
they are unlikely to approach the remarkable accuracy of short-term weather forecasts and so
are best represented as a change in the odds for wetter or drier, rather than a categorical
statement that it will be wet or dry
• A key component of the FWFA project is linking the probabilistic forecasts to decision-making.
One path forward is to use what we are calling Rapid Climate Decision Analysis. This is based on
budgeting across climate deciles. Although this approach is important for incorporating
probabilistic seasonal forecasts, the graphical representation of risk and reward also leads to
useful conversations about climate risk in the absence of forecasts.
Forewarned is forearmed – GRDC combining with other RDCs, research agencies and the
Australian government in an R&D for Profit project
Compared to most of their international competitors, Australian grain growers face a high level of
year-to-year variability in climate. There are many ways to build resilience to the variable climate,
including improved varieties, better agronomy, new ways to monitor crops and soils, along with
sound farm businesses. Multi-week and seasonal forecasts are a complementary part of the tool kit.
While multi-week and seasonal climate outlooks are commonplace, these services are focused on
the middle of the distribution of possible outcomes, for example forecasts of the chance of above
median conditions. This does not provide any indication of the risk of extreme conditions, such as an
extended period of extreme heat, or a decile 1 (bottom 10%) rainfall season.
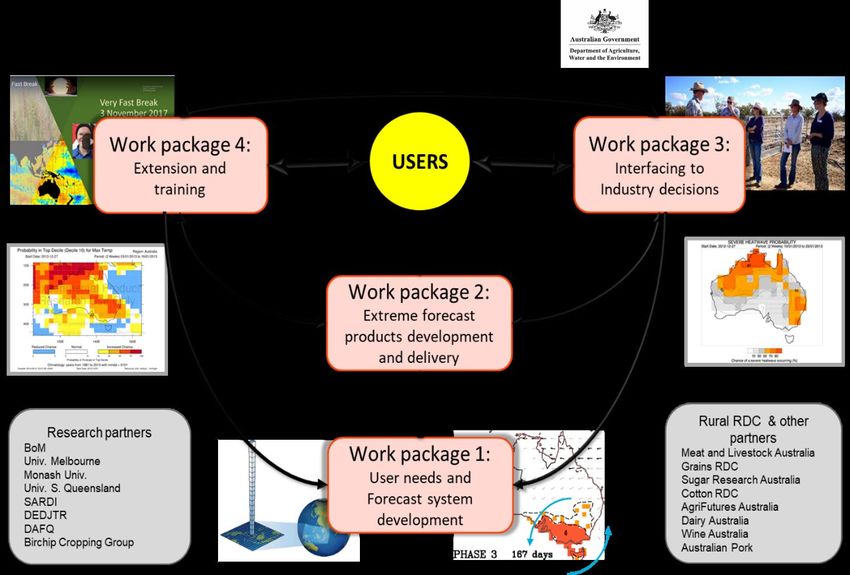
The Forewarned is Forearmed (FWFA) project, supported by the Australian Government Department
of Agriculture, Water and the Environment as part of its Rural R&D for Profit programme, will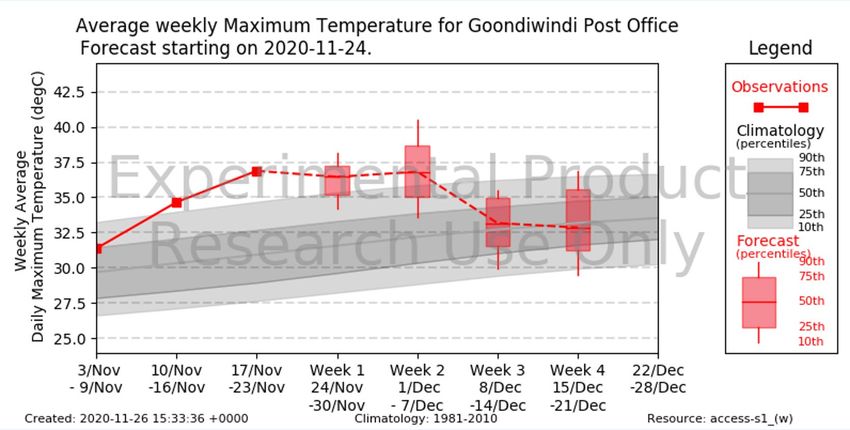
provide forecasts of extremes beyond the 7-day weather forecast and equip farmers with the
information and tools to be forewarned and prepared (Figure 1). The project outputs aim to
decrease the impacts of extreme climate events on farm and business profit.
The project includes research, forecast product development and extension teams, representing a
range of industries, including the grains industry, working directly with farmers and farm
consultants, to link the forecasts to agricultural decisions and to develop risk management strategies
to proactively prepare for these events.

 Figure 1. The Forewarned is Forearmed Project is a 5-year project (2017-2022) supported by funding
 from the Australian Government Department of Agriculture, Water and the Environment as part of its
 Rural R&D for Profit program in partnership with rural Research and Development Corporations, state
          departments and universities. The project is managed by Meat & Livestock Australia.

How are the multi-week and seasonal forecasts generated?
The forecasts being developed in this project use data from the Bureau’s seasonal forecast system,
ACCESS-S (http://www.bom.gov.au/climate/ahead/about/#tabs=Outlook-model; Hudson et al.
2017).
Prior to 2013, climate outlooks for Australia were produced using relationships between the key
climate drivers, such as El Niño, and the average weather for a region at a given time of year - this is
called statistical forecasting. This generally performed well over broad areas and was certainly better
than guesswork. But now, with supercomputer technology and increased scientific understanding, a
dynamic model of the oceans, atmosphere, land and ice is used. This has improved the accuracy of
the climate outlooks (Charles et al. 2015).
Access to huge volumes of global data gathered from ships, satellites and ground stations provide a
snapshot of what the ocean, land and atmosphere look like at any given moment. This snapshot is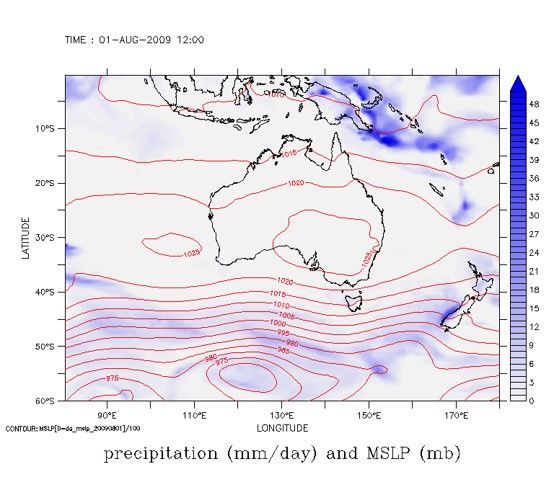
represented on a 3-dimensional grid of the earth. The model then uses mathematical relationships,
based on physics, to calculate how the weather could change day-by-day over the next few months
(Figure 2).

Figure 2. ACCESS-S simulates the weather day-by-day. This figure shows one day of rainfall (shaded)
 and sea level pressure (contours) from an ACCESS-S forecast. For a seasonal forecast, the days are
                         averaged together into months and seasons ahead.

Unlike statistical forecast systems, dynamic models such as ACCESS-S are not limited by historical
relationships. In addition, they produce physically consistent forecasts of a range of variables, such
as rainfall, temperature, winds, soil moisture and atmospheric pressure. This means that we can
delve deeper and investigate how different elements contributed to a particular forecast.
For example, “In 2020, why was an emphatically wet forecast followed by a dry winter?”. In April
2020 ACCESS-S was confident in its prediction of a wetter than normal winter for most of Australia,
as were other international climate models. Most of the international models were also forecasting
a negative Indian Ocean Dipole (IOD) and La Niña conditions for the coming months − both of which
are known to influence wetter than normal conditions over eastern and southern Australia.
The IOD was weakly negative over March to May in 2020. However, in June and July, it surprisingly
swung to being positive. One contributor to the abrupt change in the IOD was Tropical Cyclone
Mangga, which occurred unusually late (19 - 23 May), and followed an unusually southward track. It
resulted in wild storms, flooding and power cuts across Western Australia, including Perth, and
cooling of a section of the tropical Indian Ocean to the north-west of Australia, which reversed the
nature of the IOD.
The ACCESS-S forecast for June from the end of April was emphatically favouring wet conditions for
much of southern and eastern Australia (and a negative IOD), but by the end of May, the forecast for
June had switched to neutral or dry (and a positive or weak IOD). This switch was because by late
May the model was picking up the influence of the cooling of the ocean from cyclone Mangga.
We don’t usually get such big and sudden swings in seasonal forecasts, because the key drivers of
seasonal predictability rely on patterns of ocean temperatures such as the IOD and El Niño that
typically change slowly. Some weather events, such as tropical cyclones, cannot be predicted several
weeks or months in advance and they can sometimes have a big and unexpected impact on seasonal
conditions. For this reason, it is important that forecasts are updated frequently, with the latest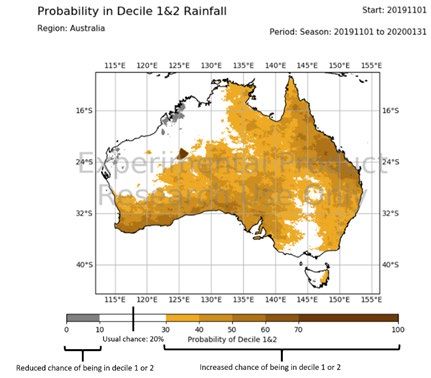
information. It is also important that our forecasts take into account uncertainties in how the
weather will evolve.
The weather over the next few months is not preordained—there are several very real, equally likely
possibilities. To take this into account, we run ~100 forecasts by making small changes to the starting
conditions (the observations) —these changes represent uncertainty in the observations. The 100
different scenarios that are generated are called an “ensemble''. We use this ensemble to provide
probabilistic forecasts of the upcoming conditions. If, say, 80 of these 100 outlooks predict wetter-
than-average conditions developing in an area, we say the likelihood of a wetter-than-average
season in that location is 80%. Multi-week and seasonal forecasts therefore involve a range of
possible outcomes and are usually expressed in terms of probabilities. The forecasts consider “shifts
in the odds”, rather than specifying one outcome. Using probabilities in decision-making is an
ongoing challenge, and one that is being addressed in the FWFA project and discussed later in this
paper.

What new FWFA forecasts are coming soon to the Bureau website?
The FWFA project aims to expand on the current Bureau of Meteorology outlooks for rainfall and
temperature for the weeks, months and seasons ahead (http://www.bom.gov.au/climate/outlooks).
The Bureau, working with research partners with expertise in different agricultural industries, has
developed a large set of experimental forecast products of the likelihood of climate extremes on
multi-week to seasonal timescales. The products are focused on heat, cold and rainfall extremes, for
example, "What is the likelihood of having a decile 10 (top 10%) rainfall this spring?"; "What is the
chance of having a heatwave in the week after next?"; "What is the chance that the upcoming month
will be extremely hot?"; "What is the likelihood of having heavy rainfall in the upcoming fortnight?".
Owing to the involvement of several agricultural industries in FWFA, the forecast products are
generic in nature and not tailored to a particular sector.
The large set of experimental products are available on a research web server and the forecasts are
updated daily in real-time. During the course of the project these forecasts have been exposed to
the project's Grains Industry Reference Group for feedback on utility, appearance and
interpretation. Other industry reference groups in the project include producers in the dairy, red
meat, sugar and wine industries.
A subset of five forecast products will be selected (in a staged approach) to become official,
operational products and will be delivered to the public via the Bureau's website. The choice of the
five products is informed by industry engagement. At this stage in the project, three of the five
products destined for operations, have been identified.
A key role of the Grains Industry Reference Group (and the others) has been to assess the
experimental forecasts and provide feedback, which has been essential to:
    •   Provide ideas for forecast product development
    •   Identify the utility of the products for decision-making, and specify the kinds of decisions
        that might be facilitated
    •   Aid in selecting products that will become official Bureau forecasts
    •   Improve the interpretability and understanding of a product, including the required
        supporting information (particularly if destined to become an official product)
    •   Improve the display – look and feel – of the product (particularly if destined to become an
        official product)
The first product that has been identified to become an official Bureau product is maps of the
chance of having extreme rainfall, maximum (Tmax) and minimum (Tmin) temperature for the weeks,
months and seasons ahead. "Extreme" is defined as being amongst the driest, wettest, hottest or
coldest 20% of periods (weeks/months/seasons) from the climatological period (i.e., deciles 1&2
(bottom 20%) or deciles 9&10 (top 20%). These maps are a natural extension of the Bureau's
currently available "probability of above median" maps, and show the chance of having very wet,
dry, hot or cold conditions. For example, Figure 3 shows the chance of having an extremely dry
season.
Figure 3. Example of the chance of having an extremely dry summer (amongst the bottom 20% in
the climatology period). The forecast shown here is for the Nov-Dec-Jan 2019/20 season and is
suggesting an elevated risk of having decile 1 or 2 rainfall totals over much of eastern and southern
Australia (probabilities are greater than the usual risk of 20% over large areas). Over some of these
areas the risk is more than doubled (>40%). However, over much of north western of Australia and
Victoria (areas shown in white), the chance of a really dry summer is no different to long term odds
of 20%.
The second product is the “decile bars”. These are location-specific bars (a regionally specific site)
that indicate the shift in the probabilities compared to usual across the deciles. They are available
for rainfall, Tmax and Tmin for the weeks, months and seasons ahead. The decile bars meet the needs
of feedback collected from all industry groups for an indication of the change in risk across all
deciles, including extremes. Figure 4 shows an example of the bars for a forecast of monthly and
seasonal rainfall.Figure 4. Rainfall forecasts for Dubbo for upcoming months and seasons (generated on 16 July
2020). The forecasts show the probabilities across five different decile ranges. The long-term
average probability ("usual chance") for each category is 20% and the forecasts show the shift in the
odds compared to usual. For example, for September, the odds are stacked towards having a wetter
month than usual in Dubbo, with about double the usual risk of having a decile 9 or 10 September
rainfall.
The third product is the “climagram”. These are location-specific timeseries graphs showing the
forecast of rainfall totals, Tmax and Tmin respectively for the coming weeks and months. Past
observations are also shown on the graph. Insight from the FWFA industry reference groups is that
there is a strong desire from producers to visualise the forecast as a time-series for a given location
(rather than having to look at multiple maps). The forecasts of rainfall totals and temperatures
(rather than departures from normal) facilitates flexibility for temperature/rainfall threshold-specific
decisions.Figure 5. Timeseries of observed (red solid line) and forecast (red box plots) maximum temperature
(y-axis) for consecutive weekly periods (x-axis) for Goondiwindi. The box plots indicate the range in
the expected outcomes from the forecasts. The grey shading indicates the usually expected
temperatures for that time of year (based on 1981-2010). The thresholds shown for the box plots
and the grey shading are the 10th, 25th, 50th (median), 75th and 90th percentiles. For example, Week 1
(24-30 November 2020) is forecast to have a weekly mean maximum temperature of around 37°C
(the median of the forecasts), which is much warmer than usual (e.g., the median line of the box is
well above the median line of the grey shading and is even higher than the 90th percentile of usually
expected temperatures). In contrast, in Week 4 temperatures are expected to return to close to
usual, with a weekly mean maximum temperature of ~32.5°C i.e., the median of the forecasts which
is close to the historical median).
Criteria behind the selection of all these products were based on insight from the industry reference
groups, such that the forecasts:
• Provide more detail than just above/below median rainfall and temperature
• Provide indications of changes in extremes and cover high and low rainfall, and high and low
maximum and minimum temperature, thus providing broad utility
• Are available across multiple timescales: weekly, monthly, seasonal
• Provide indications of changes in extremes and put the forecast in context of 'usual'
conditions (long-term historical)
• Will be of use for a wide range of tactical decision-making across several industries.
The decile bars and climagrams also meet a key desire for location-specific information. However,
the value of map-based products, like product 1, is also recognised as providing important
contextual knowledge of how broad a forecast signal might be, and what is happening in other
regions, which is relevant to some decisions e.g., for selling grain.
The visual display of the three types of forecast products shown above are from the R&D
experimental website. Additional feedback is now being sought from the Grains Industry Reference
Group (and others) to enhance the display to the standard of an operational product, including
determining the level of supporting information that will appear on the public Bureau website. The
visual appearance of these products will therefore evolve, as attention is focussed on the
appropriate use of words for titles and labels, on the selection of colours (e.g., to ensureaccessibility), on the labelling of state boundaries and towns on the maps, on enabling “zoomable” maps etc. In addition, any product that becomes an official Bureau product will have an accompanying indication of the skill. The need to provide this accuracy information is strongly acknowledged, as well as considering how it is best displayed on the Bureau website. Feedback is also currently being obtained from the Grains Industry Reference Group on what the final two products that will transition to Bureau operations will be. This will make up the FWFA portfolio of five new forecast products on the Bureau website − which will start to become available from mid-2021. Using probabilistic seasonal climate forecasts in decision-making There will be ongoing improvements in seasonal forecasts and in the way they are communicated. However, they will still fall into the category of “too good to ignore but not good enough to be sure” and will be best represented as probabilities. Probabilities have long been a barrier to the use of seasonal forecasts. In one of the early reports on farmer use of seasonal climate forecasts in Australia, Ridge and Wylie (1996) noted “Much climate information is put out in the form of probabilities, which most farmers are not responsive to. Farmers have said that they want to know whether it is likely to be wet, dry or average, not whether there is a 60% chance of getting 40% of average rainfall”. There is a suspicion amongst some farmers and advisers that the use of probabilities displays a lack of conviction on behalf of the forecaster, a form of vagueness or mumbling to cover all outcomes and avoid being wrong. Private forecasters providing emphatic statements are admired as being straight talking. On hearing a talk on El Niño and probabilities an agronomist made the comment “nice talk on probabilities, but in the real-world people have to make decisions”. This overlooks the use of probabilities in almost all of modern life including engineering, aviation safety, health, artificial intelligence and criminal justice. It is a mistake to assume that these domains are any less complex and messy than managing a grain farm. Bernstein (1996) in a history of risk as an idea stated “The revolutionary idea that defines the boundary between modern times and the past is the mastery of risk… Until human beings discovered a way across that boundary, the future was a mirror of the past or the murky domain of oracles and soothsayers who held a monopoly over knowledge of anticipated events.” In many ways we are fortunate to have climate science express confidence as probabilities as this provides the full information and indicates the relative confidence in the forecast. Not only is this a case of climate science being honest and credible, but it also improves the decisions based on the forecast. The heart of risk management is to consider a range of outcomes rather than a single future. It is rare for seasonal forecasts to be as emphatic as 80% chance of exceeding the median rainfall, but it is a mistake to mentally round the 80% up to 99% and then be surprised when the forecast is “wrong”. Although a relatively high number, 80% still leaves a 20% chance of drier than median rainfall. Following the notion of the “plume is the forecast” 80 of 100 ensemble runs were wetter than median and 20 drier. This 20% chance of a minority outcome is nowhere near the same confidence level used in most agricultural experiments (~5% chance). Most AgVet chemicals are based around an extremely low chance of the treatment failing (~1%). In human health we are used to minority outcomes of 1 in 1000 and in aviation safety 1 in 10 million. The 20% chance is more like a professional golfer missing a five-foot putt or a professional soccer player missing a penalty shoot- out (golf.com 2021). Even if we know the statistics, watching a professional golfer or penalty shoot- out is interesting because it is uncertain. We don’t say “because there is an 80% chance the result is guaranteed, I won’t bother watching” rather, if we care about the results, we think about the two possible outcomes even though one is much more likely than the other.
Rapid Climate Decision Analysis
Rapid Climate Decision Analysis (RCDA) is an Excel based framework to compare the outcomes
across deciles of growing season rainfall of a higher risk and return choice (e.g., a higher N rate or a
pulse crop) with a more conservative lower risk and return choice (lower N or a cereal) (Hayman et
al 2019). The key feature is that rather than budgeting for a single outcome (often decile 5 or
‘average’) users are stepped through a process to provide information for three to five season types
and presented with an interpolated graph that covers outcomes across all deciles. The
representation of an adviser’s knowledge as budgeting by deciles provides a rich source of
information on climate risk. The mental switch is to compare the profit of two decisions across states
of climate (in this case deciles of growing season rainfall) with careful attention to where the lines
cross over (if at all) and the relative size of the downside risk and the upside missed opportunity. A
common request is for climate science to indicate which decile is most likely, but a better
representation of the forecast is a shift in the likelihood of different deciles (e.g., as shown in the
decile bar product in Section 3). If a seasonal climate forecast is represented as a revised
climatology, this revision can be superimposed on profit by decile graph which allows a new
comparison of the two options.
Frameworks such as Rapid Climate Decision Analysis are not designed for routine decision making.
The more modest role is as a tool to think, discuss, confirm or start arguments about rules of thumb
on climate risk in the grains industry. We subtitled the framework “fast graphs for slow thinking” as
a reference to Khaneman (2011). The graphs can be generated relatively quickly because grain
growers and agronomists have a deep understanding of production risk and how this production
changes across deciles of growing season rainfall. There is a cost in time and effort of slowing down
to put numbers on a page (or spreadsheet). This is only worthwhile where the outcomes matter. On
a grain farm, there should be at least tens of thousands of dollars at stake.
As the psychologist Paul Slovic says, “our emotions are not good at arithmetic, we tend to think of
future events as 100% or 0%”, This can translate into hearing about an El Niño outlook and planning
for a dry outcome or dismissing the prediction because it isn’t certain or because it has rained in past
El Niño events. The correct revision of deciles is straightforward in a spreadsheet and agronomists
easily recognise patterns of shifts in graphs, especially if they were involved in providing the
underlying information.
We ran a workshop with 20 agronomists – some of the comments on the strengths of Rapid Climate
Decision Analysis were as follows:
    •   "Getting numbers down on paper and being able to test the sensitivity of a decision to a
        change in climate forecast. Fairly easy to use and interpret"
    •   "Putting numbers around some gut feelings helping to make decisions"
    •   "To be able to clearly visualise the risk profile of a climate sensitive decision. It makes us
        think through the financial aspects of a decision, and how the future climate (ie rainfall
        deciles) will impact the outcome"
    •   "Excellent tool to help explain the probabilities given a set of indicators"
    •   "Good visual data and rigor around decision based on a range of potential climate outcomes"
    •   "Assists in helping make a final decision or to confirm what you thought in the field"
    •   "Good for showing differences and putting numbers to those decisions."
Some of the limitations related to the difficulties of using it in the field, the ‘clunky’ spreadsheet,
how to include other factors, the lack of confidence in seasonal forecasts, having enough empirical
data, and the challenge of dealing with complex decisions. As one agronomist put it “It’s a good back
up but for me there are so many other factors to consider and as an established agronomist I don’t think I’d use this tool as generally everything in the paddock tells me the answers” Conclusion The FWFA project encompasses an end-to-end approach − it includes underpinning science, forecast development, engagement with users, and the delivery and extension of a new service. A strong feature of the project is the direct link between the research groups and industry reference groups. The benefits of this approach are that it enables efficient feedback between the different components, facilitating a faster and more effective path to delivering practical outcomes to farmers. The value of information lies in its use. Forecasts are only valuable if they provide the information that farmers need, if they are issued when famers are making their critical decisions and if they can help inform a decision. The FWFA project is producing new multi-week and seasonal forecasts for the grains and other industries. Engagement with the grains industry at every step in this project is central to realising the ultimate benefit of these new forecasts. References Bernstein, P.L. (1996) Against the gods: The remarkable story of risk. New York: Wiley. Charles, A.N.; Duell, R.E.; Wang, X.; Watkins, A. (2015) Seasonal Forecasting for Australia using a Dynamical Model: Improvements in Forecast Skill over the Operational Statistical Model. Australian Meteorological and Oceanographic Journal, 65:3-4 Golf.com website accessed 28 Jan 2021 Hayman, P., Mudge, B., Stanley, M., Anderson, G. and Grey, D. (2019) Agronomic advice in a variable climate; chess, poker or the pokies? Proceedings of the 2019 Agronomy Australia Conference, 25 – 29 August 2019, Wagga Wagga, Australia. www.agronomyaustralia.org/conference-proceedings Hudson et. al. D. (2017) ACCESS-S1 The new Bureau of Meteorology multi-week to seasonal prediction system. J Southern Hemisphere Earth Syst Sci 67:132–159. https://doi.org/10.22499/3.6703.001 Kahneman, D, and Egan, P. (2011) Thinking, fast and slow. New York: Farrar, Straus and Giroux Ridge, P. and Wylie, P. (1996) Improved management of climate risk. LWRRDC Occasional Paper CV01/96. Acknowledgements The research undertaken as part of this project is made possible by the significant contributions of growers through support of the GRDC, and the authors would like to thank them for their continued support. We appreciate the support and participation of members of the Grains Industry Reference Group in the FWFA project. The work on Rapid Climate Decision Analysis (RDCA) has been conducted with Barry Mudge, low rainfall farmer and consultant in South Australia and Professor Kevin Parton, Charles Sturt University. Ideas for RCDA have come from projects funded by GRDC, Wine Australia, ACIAR, the Australian Government through Rural R&D for Profit, and SARDI/PIRSA. We appreciate the input of 20 agronomists from the southern region in 2018 and a further 20 in 2020 as part of GRDC Project code: DAV1803-010SAX. The FWFA project is supported by funding from the Australian Government Department of Agriculture, Water and the Environment as part of its Rural R&D for Profit program.
Contact details
Dr Debbie Hudson
Bureau of Meteorology
700 Collins Street, Melbourne
Debbie.Hudson@bom.gov.au
Dr Peter Hayman
SARDI Climate Applications
Waite Research Precinct, Adelaide
Peter.Hayman@sa.gov.au
You can also read