Stu's View - RBC Wealth Management
←
→
Page content transcription
If your browser does not render page correctly, please read the page content below
Stu’s View
July 17, 2020

Stuart Morrow
Vice President
& Head of Investments
                              What’s in an index anyway?
RBC Phillips, Hager & North
Investment Counsel Inc.
                              An introduction to goals-based investing
                              Often times you’ll hear the financial and news media refer to a particular market
                              index being up or down an “X” number of points on the day. What is an index?
                              What are the uses for indexes and some of their potential negatives? In this
                              article, we will:
                              •   Examine the more popular stock and bond market indexes, including how
                                  they are calculated, and identify some of their positive attributes and some
                                  of their shortcomings.
                              •   Consider why, at times, the market does not always reflect what we might
                                  see or hear about the real economy.
                              •   Introduce the concept of goals-based investing as a benchmarking process,
                                  rather than benchmarking portfolios to a specific index or indexes.

                              But before we begin…

                              What is an index? A stock market index is a statistical composite that measures
                              the changes in value of the market it is designed to follow. There are many indexes
                              that follow numerous global stock and bond markets, including broad stock
                              markets as well as sectors within the broader market, such as specific industries
                              or types of stocks (such as those of large, medium or small firms). Indexes are
                              often used as barometers of the performance of the stock market, and in the
                              financial media, they are at times used as barometers of the economy – despite
                              the fact that the market and the economy can, at times, seem very disconnected.

                              Indexes serve other purposes as well. Most investors use indexes to monitor their
                              own portfolios, and also as benchmarks for performance comparisons. But how
                              relevant are these indexes, or benchmarks, to high net worth investors? Should
                              you be judging the performance of your investment portfolio(s) relative to a
                              statistical composite, or should you look to goals-based investing instead? What
                              are some behavioural investing pitfalls to watch out for when benchmarking to an
                              index rather than using a goals-based approach?
                                                                                             Continued on page 2

                                                  RBC Phillips, Hager & North Investment Counsel
Page 2 of 7

What's in an index anyway?...
Continued from page 1

Connecting the disconnect:                   and adaptive systems that are not                                                the returns for investors. Valuation can
Why market and economic                      always efficient at rationally pricing                                           be influenced by a number of factors,
performance are often out of                 in news. As a result, in the short-term,                                         including sentiment and emotion.
sync                                         emotion, which can be irrational at                                              As we look out over holding periods
                                             times, tends to dominate investor                                                beyond 6-12 months in the chart, the
The link between financial markets and       returns (i.e., we may over or under                                              contribution factor from earnings per
the underlying economy is constantly         react to news). But over the long term,                                          share (EPS) dominates returns. So, in
debated in social media and news             fundamentals of businesses that make                                             the long term, company fundamentals
outlets, and perhaps even within your        up the economy dominate shareholder                                              do, in fact, tend to dominate returns.
own social network. When debating            returns, as illustrated in Chart 1. Here
the relationship between the economy         we show that over shorter periods of                                             If we take a look at the relationship
and the market, it’s important to            time, valuation as depicted by the price-                                        between nominal U.S. GDP growth
understand the underlying market index       to-earnings - or P/E - ratio for the S&P                                         and company earnings in the S&P 500
itself (we’ll help here in a few pages),     500 Index dominates the majority of                                              Index over the last sixty years (Chart 2),
exactly which economic variable(s) are
being compared (lagging, coincident, or
leading), and over what time period the      Chart 1: Short-term holding periods impacted by market sentiment when
comparison is being made.                    compared to long-term time horizons.

                                              Contribution to different holding period returns between price-to-earnings - or P/E -
Recent history provides us with an                        ratio and earnings per share growth for the S&P 500 Index
excellent example of a perceived
disconnect between markets and the
economy. In April 2020, while both the
global COVID-19 case and death count
were climbing, the technology-heavy
NASDAQ Composite Index climbed
back into positive territory for the year.
It seemed then that the market was
disconnected from what was going
on in the real world, as economic
indicators were collapsing and
COVID-19 cases and deaths continued
to mount. Returning to what I said
previously about making a fair apples-       Source: RBC Capital Markets Global Research, Bloomberg LLC. Data from Jan 31/90 through May 29/20, using monthly time weighted returns from the S&P
to-apples comparison, you are likely         500 Index in U.S. dollars, including dividends and gross of any fees such as investment management, trading costs or commissions. Return contribution
                                             from price-to-earnings (P/E) calculated by the monthly percentage change in the P/E ratio for the S&P 500 Index. Return contribution from earnings per
already thinking “Is the technology-         share calculated by the difference between the monthly index return for the S&P 500 Index in U.S. dollars, and the return contribution from P/E ratios.
                                             Past performance of the S&P500 Index is no guarantee of future results, and investments cannot be made directly in an index.
heavy NASDAQ representative of the
underlying U.S. economy?”, as well
                                             Chart 2: Exponential Growth of Annual U.S. Nominal Gross Domestic
as thinking about what economic
                                             Product (GDP), and Annual Trailing S&P500 Index Earnings (1956-2019)
indicators am I referring to as it relates
to the disconnect. Indeed, the NASDAQ
Composite isn’t a full representation
of the U.S. economy, as the economy is
composed of many different industries,
in addition to technology. Instead,
the index was driven higher because
global lockdowns meant a surge in
demand for the services and products
of technology companies. And so within
that context, its rise begins to make
more sense.

Generally speaking, financial markets
tend to be forward-looking, complex,         Source: Federal Reserve Bank of St. Louis, FactSet, data from January 1956 to January 2019. All in U.S. dollars.

                                                                                                                                                                  Continued on page 3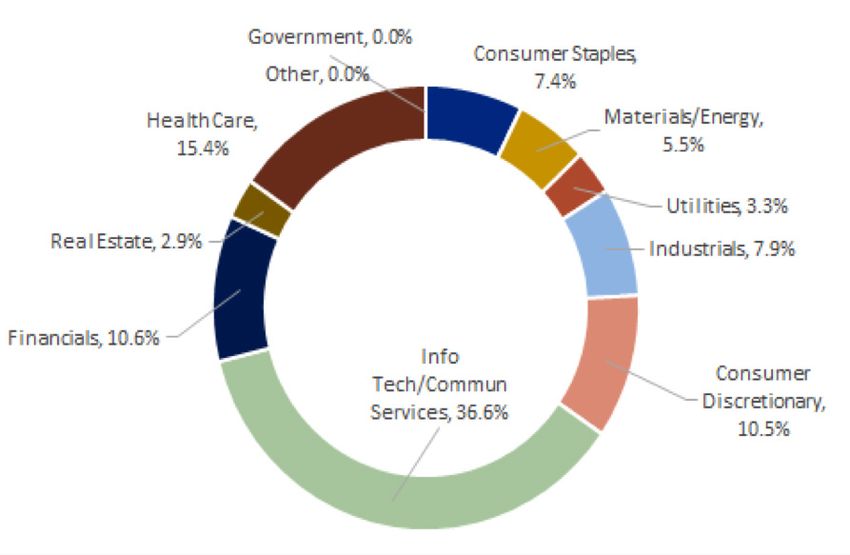
Page 3 of 7
What's in an index anyway?...
Continued from page 2
there has been a fairly similar growth Chart 3: Annual Nominal U.S. GDP Growth (%), and Annual Trailing S&P 500
rate over this time; and this despite Index Earnings Growth (1956-2019)
the volatility in each data set when
you look at them on an annual basis
(Chart 3). Using a broad-based index
such as the S&P 500 Index compared
to the underlying growth rate of the
U.S. economy, we can see that, despite
the ups and downs in the economic
cycle creating short-term disconnects
between the economy and the market,
over the long-term the fundamentals of
the market align more closely with the
economy.
We’ll now focus on some of the issues Source: Federal Reserve Bank of St. Louis, FactSet, data from January 1956 to January 2019. All in U.S. dollars. “LHS” = left-hand side of y-axis, “RHS” =
when making comparisons between right=hand side of y-axis, “LTM” = last twelve months, referred to as Annual trailing “EPS” or Earnings Per Share Growth for the S&P500 index.
portfolio returns and market indexes,
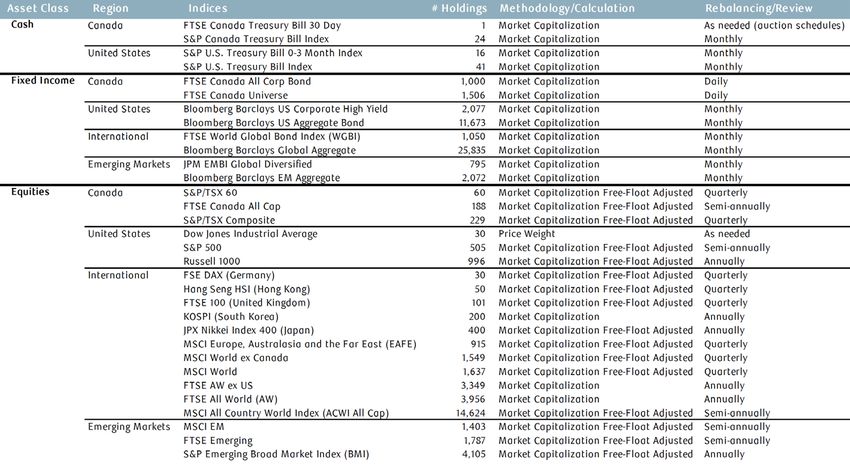
commonly known as benchmarking. Table 1: Popular market indices grouped by asset class
The popular crowd
Sometimes I find myself rolling my
eyes while I am in the car listening
to the news. For instance, when I
hear “The Dow Jones was down eight
hundred points this morning”, I’m often
disappointed with the lack of context
associated with this statement. I
have nothing against the Dow Jones
Industrial Average (DJIA for short, and
commonly referred to as the “Dow”),
which is a price-weighted average of
30 blue-chip U.S. companies. In order
to calculate the value of the Dow you
take current prices of the 30 stocks Source: Morningstar Direct, Bloomberg, FTSE Russel, Morgan Stanley Capital International, and Standard & Poor's. Number of holdings in each index is
as of June 29, 2020.
that make up the Index and add them
together, and then divide by the Dow
divisor. As a result of this calculation So again, what does “The Dow Jones course sometimes sensationalizing the
methodology, stocks that carry a price was down eight hundred points this news helps to sell adverting and grow
that is high relative to other stocks’ morning” really mean? Does that subscriptions.
prices can dominate daily price swings tell me much about my portfolio, the
in the Dow. Sudden price increments economy, or the outlook for the market There are a host of different market
or reductions in high-priced stocks and the economy? No, of course indexes out there which investors could
can lead to big jumps or drops in the not. And context is everything when and do use to benchmark portfolio
Dow. Also, certain corporate actions, it comes to index “levels” quoted in performance. In Table 1, we list some of
like going ex-dividend (i.e., wherein the the media. The percentage change in the most popular indexes today from
dividend goes to the seller rather than the index’s level is far more insightful across the globe, how many securities
to the buyer), can result in a sudden than merely the absolute number. are embedded within the index, and
drop in the Dow on what’s known as the Hearing the statement above in 2008 briefly how they are calculated (i.e.,
ex-date. The high correlation among when the DJIA Index was below 10,000 price-weighted, as in the case of DJIA,
multiple constituents within the Index meant more than when you hear that and market capitalization weighted
can also lead to higher price swings in today when the Index’s level is above in the case of the S&P 500 Index). We
the Index. 26,000. Framing is everything, but of cannot list all indices in this note, as
Continued on page 4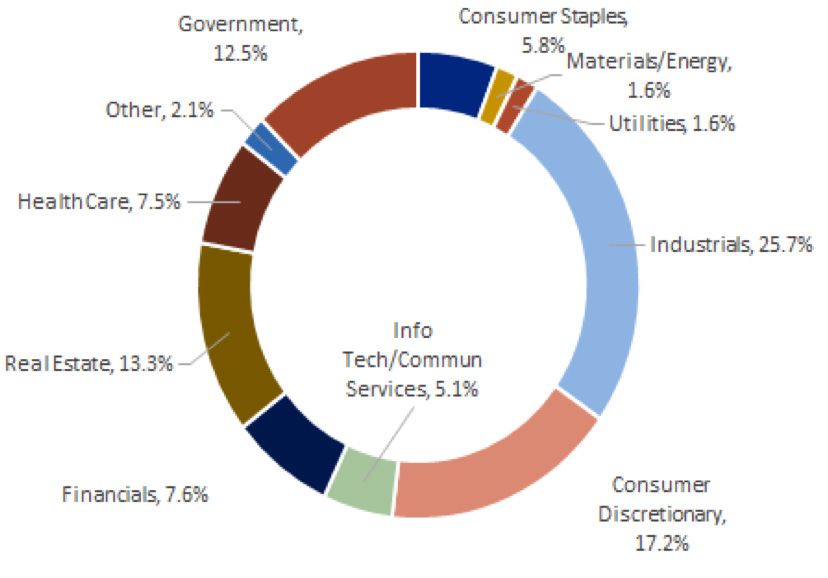
Page 4 of 7

What's in an index anyway?...
Continued from page 3

there are more than 5,000 indexes                                                     of the firm. Price-weighted indexes                                    which industries make up a more
in the U.S. alone today. There are                                                    emphasize the performance of                                           popular index such as the S&P 500.
sector-specific indexes, factor-based                                                 expensive stocks, while cap-                                           For instance, Information Technology/
indexes that track securities based on                                                weighted indexes emphasize the                                         Communication Services made up just
characteristics such as growth, value,                                                performance of large-cap stocks.                                       about 5% of the value-add to U.S. GDP
momentum, and, many, many others.                                                                                                                            in 2019, yet the industry weight in the
If you are going to use market                                                  •     Are the comparisons appropriate                                        S&P 500 Index was closer to 37%. While
indexes as a comparison tool to your                                                  and meaningful - Are the indexes                                       industry classifications related to GDP
investment portfolio, it’s important to                                               used to compare performance                                            or an index are never perfect matches,
ensure you understand some, if not all,                                               closely matched to your own                                            we have done our best to attempt to
of the following:                                                                     portfolio goals, objectives, risk                                      map the two sets of data to create a
                                                                                      tolerance and risk capacity?                                           fair apples-to-apples comparison (for
  •     The composition of the index - For                                            Comparing performance of a                                             illustration purposes only). We also
        example, whether it is broad-based,                                           portfolio to an inappropriate index                                    considered the revenue contribution of
        covers only a market segment, or                                              may lead to less than optimal                                          industry groups in the S&P 500 Index to
        excludes certain industries.                                                  investment decisions, and to                                           see if there was any valuation distortion
                                                                                      investors asking questions like                                        in the Index data, but the underlying
  •     The composition of the                                                        “How come I’m behind?” (a.k.a.                                         revenue contribution by industry group
        underlying companies – Where                                                  “FOMO”, or “fear of missing out”                                       compared to the value-add by industry
        are revenue and profits generated                                             syndrome).                                                             group as a percentage of GDP was quite
        from? Domestically, overseas, or a
                                                                                                                                                             similar to the market capitalization
        combination thereof?                                                    •     Overall portfolio returns will
                                                                                                                                                             weights.
                                                                                      be impacted by fees such as
  •     How the index has been                                                        investment management fees,
        calculated - If they are market-                                                                                                                     Given my earlier remarks, I also
                                                                                      trading costs, commissions, etc.
        cap-weighted indexes, they will be                                                                                                                   reviewed the differences between
                                                                                      regardless of the particular index
        dominated by larger firms, even                                                                                                                      industry group contribution to GDP and
                                                                                      used for comparison.
        if they are “total market” indexes                                                                                                                   the Dow components over the same
        covering firms of all sizes. Equal-                                   As shown in the pie charts (Charts                                             time period (Chart 6). It may surprise
        weighted indexes will tell you how                                    4 and 5), there is a considerable                                              some readers that the weight of
        each of the sample stocks has                                         difference between which industries                                            Industrials in the Dow Jones Industrial
        performed, regardless of the size                                     contribute to reported U.S. GDP, and                                           Average (DJIA) was less than 15% as of

Chart 4: U.S. Value Added by Industry Group as a                                                                      Chart 5: Industry Group weights as % of S&P500 Index, as
Percentage of GDP, as of April 2020                                                                                   of April 2020

Source: U.S. Bureau of Economic Analysis (BEA), FactSet. All numbers in U.S. dollars, all data as of April 6, 2020. All industry classifications for BEA numbers have been referenced back to the BEA’s paper titled “GUIDE TO INDUSTRY
CLASSIFICATIONS FOR INTERNATIONAL SURVEYS 2017”. BE–799 (REV. 12–2017).

                                                                                                                                                                                                    Continued on page 5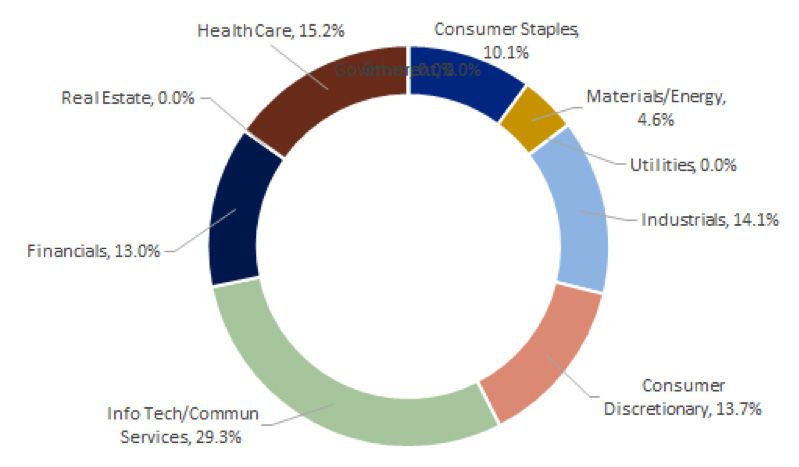
Page 5 of 7
What's in an index anyway?...
Continued from page 4
Chart 6: Industry Group weights as % of Dow Jones Industrial Average, as Specific products and solutions are
of April 2020 a consequence of first having stated
objectives and goals, with reasonable
return expectations. Goals-based
investing allocates assets to specific
solutions in order to meet these
financial objectives, and to address
liabilities over multiple time horizons.
At RBC PH&N Investment Counsel, our
Investment Counsellors understand
that the risk-return balance for
each investor is critical, but that it
can be achieved while keeping the
overall goals of the investor in mind.
Understanding an investor’s unique
circumstances and financial goals
Source: Index data from Bloomberg LLP. Weight in Dow Jones Industrial Average (DJIA) based on price-weighted methodology, industry groups is the key to long-term financial
represented as by the GICS (Global Industry Classification Standard) classification scheme. The GICS is an industry taxonomy developed in 1999 by MSCI
and Standard & Poor's (S&P) for use by the global financial community. The GICS structure consists of 11 sectors, 24 industry groups, 69 industries and success. Yet we practice knowing that
158 sub-industries into which S&P has categorized all major public companies.
circumstances and goals are dynamic
and need to be revisited regularly as
April 6/20. There are similar differences some of the index issues mentioned the market continues to move up and
between contributing industries to early on in this note, investors need down. Financial plans and investment
U.S. GDP and the DJIA. For example, to be cognizant of the potential policy statements are not static tools.
Information Technology carries more for performance chasing when it They are dynamic and need to be
weight in the Index than it does as a comes to benchmarking to an index updated over time.
contributing industry to GDP, while Real or indexes. For example, chasing
Estate carries no weight in the DJIA and “winners”, selling recent “losers”, and We believe that the goals-based
its value-add to GDP in 2019 was just a general “fear of missing out”, or investment framework also creates
over 13%. “FOMO” behaviour, can lead to poor a sound basis for the adviser/client
investing behaviour, such as market- relationship. Investors are not likely
It’s always important to ask the right timing and “short-termism”. Beating to be disappointed over the long-term
questions when comparing portfolio the markets, especially over the short when they are not promised superior
performance relative to any index or term, becomes the focus, rather than returns and won’t rely on them to
indexes. Usually comparing returns achieving the investor’s long-term achieve their objectives. If they end up
after fees, taxes, and on a risk-adjusted objectives. beating the market, so much the better,
basis would make a fair apples-to- but that’s the icing on the cake rather
apples comparison. But this is not A different approach, goals-based than the primary value proposition.
always easy to do on your own. investing, can help to avoid some of
these inherent risks when it comes to In his book titled “Personal Benchmark:
Trying to avoid “Benchmark-itis” index-based benchmarking. Integrating Behavioral Finance and
Investment Management”, co-author
I think it is natural in almost any An introduction to goals-based and behavioural economist, Daniel
setting to want to set a benchmark investing: viewing the portfolio Crosby, noted the following outcomes
against which we can gauge as a means to an end for those clients following a traditional
performance. We do that in so many investment portfolio measurement to
other aspects of our lives – losing Goals-based investing can be a an index during the 2008 financial crisis:
weight, in school, in sports, etc. relatively simple approach for investors
So it makes sense that we do the who have specific wealth generation/ • “50% chose to fully liquidate their
same when it comes to portfolio preservation goals and objectives, portfolios or at least their equity
management. However, we should be and who understand and appreciate portfolios, including many high
mindful of some of the measurement these things within the context of their net worth clients who had no
and behavioural downfalls in complete wealth plan. The focus of the immediate need for cash.
monitoring performance simply process is on the individual investor,
relative to a benchmark. In addition to not “generating excess returns”.
Continued on page 6
Page 6 of 7

What's in an index anyway?...
Continued from page 5

 •     10% made significant changes in                                  Update: What we are watching                   Much as I wrote in an article last month,
       their equity allocation, reducing it                                                                            financial markets continued to hold on
       by 25% or more.”                                                 Happy belated Canada Day! Not only             to their gains from the March lows. The
                                                                        did we get to celebrate the 153rd              combination of liquidity injections from
He then went on to note that those                                      birthday of our great country, but we          global central banks, significant fiscal
clients in goals-based investment                                       also passed the halfway point for the          support from various governments,
approaches:                                                             year. As I sit back and take stock of          a trend of fewer coronavirus cases
                                                                        what we’ve just lived through, when            in previous hotspots, and as the
 •     “75% made no change:
                                                                        it comes to the markets the first-half         economy begins to reopen, consumer
 •     20% decided to increase the size                                 of 2020 has been a whipsaw of sorts -          and business spending data seems to
       of their immediate needs pool but                                much like my golf game has trended in          support the slow/gradual healing thesis
       left their longer-term assets fully                              the last few weeks!                            playing out. The near-term outlook
       invested.”                                                                                                      remains mixed as we look out to the
                                                                        The first half of 2020 journey was not         second half of the year, considering
Source: Widger, C., Crosby, D. (2014) Personal Benchmark: Integrating
Behavioral Finance and Investment Management. John Wiley & Sons, Inc.   the way anyone could have imagined             the U.S.-China trade and currency
                                                                        this year going. The first quarter of          war continues on, and an increasing
Goals-based investing may lead to
                                                                        2020 saw the S&P 500 Index fall 19.6%.         concern (yet to be discounted by the
fewer panicked situations for investors
                                                                        The second quarter of 2020 saw the             market) of a Joe Biden win in November
over a cycle, which could potentially
                                                                        S&P 500 rise 20.5%. New all-time highs         (Joe Biden’s policies and fiscal plans
lead to less ill-informed portfolio
                                                                        were followed by a once in a lifetime,         have generally been considered less
changes, and those which tend to be
                                                                        idiosyncratic event that shut down             market friendly than the Republican
driven by emotions, rather than logic,
                                                                        global markets and potentially could           Party thus far).
as described above. Portfolios may be
                                                                        change the way we live our daily lives.
managed separately to reflect different
                                                                        Yet, here we are, more intelligent about       Please reach out to your Investment
goals and objectives – and, therefore,
                                                                        the virus, and working closer towards          Counsellor with any questions related
risk tolerance, time horizon and specific
                                                                        a cure each day. Even as the world             to the information we have presented in
liquidity needs – rather than simply
                                                                        battled COVID-19, shutdown businesses,         this article, at any time.
trying to ‘beat a benchmark’. When
                                                                        and severely limited economic activity
a bear market approaches, within a
                                                                        throughout 2Q, investors looked to 2021        Be well,
goals-based approach there could be
                                                                        - and led the S&P 500 Index to its third       Stu
less of an impact on short-term needs
                                                                        highest quarterly gain in over 41 years.
which are likely invested differently
(i.e., more conservatively), than the
                                                                        And for all that the virus has changed
long-term needs would have been. As
                                                                        in our lives, general market trends
a result, an investor may have more
                                                                        in equities have not. Large cap and
confidence they will weather the storm,
                                                                        technology companies are still
and be less likely to panic and sell
                                                                        beneficiaries of low-interest rates,
during inopportune times in the market.
                                                                        work-from-home trends, sustainable
                                                                        growth outlooks, growing free-cash
If you have any questions related to
                                                                        flow, and less levered balance sheets.
goals-based investing, or would like to
                                                                        And, technology adoption rates across
better understand how benchmarking
                                                                        a number of silos have accelerated as a
your portfolio works, please contact
                                                                        result of this new reality we are living in.
your Investment Counsellor.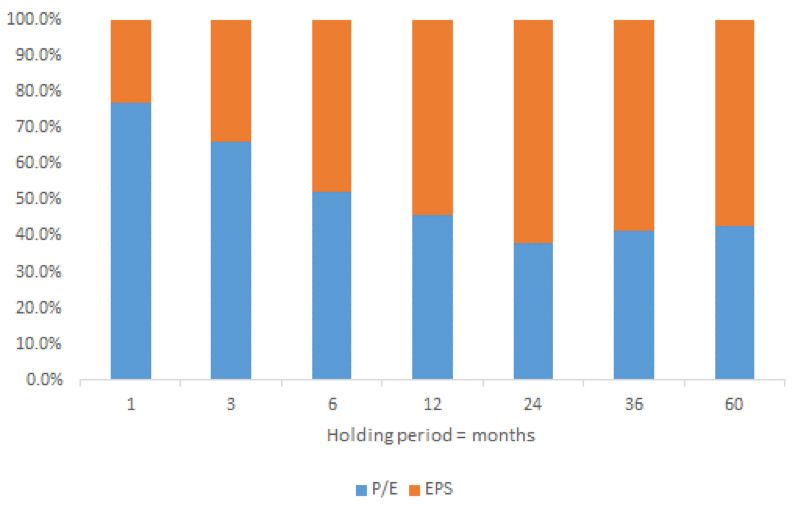
Page 7 of 7

Dow Jones Industrial Average: The Dow Jones Industrial Average (the “Dow”), is a price-weighted measure of 30 U.S. blue chip companies. The
index covers all industries except for utilities and transportation. The index Launch Date is May 26, 1896. The value of the index is the sum of
the price of one share of stock for each component company divided by a factor which changes whenever one of the component stocks has a
stock split or stock dividend, so as to generate a consistent value for the index.

S&P 500 Index: The S&P 500 Index includes 500 companies across many sectors of the U.S. economy. The index is weighted by market
capitalization so bigger companies make up a larger proportion of the index than smaller companies. The index is designed to measure
performance of the broad US economy through changes in the aggregate market value of the largest US companies.

Past performance is not indicative of future results. This document has been prepared for use by RBC Phillips, Hager & North Investment
Counsel Inc. (RBC PH&N IC). The information in this document is based on data that we believe is accurate, but we do not represent that it is
accurate or complete and it should not be relied upon as such. All opinions and estimates contained in this document constitute RBC PH&N IC
and RBC Global Asset Management (RBC GAM) judgment as of the date of this report, are subject to change without notice and are provided in
good faith but without legal responsibility. This report is not an offer to sell or a solicitation of an offer to buy any securities. Persons, opinions or
publications quoted do not necessarily represent the corporate opinion of RBC PH&N IC. This information is not investment advice and should
only be used in conjunction with a discussion with your RBC PH&N IC Investment Counsellor. This will ensure that your own circumstances
have been considered properly and that action is taken on the latest information available. Neither RBC PH&N IC, nor any of its affiliates, nor
any other person accepts any liability whatsoever for any direct or consequential loss arising from any use of this report or the information
contained herein. This document is for information purposes only and should not be construed as offering tax or legal advice. Individuals
should consult with qualified tax and legal advisors before taking any action based upon the information contained in this document.

Please consult your advisor and read the prospectus or Fund Facts document before investing. There may be commissions, trailing commissions,
management fees and expenses associated with mutual fund investments. Mutual funds are not guaranteed, their values change frequently
and past performance may not be repeated. Except as otherwise noted, the indicated rates of return are the historical annual compounded
total returns for the periods indicated. The rates of return for periods of less than one year are simple rates of return. All rates of return include
changes in unit value and reinvestment of all distributions, and do not take into account sales, redemption, distribution or optional charges
or income taxes payable by any unitholder that would have reduced returns. RBC Funds, BlueBay Funds and PH&N Funds are offered by RBC
Global Asset Management Inc. (RBC GAM Inc.) and distributed through authorized dealers in Canada.

RBC Global Asset Management (RBC GAM) is the asset management division of Royal Bank of Canada and includes RBC GAM Inc. and RBC
Global Asset Management (UK) Limited. Information provided by RBC GAM constitutes its opinion as of the date indicated only, and is not
intended as specific investment, financial or other advice and such information should not be relied upon for providing such advice. RBC GAM
takes reasonable steps to provide up-to-date, accurate and reliable information, and believes the information to be so when provided. Interest
rates, market conditions, tax rulings and other investment factors are subject to rapid change which may materially impact analysis that is
included in this document.
Some of the products or services mentioned may not be available from RBC PH&N IC; however, they may be offered through RBC partners.
Contact your Investment Counsellor if you would like a referral to one of our RBC partners that offers the products or services discussed. RBC
PH&N IC, RBC Global Asset Management Inc., RBC Private Counsel (USA) Inc., Royal Trust Corporation of Canada, The Royal Trust Company,
RBC Dominion Securities Inc. and Royal Bank of Canada are all separate corporate entities that are affiliated. Members of the RBC Wealth
Management Services Team are employees of RBC Dominion Securities Inc. RBC PH&N IC is a member company of RBC Wealth Management,
a business segment of Royal Bank of Canada. ® / ™ Trademark(s) of Royal Bank of Canada. RBC, RBC Wealth Management and RBC Dominion
Securities Inc. are registered trademarks of Royal Bank of Canada. Used under license. © RBC Phillips, Hager & North Investment Counsel Inc.
2020. All rights reserved. 20_13945_1029									                                                                                    (07/2020)
You can also read