OCEAN FREIGHT MARKET UPDATE - DHL
←
→
Page content transcription
If your browser does not render page correctly, please read the page content below
PUBLIC

DHL Global Forwarding, Freight

OCEAN FREIGHT
MARKET UPDATE
March 2019
Publication Date 4th March 2019
Dominique von Orelli – Global Head, Ocean Freight

                                                         1
PUBLIC

Contents

    TOPIC OF THE MONTH
    Asia – North Europe capacity set to surge this year

    HIGH LEVEL DEVELOPMENT

    MARKET OUTLOOK
    Freight Rates and Volume Development

    ECONOMIC OUTLOOK & DEMAND DEVELOPMENT

    CAPACITY DEVELOPMENT (see TOPIC OF THE MONTH)

    CARRIERS

    REGULATIONS

    DID YOU KNOW?
?   Independent short-sea operators losing market share to main line carriers

                                                                                DHL Global Forwarding | OFR Market Update | Mar 2019        2
Topic of the Month
 Asia – North Europe capacity set to surge this year

Vessel capacity on the Far East – North Europe trade lane remains a key challenge

Carriers are planning to add up to 28,000 TEU weekly on the Asia – North Europe trade in 2019, representing a capacity increase of 10%
on the route. Weekly capacity on this route will reach 300,000 TEU in Apr 2019, compared to an average of 270,000 TEU in the same
period last year. Since the first megamax ships of over 18,000 TEU were delivered in 2013, they have been deployed exclusively on
the Far East – North Europe route.

On short-term, carriers are withdrawing capacity by cancelling sailings (blanked sailings). Any further deterioration in spot rates could
trigger further capacity withdrawals. However this would leave carriers saddled with more surplus ships that, also because of their
size, see limited deployment options outside of the Asia – Europe route.

In Feb MSC sent the 19,462 TEU MSC ELOANE to the US West Coast for one sailing. The shift will see the first-ever ‘megamax’ ship
call at a US port. While deployments of these ultra large vessels on the transpacific routes are only ad hoc arrangements for the time
being, COSCO will start assigning seven of its ‘megamax’ ships to the OCEAN Alliance’s Far East - Middle East ‘MEA5’ service on
permanent basis from April. The carrier’s move could help ease capacity pressure on the Far East – North Europe route, but could shift
pressure towards the Middle East routes.

  Source: Alphaliner

                                                                                                         DHL Global Forwarding | OFR Market Update | Mar 2019   3
PUBLIC
High Level Market Development – Supply and Demand
ECONOMIC OUTLOOK GDP GROWTH BY REGION1) DHL TRADE BAROMETER6) SUPPLY/DEMAND
SUPPLY/DEMANDGROWTH
GROWTH(ANNUALIZED),
(ANNUALIZED), IN % 2)2)
IN%
75
7%
CAGR 70
2018F 2019F 2020F 2021F 2022F 6%
(2019-22) 65
60 5% Demand
EURO 2.1% 1.6% 1.5% 1.5% 1.7% 1.6% Growth
55 4% %
MEA 2.9% 3.1% 3.4% 3.3% 3.3% 3.3%
50 3%
AMER 2.6% 2.6% 2.1% 1.8% 1.8% 2.1%
45 Ocean 2%
ASPA 4.9% 4.7% 4.5% 4.7% 4.7% 4.7% 40 Supply
Global 1%
35 Growth %
DGF World 3.3% 3.1% 2.9% 2.8% 2.9% 2.9% 30
0%
2016 2017 2018F 2019F 2020F 2021F 2022F
Q1 Q2 Q3 Q4 Q1 Q2 Q3 Q4 Q1 Q2 Q3 Q4
’16 ’17 ’18
WORLD CONTAINER INDEX (WCI)3) SHANGHAI CONTAINERIZED FREIGHT INDEX (SCFI)4) BUNKER PRICE INDEX5)
3,000 1,200 1,000
1,100
2,500 800
1,000
2,000
900 600
1,500 800
700 400
1,000 Actual Actual BIX 380
600
200
500 Forecast Forecast BIX MGO
500
0 400 0
Q1 Q2 Q3 Q4 Q1 Q2 Q3 Q4 Q1 Q2 Q1 Q2 Q3 Q4 Q1 Q2 Q3 Q4 Q1 Q2 Q1 Q2 Q3 Q4 Q1 Q2 Q3 Q4 Q1 Q2
’17 ’18 ’19 ’17 ’18 ’19 17 18 ’19
1) real GDP, Global Insight, Copyright © IHS, Q4 2018 . All rights reserved. 2) Demand growth = Port-to-Port Container Traffic growth. Supply growth = Fleet Growth. Source: Drewry Maritime Research. 3) Drewry, in USD/40ft container, including BAF & THC both ends, 42 individual routes, excluding
intra-Asia routes, 5.5% predicted freight rate increase. 4) Shanghai Shipping Exchange, in USD/20ft container & USD/40ft ctnr for US routes, 15 routes from Shanghai. 5) Bunker Index, in USD/metric ton, Bunker Index MGO (BIX MGO) = avg. Global Bunker Price for marine gasoil (MGO) port prices; (BIX
380= avg. Global Bunker Price for all 380 centistoke (cSt) port prices; both index published on the Bunker Index website., Forecast based on HIS Market assumption of avg. USD70 per Brent barrel equaling Nov18 price. 6) DHL Global Trade Barometer Dec18, index value represents weighted average of
current growth and upcoming two months of trade, a value at 50 is considered neutral, expanding above 50, and shrinking below 50.
DHL Global Forwarding | OFR Market Update | Mar 2019 4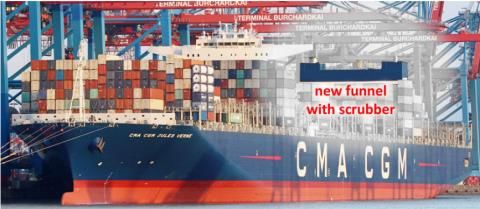
PUBLIC

  Market Outlook March 2019 – Major Trades

Carriers announcing additional blank sailings because of the slow volume pick up after Chinese New Year
EXPORT REGION IMPORT REGION                      CAPACITY                RATE           EXPORT REGION    IMPORT REGION            CAPACITY               RATE
                                AMNO                  =                   +                                    AMNO                    =                   ++
       EURO                                                                                AMLA
                                 AMLA                 =                   =                                     ASPA                   +                   +
                                 ASPA                 -                  +/=                                    EURO                   =                   ++
                                MENAT                 -                  +/=                                   MENAT                   =                   +
                                  SSA                 =                   =                                      SSA                   --                  ++

                                 AMLA                 =                   =                                     ASPA                   =                   =
       AMNO                                                                                 ASPA
                                 ASPA                 =                   =                                    AMNO                    -                       -
                                EURO                  =                   =                                     AMLA                   =                       -
                                MENAT                 =                   +                                     EURO                   +                       -
                                  SSA                 =                   =                                    MENAT                   =                   =
                                                                                                                                       + (SEA-AU)          - (SEA-AU)
               Strong         Moderate         No         Moderate       Strong
   KEY
              Increase
                         ++
                              Increase
                                         +
                                             Change
                                                      =
                                                           Decline
                                                                     -
                                                                         Decline
                                                                                   --                         OCEANIA                  = (NEA–AU)          - (NEA–AU)
                                                                                                                                       = (NZ)              = (NZ)
Source: DGF

                                                                                                        DHL Global Forwarding | OFR Market Update | Mar 2019            5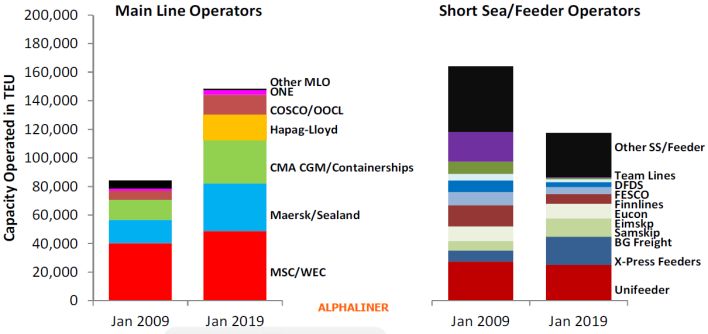
PUBLIC

  Market Outlook March 2019 – Ocean Freight Rates Major Trades
    Market outlook on smaller trades available in the back-up

  OCEAN FREIGHT RATES OUTLOOK
                             The pick-up after the CNY holiday is slower than expected and there is some pressure on the FAK rates. Carriers announcing additional
  ASPA – EURO
                             blank sailings.
                             Ocean rates slightly increasing for certain commodities/short term agreements (monthly FAK). The slight increase is supported by the
  EURO – ASPA & MEA
                             space crunches because of upcoming blank sailings and bunker developments. Long Term agreements remain stable.
                             Rates have declined till end Feb 2019. Space is also manageable despite the post-CNY blank sailings. There could be upswing in rates
  ASPA – AMLA
                             during mid-March as volumes traditionally pick up during this period. Thus expecting tighter space in Mar 2019.
                             Carriers continue to announce void sailings into Mar due to the slow recovery from post CNY. Carriers also announced an extension of
  ASPA – AMNO
                             Feb rates till 14th Mar 2019.
                             Ocean rates are strong and still increasing; inland carriages in US remain problematic; congestion on USEC & CAEC causes severe
  EURO – AMNO                delays into USMW area. CA: carriers are pushing for a congestion fee because of delays at Montreal port. MX: Carriers pushing for a
                             PSS based on the tight space situation

  ASPA – MENAT               Carriers have extended their Feb rates till mid Mar 2019, and we do not foresee any huge increase/surprise in March.

                             Several carriers have announced a re-structuring as well as introduction of new services on the Intra-Asia trade. The impact on the rates
  ASPA – ASPA                and capacity remains to be seen. Manila port is still congested, especially Manila South. Cargo is being moved to Batangas and Subic
                             Bay as an alternative. However, these two ports are also starting to experience congestion as well.
  AMNO – EURO                Space remains tight out of Houston to Europe NC. MSC is now calling London Gateway instead of Felixstowe.

Source: DGF

                                                                                                          DHL Global Forwarding | OFR Market Update | Mar 2019           6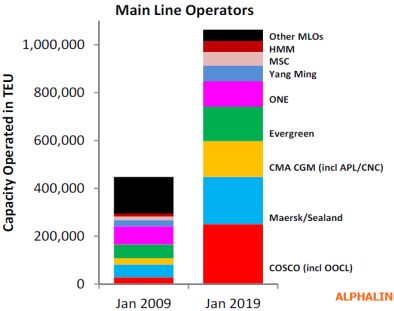
PUBLIC
  Economic Outlook & Demand Development
  Global Economy Growing More Slowly But Not Slumping - Yet
                               IT fell back into recession, DE came close. However, FR fared a little better & ES showed continued vigor. IHS Markit projects real GDP
          EURO                 growth to slow from 1.8% in ’18 to 1.2% in ’19 & 1.0% in ’20 before returning to 1.2% in ’21. UK growth rates in ’19-’21 are marked down by
                               0.2 ppt owing to Brexit-related concerns.

                               Improved financial conditions in early ’19 (equity values have rebounded, dollar has retreated, long-term Treasury yields low, risk spreads
          AMNO                 narrowing) are helping to support continued growth in the private sector. On the other hand, less support from the public sector is projected.
                               These effects roughly offset, leaving growth forecast little changed at 2.4% in 2019, 2.0% in 2020, and 1.7% in 2021.

                               Rebounds in consumer spending & private fixed investment have improved growth in JP. Quarterly growth in ’19 is likely to remain volatile.
                               Prolonged uncertainties over US-CN trade will continue to restrain JP’s exports, also weighing on fixed investment. CN’s growth in ’18 was
          ASPA
                               6.6% - the slowest since 1990. While continued pressure on the CN economy will lead to additional stimulus, CN’s large debt overhang will
                               keep the government cautious but it should be able to stabilize the economy as it has done successfully in the past.

                               Vulnerable to headwinds & structural trends facing CN’s economy. Trade war between CN & US along with the CN’ government’s deleveraging
      EMERGING
                               campaign, are cutting CN trade volumes & ensnaring other countries (especially in Asia) in the trade conflict. The big structural shift in CN
      MARKETS
                               from investment to consumer spending means slower growth in demand for raw materials from the emerging world.

                               Global PMIs continue their slide. Manufacturing led the slowdown, with the factory output index easing to a 31-month low & slipping closer
                               to stagnation amid an increased rate of decline in worldwide export volumes. Composite PMIs indicated that growth slowed in all major
    DEMAND
                               developed & emerging economies, with the exceptions of the US & IN, both of which saw indexes hold steady thanks to faster manufacturing
  DEVELOPMENT
                               expansions. UK reported an especially weak performance, while BR & RU pointed to relatively solid growth. CN report one of its slowest
                               expansions since mid-2016.

Source: IHS Markit Global Executive Summary, IHS Purchasing Manager Index Manufacturing, a PMI at 50 is considered neutral, expanding above 50, and business shrinking below 50.

                                                                                                                                                      DHL Global Forwarding | OFR Market Update | Mar 2019        7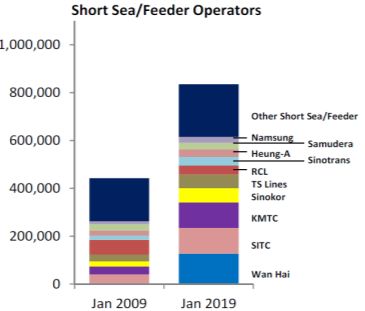
PUBLIC

  Carriers 1/2
  CARRIERS
 MSC has secured a $439M syndicated loan to finance the manufacture and installation of exhaust gas scrubbers on 86 MSC containerships. Funding will be
 provided by five banks under a consortium led by BNP Paribas. The amount is backed by Sinosure, China’s state-owned Export and Credit Insurance Corporation,
 with the conversions to be carried out at various Chinese yards. MSC’s container ship fleet currently comprise of 523 vessels with a total capacity of 3.3 MTEU, incl
 195 owned ships with an overall capacity of 1.01 MTEU. The loan secured by MSC is expected to finance the retrofit of scrubbers on MSC’s existing ships,
 including long-term leased tonnage. MSC has previously confirmed it will fit scrubbers on its fleet of 23,000 TEU newbuildings that are scheduled for delivery in
 2019 and 2020. MSC was also behind a $197M scrubber order placed with Finland’s Wärtsilä in July 2018 for 9,000 – 14,000 TEU containerships. Furthermore
 MSC has also reached agreements with various non-operating owners to install scrubbers on several time chartered ships. These moves will bring the total
 tally of scrubbers for MSC to over 120 units, making the MSC scrubber fleet the largest by far amongst all operators. So far, MSC has eschewed the LNG option
 for its fleet and has instead opted for a scrubber-centered solution as it prepares to comply with the new IMO2020 Sulphur emissions rules.
 Hapag-Lloyd will convert its 2014-build ULCS container vessel SAJIR to operate on liquefied natural gas (LNG), instead of fuel oil. The ship’s heavy fuel oil-
 burning engine will be modified to either burn natural gas or low-sulphur fuel oil (LSFO), and its fuel system will be adapted accordingly. Hapag-Lloyd will implement
 the changes along with the ship’s first class dry dock in the 2 nd half of 2019, to have the SAJIR redelivered before the Jan 2020 deadline, when the IMO’s strict new
 sulphur oxide emissions regulations take effect. Hapag-Lloyd’s SAJIR is one of 17 vessels in carrier’s fleet that have been designed for easy conversion to LNG
 power. The SAJIR will be the largest containership converted to run on gas to date. It will however be eclipsed by CMA CGM’s nine 23,000 TEU LNG-powered
 newbuildings, scheduled for delivery in 2020 and 2021.

 CMA CGM puts the first scrubber-retrofitted mainline ULCS in service. The 16,020TEU CMA CGM JULES VERNE
 and CMA CGM ALEXANDER VON HUMBOLDT have become the largest containerships to be retrofitted with
 exhaust gas scrubbers. Both vessels completed their fist commercial voyages in Feb 2019, following conversions works
 at Yui Lian Dockyard, Chiwan, in Nov and Dec 2018, where the ships docked for periods of 35 and 39 days, respectively.
 The two CMA CGM ships are the first scrubber-retrofitted ULCS to enter commercial service and their newly-installed
 funnel structures are clearly visible over the engine rooms.

Source: Alphaliner, Dynaliners, carriers

                                                                                                            DHL Global Forwarding | OFR Market Update | Mar 2019          8
Carriers 2/2

     CARRIERS
    Ocean Network Express (ONE) has reported a net loss of -$179M in Q4, 2018 (fiscal Q3 for the Japanese financial year), bringing its total net loss to -$491M in
    the first 9 months since the company began operations in Apr 2018. ONE is projecting continued losses in Q1, 2019 (fiscal Q4) of -$104M, which would bring its
    full fiscal year results to a consolidated net loss of -$594M. The inauspicious start for ONE’s first year of operations was blamed on higher than expected bunker
    costs, as well as teething problems that affected ONE’s liftings during the initial months of its launch. Although bunker costs is projected to drop in Q1 2019 based
    on ONEs projections, it will not be enough for the company to achieve positive results. However ONE said that it remains confident of achieving 75% of its initial
    forecast of synergy cost savings of $1,050Bn in the first full year of integration, with full benefits expected in its 2020-21 fiscal year.
    HMM has issued preliminary financial results in 2018 on 12 Feb 2019, with the company reporting a consolidated net loss of –KRW808Bn ($720M) for the full
    financial year. The negative results follow a net loss of –KRW1,190Bn ($1,060M) recorded in 2017. Despite the dismal performance, HMM remains upbeat on its
    expansion plans as it prepares to upgrade several of its existing services in 2019 ahead of the planned delivery of 12 newbuildings of 23,000 TEU in 2020 and a
    further 8 new ships of 15,000 TEU in 2021.
    COSCO Shipping Holdings has completed the private issuance of new ‘A’ shares in China on 24 January to raise RMB 7.72 Bn ($1.15 Bn) in gross proceeds
    that will be used to pay for 20 of its container newbuilding orders. Half of the shares issued was subscribed by COSCO Shipping, which raised the stake held
    by the COSCO Group from 45.5% to 46.2%. The fund raising took over a year to be completed after it was first announced on 30 Oct 2017 due to poor shipping
    market performance and weak stock market conditions.
    OOCL reported improved liftings and higher average freight rates in its Q4, 2018 operational update. It is its first full quarter of operations following the
    completion of its acquisition by COSCO Shipping and associated interests in Aug 2018. Total liftings reached a record of 1.715 MTEU in Q4 2018, 6.4% more than
    Q4 2017 and 0.3% higher than Q3, 2018.

Source: Alphaliner, Dynaliners, carriers

                                                                                                            DHL Global Forwarding | OFR Market Update | Mar 2019            9
PUBLIC
Regulations
REGULATIONS
European Union: New Phytosanitary Requirements for Import Wooden Packaging from China and Belarus
Effective 01 October 2018, all consignments from Belarus and China that are listed in the Annex of the enclosed European Union Implementing Decision will be
submitted to compulsory documentary controls.
As soon as the port authorities or other authorities responsible for the control of movement of goods are aware of the imminent arrival of specified commodities in
a wooden packaging are required to give advance notice to the customs office of the point of entry and to the responsible official body of the point of entry.
Link for attachment located below:
https://eur-lex.europa.eu/legal-content/EN/TXT/?uri=CELEX%3A32018D1137
Morocco: New Customs Requirement
Starting 01 March 2019, it is mandatory for all Ocean Import Cargo to Moroccan ports to show the number of Common Company Identifier (Identifiant Commun de
l’Entreprise or ICE) on the consignee and notify party of both HBL and MBL.
If Shipper cannot provide the “ICE”, DHL Morocco can support accordingly.
Below is the link of the announcement:
https://www.ecoactu.ma/douane-lidentifiant-commun-de-lentreprise-obligatoire-a-partir-du-1er-mars-2019/
Source: DHL
DHL Global Forwarding | OFR Market Update | Mar 2019 10Did you know?
Independent short-sea operators losing market share to main line carriers
North European short sea
The Main Line Operators’ (MLO) share of the Northern European short sea and feeder capacity has North Europe shortsea/feeder capacity deployed 2009 vs 2019
increased from 34% to 56% over the last decade. The four largest European MLOs (MSC, Maersk,
CMA CGM and Hapag-Lloyd) are the dominant players in this area, with all of them growing their
short sea coverage over the last ten years. COSCO has also been growing its presence in North
Europe in recent years, aided by the inclusion of OOCL’s long standing activities in the market. In
contrast, the independent short sea carriers and common feeder operators in Northern Europe
face an uncertain future, as they continue to lose market share to MLOs. The market share of
these carriers dipped from 66% to 44% and the total capacity operated has fallen from 164,000 TEU
in 2009 to 117,000 TEU currently. Some of the existing independent carriers have shrunk their
operations and other established players have either ceased operations or were absorbed by other
carriers. Team Lines’ recent announcement to shut down on 11 Feb 2019 marked another departure
of an established North European short sea operator.
Intra-Far East short sea
Independent short-sea and feeder operators on the intra Far-East routes are also losing market Intra Far East shortsea/feeder capacity deployed 2009 vs 2019*
share to MLOs. The total capacity operated on intra-Far East liner services, excluding cabotage
trades, has more than doubled over the last decade from 890,000 TEU at the beginning of 2009 to
1,900,000 TEU as at Jan 2019. Over the same period, the capacity share of MOLs on this route has
increased from 50% to 56%. Although the capacity share of the independent short sea and feeder
operators in the intra-Far East trade has shrunk, these carriers have still managed to grow their
total capacity operated by 86% over the last 10 years, with the five largest independent short sea
operators (Wan Hai, SITC, KMTC Sinokor and TS Lines) all managing to more than double their size
on this trade. The independent intra-Far East carriers have remained remarkably resilient in the face
of the challenge from MLOs, with attrition limited to only a handful of smaller carriers.
Source: Alphaliner, Dynaliners, carriers
*excl capacity operated on domestic/cabotage routes)
DHL Global Forwarding | OFR Market Update | Mar 2019 11PUBLIC
BACK-UP
12PUBLIC
Market Outlook March 2019 – Ocean Freight Rates Additional Trades (1/2)
OCEAN FREIGHT RATES OUTLOOK
EURO – AMLA Capacity unchanged, space is available, rates are expected to remain stable in March
EURO – MENAT ME region shows same trend as ASPA; low space but stable rates
EURO – SSA Rates remain stable and space is available. Congestion / PSS surcharge for PODs in Nigeria from all carriers still in force
Rates in the market are generally stable. Only few carriers announced minimal GRIs to Middle East. Space can still be an issue from US Gulf
AMNO – MENAT
Coast. Space situation from USEC is manageable and it’s mostly possible to get space for next/following week sailings.
Despite the GRI announcements for Feb, rates to South Africa and West Africa are expected to remain unchanged until end of 1st Q 2019.
AMNO – SSA Except the Congestion Surcharges to Nigeria. No changes in capacity. Space is available (Direct Service is currently shared by
Maersk/Safmarine/MSC/HSUD).
Space situation as well as fuel and rates are stable. Market Jan-Feb was soft on US southbound outbound and the trend is expected to
AMNO – AMLA
continue for Mar 2019.
Roll over and space constraints affecting entire region. MX/BR/SAWC region facing port omissions/blank sailings/congestion. Shippers are
strongly urged to provide forecasts 4-6 weeks out.
AMLA Exports Lack of trucking capacity in Mexico interrupting supply chain/extensive delays in cargo movement.
GRI’s and Emergency Fuel surcharges announced daily on all trades.
F/Time/Drop off conditions coming with a cost.
AMNO – ASPA Market is stable in terms of rates. No GRIs announced for Q1 2019. Pre-booking is strongly advised.
Source: DGF
DHL Global Forwarding | OFR Market Update | Mar 2019 13PUBLIC
Market Outlook March 2019 – Ocean Freight Rates Additional Trades (2/2)
OCEAN FREIGHT RATES OUTLOOK
EURO MED - AMNO Unchanged / stable. Nothing to be highlighted
EURO MED – AMLA Unchanged / stable. Nothing to be highlighted
EURO MED – ASPA Unchanged / stable. Nothing to be highlighted
EURO MED – MENAT Unchanged / stable. Nothing to be highlighted
EURO MED – SSA Unchanged / stable. Nothing to be highlighted
With upcoming new SEA-Australia service, rates are expected to reduce substantially in this market.
ASPA-SPAC
In all other regions, with Capacity unchanged and New year rush subsiding, it is expected that rates will soften in Mar 2019.
Source: DGF
DHL Global Forwarding | OFR Market Update | Mar 2019 14PUBLIC
Market Outlook – Volume Outlook in Main Trade Lanes, 2018 Estimate &
2019/22 Growth Forecast in %
2018e, in mTEU 2019e-2022e CAGR, in %
N O R T H N O R T H
A M E R I C A A M E R I C A
I n c l . 4.0 mTEU +2.4% 8.5 mTEU +4.7% I n c l .
M E X I C O F A R E A S T M E X I C O
2.2 mTEU +3.1% 12.8 mTEU +2.4% 18.7 mTEU +3.1%
2.0 mTEU 1.6 mTEU
+4.5% +4.3% 1.6 mTEU +4.3% E U R O P E 7.3 mTEU +3.4% 1.7 mTEU +2.2%
L A T I N L A T I N
I n c l . M E D
A M E R I C A 1.7 mTEU +2.5% 4.2 mTEU +4.6% A M E R I C A
INTRA ASIA
excl. Oceania
41.6 mTEU +4.8%
GLOBAL CONTAINER TRADE 2018e 152.6 mTEU +4.1% CAGR 2019e-2022e
Mid-term growth is mainly driven by Asian tradelanes.
Source: Seabury Nov18 update
DHL Global Forwarding | OFR Market Update | Mar 2019 15PUBLIC
Carrier Mergers, Acquisitions and Alliances
M E R G E R S A N D A Q U I S I T I O N S
United Hyundai
China CMA Hapag Hamburg Maersk Yang
Cosco OOCL Evergreen APL Arab Merchant MSC K Line MOL NYK
Shipping CGM Lloyd Süd Line Ming
Shipping Marine
HYUNDAI
CHINA COSCO SHIPPING EVER CMA CGM MAERSK LINE OCEAN NETWORK YANG
HAPAG-LLOYD MERCHANT MSC
OOCL GREEN APL MARINE Hamburg Süd EXPRESS (ONE) MING
A L L I A N C E S
F O R M E R A L L I A N C E S P R E S E N T A L L I A N C E S
MAERSK LINE OOCL
CMA CGM
MSC
MAERSK LINE CHINA SHIPPING OCEAN CMA CGM
2M OCEAN 3 2M HMM (strategic
MSC UNITED ARAB
cooperation until Apr
ALLIANCE CHINA COSCO SHIPPING
SHIPPING COMPANY EVERGREEN
2020)
HAPAG-LLOYD HYUNDAI COSCO
HAPAG-LLOYD
MOL MERCHANT EVERGREEN K-LINE
G6 MARINE CKYHE THE ALLIANCE ONE
NYK HANJIN YANG MING
OOCL YANG MING
APL SHPPING
*Source: Carriers
DHL Global Forwarding | OFR Market Update | Mar 2019 16PUBLIC
Acronyms and Explanations
2M - Carrier Alliance: Maersk / MSC Ocean 3 - Carrier Alliance: CMA, UASC, China Shipping
AMLA - Latin America OCRS - Operational Cost Recovery surcharge
AMNO - North America OOCL - Orient Overseas Container Line
AR - Argentina OWS - Overweight Surcharge
ASPA - AsiaPacific PH - Philippines
BR - Brazil PNW - Pacific North West
CAGR - Compound Annual Growth Rate Ppt. - Percentage points
CENAC - Central Amercia and Caribbean PSW - Pacific South West
CKYHE - Carrier Alliance: Cosco, K-Line, YangMing, Hanjin and Evergreen RR(I) - Rate Restoration
CNC - CNC Line (Cheng Lie Navigation Co. Ltd.) SAEC - South America East Coast
DG - Dangerous Goods SAWC - South America West Coast
DWT - Dead Weight Tonnage SOLAS - Safety of Life at Sea
EB - Eastbound SPRC - South People’s Republic of China – South China
ECSA - East Coast South America SSA - Sub-Saharan Africa
EGLV - Evergreen Marine Corp SSL - Steam Ship Line
EURO - Europe T - Thousands
FMC - US Federal Marine Commission TEU - Twenty foot equivalent unit (20‘ container)
G6 - Carrier Alliance: APL, Hapag Lloyd, Hyundai, MOL, NYK and OOCL TP - Trans Pacific
GRI - General Rate Increase TSA - Trans Pacific Stabilization Agreement
HJS - Hanjin Shipping ULCS - Ultra Large Container Ship
HMM - Hyundai USGC - US Gulf Coast
HL - Hapag -Lloyd US FMC - US Federal Maritime Commission
HSUD - Hamburg Süd USEC - US East Coast
HWS - Heavy Weight Surcharge USWC - US West Coast
IA - Intra Asia VGM - Verified Gross Mass
IPBC - India Pakistan Bangladesh Colombo VLCS - Very Large Container Ship
IPI - Inland Point Intermodal VSA - Vessel Sharing Agreement
ISC - Indian Sub Continent WB - Westbound
MENAT - Middle East and North Africa WCSA - West Coast South America
ML - Maersk Line WHL - Wan Hai
mn - Millions YML - Yang Ming Line
MoM - Month-on-Month YoY - Year-on-Year
NOO - Non-operating (vessel) owners YTD - Year-to-Date
DHL Global Forwarding | OFR Market Update | Mar 2019 17You can also read