Market Intelligence Report for Wine - Agri Exchange
←
→
Page content transcription
If your browser does not render page correctly, please read the page content below
Market Intelligence
Report for Wine
WINE is an un-distilled alcoholic beverage with an alcoholic content ranging between 5-
13%. Grape has been the principal fruit employed in the preparation of a variety of wines.
Nevertheless, other fruits have also been made into wine such as apple, known for cider,
pear for perry, plum for table and fortified wines.
Wine is perhaps the oldest fermented product known to mankind, with its origin dating
back to somewhere around 6000 BC in Georgia. Since the early 2000’s, India has been
hyped as an important emerging market for wine. The country has the optimum climate
for grape cultivation and its main wine-producing states, Maharashtra and Karnataka, are
leading producers of world class high quality grapes (Grace, 2015). The fruits used in wine
making are fermented using yeast and aged in the A Brief Overview of Indian Wines and
Wineries wood barrels to improve the taste and quality. A typical wine contains ethyl
alcohol, sugar, acids, higher alcohols, tannins, aldehydes esters, amino acids, minerals,
vitamins, anthocyanins and flavoring compounds (Joshi and Kumar, 2011).
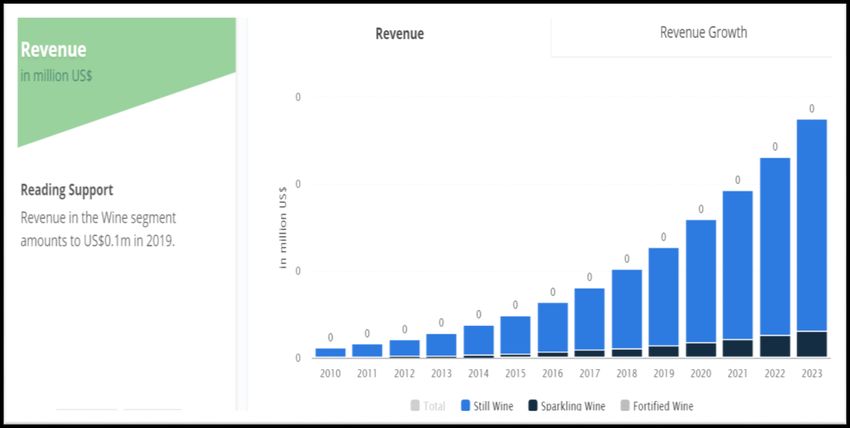
The worldwide Wine market has grown at above-average rates within the Alcoholic
Drinks market and is expected to reach more than US$439 billion in terms of revenue by
2023. Compared to the Beer and Spirits industries, the Wine industry is much more
fragmented with the biggest players, E&J Gallo, Constellation Brands, The Wine Group and
Treasury Wine Estates, together accounting for less than 10% of the total market.
Production                                       Wineries of all sizes increasingly look to
                                                 wine tourism as a new source of income
In 2019, Indian wine production is               through the set-up of inhouse restaurants,
forecasted to rise to 17.6 million liters        lodging, wine tastings and vineyard tours.
(1.96 million cases at 12 bottles per case
of 750 milliliters each) on area of              Production Regions:
approximately 6,000 acres (2,428
hectares). This represents a five percent         Wine production in India is concentrated
increase in production over 2018 which           in the states of Maharashtra (90 percent)
also experienced a good harvest.                 and Karnataka (7 percent), while the states
Although wine production in the country          Goa and Himachal Pradesh represent less
is booming, Indian output represents less        than 3 percent of output combined. Most
than a percent of global wine production.        wineries and production are concentrated
Area is expected to expand in 2019 as one        in the Nashik region in Maharashtra, which
of the larger wine producers plans to            is considered the home of the country’s
plant 355 hectares of vineyards in               wine sector. Other significant wine regions
response to greater domestic wine                include Sangli (Maharashtra), Nandi Hills
demand.                                          (Karnataka) and Bangalore (Karnataka). The
                                                 country’s diverse mix of climates allow it to
Smaller wineries and farmers are
                                                 grow an array of grape varieties for wine
supplying wine and grapes to larger              including indigenous varieties such as
wineries through long-term contracts (5-         Anabeshahi, Arkavati and Arkashyam in
10 years) as it assures them payment at          addition to imported varieties such as
the end of every season in contrast to           Syrah, Cabernet Sauvignon, Merlot,
other horticultural crops. The sector has        Chardonnay, Sauvignon Blanc, Zinfandel,
witnessed significant consolidation in last      Shiraz, Chenin Blanc, and Clairette Blanche.
few years where several larger wineries
                                                 The Nasik region has a shorter ripening
have acquired small ones in other states
                                                 season due to the hilly terrain and colder
to overcome the differential taxation            climate, which keeps alcohol levels lower
policy among states. Small wineries are          and results in easier growing conditions for
also choosing to supply grapes to the            white varietals. The average grape yields
more commercially viable wineries that           can range from 3-4 tons per acre for red
can support marketing and branding of            varietals, and 4-5 tons per acre for white
their products. The growth potential of          varietals.
smaller wineries is constrained by limited
capital availability, tight liquidity, and the
lack of national distribution.
Harvest usually is done during the winter months and usually starts from December and
continues until to March. Post-harvest, the wineries use the pre-monsoon (Apr-June)
period for early pruning, while monsoon (June-September) period typically involves
pruning, canopy management and mulching. The state of Karnataka is the second largest
producer of wine grapes in India. The state has recognized four regional appellations in the
state namely Nandi Valley, Krishna Valley, Cauvery Valley and Hampi Hills. The harvest is
usually occurs from March to May in Southern Karnataka, and February-March in Northern
Karnataka. To promote wine cultivation in the state of Karnataka, the state government had
announced a Karnataka grape processing and wine policy in 2007, which included the
creation of the Karnataka Wine Board (KWB), the only wine board in the country to date.
According to KWB, there are currently 17 wineries in the state with wine production of
approximately 9 million liters.

Government Support:

Production is expected to continue to grow in the coming years and as such the state
governments of Maharashtra and Karnataka have taken steps to support the wine industry
through various supports. These supports include the reduction or elimination excise taxes
on wines produced in state, easing distribution restrictions, and providing fiscal incentives
to establish wineries and vineyards. These states have also imposed stiff excise taxes on
imported wines and wines from other states. In the case of Maharashtra, the state
government has eased licensing requirements and regulations for establishing wineries
and wine retail outlets. In addition, the state government established wine industrial parks
to facilitate investment in the industry.
Wineries in Maharashtra that produce
and sell wines made from grapes grown
in the state have been exempted from
paying excise duty since 2001, however
the exemption is set to expire in
December 2021. The local industry is
hopeful that an extension will be granted
to support the industry. Wineries in
Maharashtra currently pay twenty percent
value added tax (VAT) to the state
government, out of which almost 16                The harvest is usually occurs from March to May in
                                                  Southern Karnataka, and February-March in Northern
percent is refunded.
                                                   Karnataka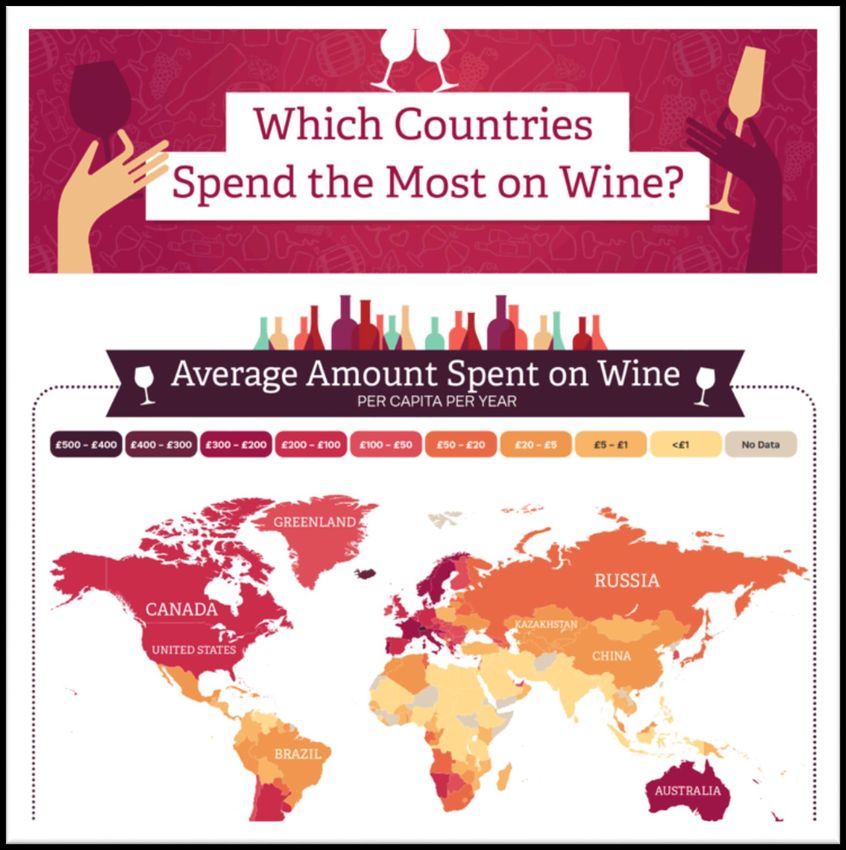
Similar to incentives provided by the state of Maharashtra, the state of Karnataka provides
a grape subsidy of Rs. 50,000 per hectare for new plantations. The Karnataka Wine Board
also separately conducts various market promotion activities including wine festivals,
appreciation/tasting courses in smaller towns in the state. KWB has also initiated a
certification course recognized by the Government of Karnataka.

Consumption

Based on trade sources and available sales data, national wine consumption is over 30
million liters per year. Historically, alcoholic beverages such as whisky, rum and beer
dominated alcohol consumption in India, however, the rise in disposable incomes, rapid
urbanization, access to reasonably priced domestic wines, the perceived health benefits of
consuming low alcohol beverages and changing consumer attitudes have led to a significant
increase in wine consumption. Local sources indicate that the Indian wine sector has
become the fastest growing alcoholic beverage category in the past decade, thanks in
particular to the rise of upper-middle class urban consumers.
                                                            An estimated 485 million
                                                            consumers are above the
                                                            drinking age (over a third of
                                                            the        country’s       total
                                                            population). According to
                                                            Wine Intelligence, most of
                                                            India’s wine consumption
                                                            takes place in urban centers,
                                                            including Mumbai (32%),
                                                            Delhi (25%) Bangalore (20%),
                                                            Pune (5%) and Hyderabad
                                                            (3%). At present, consumers
                                                            have a strong preference for
                                                            red wines followed by
                                                            fortified, white and sparkling
                                                            wines. Despite the sector’s
                                                            accelerated growth over the
                                                            past     few     years,    wine
                                                            penetration is low with an
estimated 2-3 million consumers consuming 24 million liters. Domestic wines dominate
the Indian wine market due their lower price and higher availability. Imported wines face
an import tariff of 150 percent which severely limits the availability of foreign wines in the
market. As such, international wines are viewed as more expensive and superior to
domestic wine but are limited to select occasions or gifting.

Local sources indicate that the Indian wine sector has become the fastest growing alcoholic
beverage category in the past decade, thanks in particular to the rise of upper-middle class
urban consumers. An estimated 485 million consumers are above the drinking age (over a
third of the country’s total population). According to Wine Intelligence, most of India’s
wine consumption takes place in urban centers, including Mumbai (32%), Delhi (25%),
Bangalore (20%), Pune (5%) and Hyderabad (3%). At present, consumers have a strong
preference for red wines followed by fortified, white and sparkling wines. Despite the
sector’s accelerated growth over the past few years, wine penetration is low with an
estimated 2-3 million consumers consuming 24 million liters. Domestic wines dominate
the Indian wine market due their lower price and higher availability. Imported wines face
an import tariff of 150 percent which severely limits the availability of foreign wines in the
market. As such, international wines are viewed as more expensive and superior to
domestic wine but are limited to select occasions or gifting.

Price remains the primary driver of wine choice for consumers followed by brand familiarity
and country of origin. Although consumers are price sensitive, they are willing to spend
more on wine, especially for professional and family events to impress guests. Growth in
consumption is driven by the wine’s fastest growing consumer segment young adults (20-
35).
Recognizing this opportunity, the sector is     Although      mid-income      groups     are
widening its range of products to meet the      increasingly     developing      a     more
varied tastes and needs of this                 sophisticated taste for wine, they would
demographic. Young adults are driving           rather opt for a domestically produced
demand for alcoholic drinks as socializing      wine than an international brand due to a
over drinks is becoming the norm. Wine          lack of knowledge about wine in general.
consumption is also being driven by             Access to reasonably priced quality wines
perceived health benefits including the         (around USD $10-$15) is considered by
reduction of the risk of heart disease and      some to be the key to speeding the
stroke, managing cholesterol levels,            development of India’s wine sector. Some
promoting longevity, and boosting the           wineries, instead of producing dry
immune system.                                  European-style wines that sell for eight to
                                                ten dollars per bottle, are working to
Although wine consumption in India has          produce sweeter wines that sell for two to
traditionally been skewed towards women,        three dollars per bottle with higher alcohol
the growing urban population and the            content, screw tops, smaller bottles and
increasing availability of wine has made it a   convenient packaging. The intent is to
drink that is appreciated by everyone. In       better meet the expectations of the Indian
addition, wine has been traditionally           palate and broaden the appeal of wine to
associated with class and education, but        more moderate-income consumers. Due to
younger consumers have come to                  the increasing availability and affordability
appreciate      wine       without    those     of wine, lower-middle-income households
associations. In the past, women were           are becoming more familiar with the
often reluctant to drink in public due to       product and increasing their purchases.
apprehensions regarding etiquette. But          Better access to affordable imported wines
now, full tasting sessions with friends and     will also help increase consumer demand
family are increasingly organized by this       for both imported and domestic wines as
consumer group. Moreover, status-               well.
conscious consumers are increasingly
viewing wines as a viable gifting option for
birthdays, anniversaries, and the holiday
season. Economy wines (around USD $7-
$10) are preferred by most consumers,
with these being generally produced
domestically and thus more widely
available.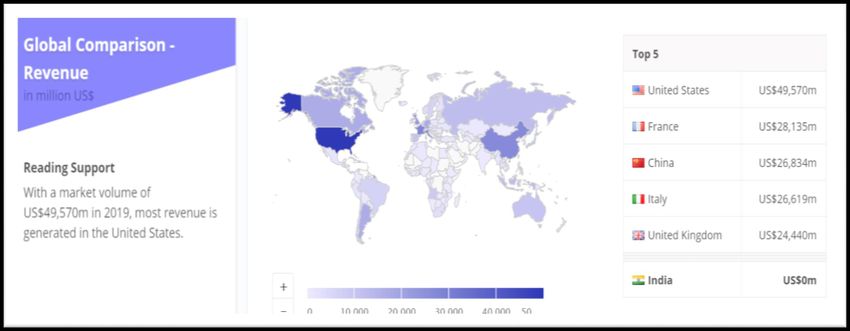
Increasing consumer knowledge will be a key     Australia, 9.9 for the US, and just 3.5 for
task of the sector moving forward in order to   China. Europe remains the world’s
ensure demand continues to increase,            consumption center, at 58% of volume
specifically towards higher quality and         and 50% of total value. The largest
premium wines (over USD $20). In recent         aggregate wine markets are the USA,
years, there has been increased public and      China, and France, due to their larger
political attention directed at alcoholic       populations, while the biggest importers
beverages, as well as at the food and soft      of wine are Germany, the USA, and the
drinks industries, because of concerns          United Kingdom, where production is
related to the health effects of alcohol        much lower than consumption.
consumption and overconsumption of foods
and drinks containing high levels of sugar.
Certain local governments have proposed or
adopted taxes on sugary foods and
beverages      to    influence    consumers
purchasing behaviors. These polices may be
adversely affecting their sale and
consumption of those products. The most
established wine markets are in Europe:
Portugal, Italy, and France have the highest
per capita consumption at over 35 liters per
person per year, compared with 23.9 for

Macro wine trends have been stable albeit lackluster, as can be seen in the chart below
where consumption has appeared to plateau. Looking forward, however, growth is
expected to pick up. By 2022, volume sold is expected to rise to 281 million cases, worth
$32.9 billion, for a CAGR of approximately 3%.

Within these subdued wine statistics, there are interesting regional and segmental
dynamics, affected by wider economic trends of increasing population growth and
increases in disposable income, particularly in Asia. As referenced above, cultures change
slowly, but they do change. And sub-categories within the wine industry—such
as rosé and organic wines—have been demonstrating fantastic growth, while other
segments have lagged behind.

While volume and value advances in Europe are moderate, the US continues to inch
forward as the world’s most valuable wine market, worth $34.8 billion in 2017. France is the
second most valuable market at $16.7 billion, followed closely by China at $16.5 billion. As
with many other products, China is expected to increase its consumption of wine going
forward and overtake France.
US-Biggest Importer in the World                   and allowed domestic brands to
                                                   efficiently add foreign wines to their
Imports account for about a quarter to a           portfolios.
third of US wine sales, a proportion that
been relatively steady for the last few years      A Fragmented Market
but is higher now than it was 25 years ago.
Recent Nielsen data, for example, indicate         The intensity of import competition
that imports of still wine accounted for           depends on which market segment you are
about 26% of sales in the channels they            looking at. The U.S. wine market is
measure when calculated by value and 24%           incredibly fragmented and so it is
by volume. Imports take a larger proportion        dangerous to generalize. This is true in
of sales in sparkling wines and in channels        many ways including simple geography.
that the Nielsen figures do not measure,
such as on-trade sales.                            They tell part of the story of 2018 imports
Is this a lot (or too much, as my winegrower       in the U.S. market. Looking at bottled wine
friends would have it)? It depends on how          imports, for example, you can see that
you look at it. OIV data tell us that the United   import penetration is dominated by three
States accounted for about 8.5% of world           countries. Globally the top three wine
wine production volume in 2018, so a two-          producing nations — France, Italy, and
thirds domestic market share is a very             Spain — account for more than half of all
substantial “home court” advantage that            wine production, so you would expect that
domestic producers naturally want to               to be true in terms of U.S. wine imports.
defend.                                            But it is not, in part because Spain punches
The slowly rising import market share has          below its weight here.
many causes. The US is the world’s most
                                                         US Wine Countrywise Import
attractive wine market, so foreign                                 Share
producers put a great deal of effort into
cracking the market. Technology is also a                            15%
factor. The advent of efficient bulk wine
                                                            6%                       34%
shipping       has     facilitated     increased
competitiveness of foreign wine producers                 6%

                                                           7%

                                                                              32%

                                                         France            Italy    New Zealand
                                                         Australia         Spain    Others
Analysis of US Wine Import United Kingdom – 2nd biggest importer in the world
Market
The UK wine market is fiercely competitive and mostly
France and Italy are the price-focused. Most opportunities for UK wine are to be
major wine exporting found with importers who service the high-end
countries to U.S. accounting independent stores and the less price-conscious
for 33.5% and 32.1% of the foodservice sector. Consumers are now more aware of
share of imports to U.S. wine varietals and (for the major varietals) know their
followed by New Zealand , preference.
Australia and Spain together The majority of UK wine sales (over 80 percent) are
accounting for about 18% of through retail outlets. The remaining sales take place
the share of imports to U.S. in bars, restaurants, hotels and other foodservice
Imports account for about a venues. White wine is favored slightly over red wine
quarter to a third of US wine consumption. Sparkling wine is the category exhibiting
sales, a proportion that been the most growth, mainly from Italian Prosecco and
relatively steady for the last Spanish Cava that are perceived to be better value for
few years but is higher now money than Champagne. Fruit flavored wine and lower
than it was 25 years ago alcohol wine are new style products with growth
U.S. charges zero import potential. In general terms, the upturn in the UK
duties on wine from Australia economy will encourage consumers to drink wine more
while a tariff of 2.7% is frequently, particularly in foodservice channels.
imposed on the rest 4 of the Nevertheless, the performance expected in the wine
top 5 exporters market is set to be only marginally superior to that of
Also the average value per the last few years as the UK population is drinking less
unit of quantity for wine than it did in the past.
commercial transaction(CIF)
United Kingdom Countrywise Import Share
and the total landing cost(FLP)
is highest for France and
lowest for Australia 25%
31%
7%
8%
21%
8%
France Italy Australia Spain New Zealand OthersAnalysis of UK Wine Import Market
Germany Countrywise Import Share
France and Italy are the major wine
exporting countries to U.K. accounting for 14%
30.6% and 21.5% of the share of imports
to U.K. followed by Australia , Spain and 2%
4% 37%
New Zealand together accounting for
about 10% of the share of imports to UK
U.K. charges zero import duties on wine 16%
from France, Italy and Spain while a
tariff of 4.9% is imposed on the rest 2 of
the top 5 exporters
Also the average value per unit of 27%
quantity for commercial transaction(CIF) Italy France Spain South Africa United States Of America Others
and the total landing cost(FLP) is highest
for France and lowest for Australia.
Germany Analysis of Germany Wine Import Market
Germany is internationally well-known for Italy and France are the major wine
its industrial goods and less known for its exporting countries to Germany
agricultural or emotional products, such as accounting for 36.7% and 26.7% of the
wine, although it possesses a longstanding share of imports to Germany followed
wine culture. by Spain, South Africa and United States
Two thirds of Germany’s imported wine is Of America together accounting for
delivered as bulk wine [248,251], serving about 23% of the share of imports to
the production of sparkling wine or for Germany.
being processed, often for exportation. Germany charges zero import duties on
With regard to country of origin, three wine from France, Italy and Spain
main countries, Italy, France, and Spain, which are E.U. countries and while a
constantly battle for leadership, with Italy tariff of 3.8% is imposed on wine from
having a strong lead. South Africa and 2.7% on that from
U.S.
Also the average value per unit of
quantity for commercial transaction(CIF)
and the total landing cost(FLP) is
highest for Italy and lowest for South
Africa.China’s Emergence as a Wine Consumer On the other side of the spectrum, it
should also be pointed out that brand
Despite China’s slowing economy, the name wines are supremely popular in
country is expected to increase its wine China.
imports by 8% in 2019. The Vinexpo/IWSR Imports in China:
study predicts that China will surpass • France and Australia are the major
France by 2020 as the second most wine exporting countries to China
valuable market in the world, and by 2022, accounting for 37.4% and 27.3% of the
the value of the Chinese market is forecast share of imports to China followed by
to hit more than $19.5 billion. Chile, Spain and Italy together
All the while, China is increasing its own accounting for about 25% of the share of
domestic production. Mainland China’s imports to China
vineyard area more than doubled between • China charges zero import duties on
2006 and 2016, and China now has the wine from Australia and while a tariff of
second largest vineyard area in the world 14.7% is imposed on wine from all the
after Spain and ahead of France and Italy. other top 4 wine exporters to China
While most of that area is currently used for • Also the average value per unit of
table grapes, the production of wine is quantity for commercial
increasing rapidly. transaction(CIF)is highest for France and
lowest for Chile while the total landing
Due to the enormous amount of cost(FLP) is highest for France and
consumption, global wine producers lowest for Chile.
seeking acceptance into the Chinese market
China's Import Trade Share
are tweaking their winemaking styles to
meet local tastes (as referenced above) and 10%
adjusting their packaging designs to appeal 6%
to the local market. 38%
6%
Gold and red are thought to be
successful colors and many wine labels will 13%
include these colors. There are also other
creative marketing tactics that global
producers have attempted to get attention.
27%
France Australia Chile Spain Italy OthersCanada :
The value of the wine market in Canada was
forecast to reach approximately 10.85 billion
Canadian dollars by 2019, an increase in over
2.7 billion Canadian dollars since 2014. This
market value translates to an estimated market
volume of over 590 million liters in 2019. As of % Share
December 2018, there were 477 wineries
across Canada to support the growing market.
21%
Imports in Canada: 22%
6%
• France, Italy and U.S. are the major wine
exporting countries to Canada accounting for 9% 21%
21.9% ,20.9% and 20.7% of the share of 21%
imports to Canada respectively followed by
Australia and Spain together accounting for
about 15% of the share of imports to Canada
• Canada charges zero import duties on wine France Italy United States Of America Australia Spain Others
from all the top 5 exporters of wine to Canada
• Also the average value per unit of quantity
for commercial transaction(CIF) and the total
landing cost(FLP) is highest for France and
lowest for Australia.World’s Top 15 Wine Importing Countries :
Top 15 countries %share of World's Imports
Norway 1.2
Singapore 1.7
Denmark 2
Sweden 2.1
Russian Federation 2.8
Belgium 3
Switzerland 3.2
Country
Netherlands 3.6
Hong Kong, China 4
Japan 4.4
Canada 5.2
China 7.5
Germany 8.3
United Kingdom 11.5
United States of America 17
0 2 4 6 8 10 12 14 16 18
% share
Top 15 World’s Exporters with Indian Exports:
Value imported in
2018 (USD
thousand)
Countries India Exports (Value) Potential World Imports(Tons) India Exports (Tons) Potential % Share CIF Duty FLP
United States
of America 6449228 103 6449125 2773893 55.43 2773837.57 17 4478 1.90% 4563.082
United
Kingdom 4357678 260 4357418 1406120 263 1405857 11.5 2385 4.90% 2501.865
Germany 3144628 0 3144628 1469065 0 1469065 8.3 0 0.00% 0
China 2855247 0 2855247 683866 0 683866 7.5 0 0.00% 0
Canada 1995591 25 1995566 1016565 4.82 1016560.18 5.2 12500 0.00% 12500
Japan 1687727 316 1687411 642923 195 642728 4.4 3901 15.90% 4521.259
Hong Kong,
China 1538653 1691 1536962 51997 128 51869 4 31906 0.00% 31906
Netherlands 1367173 1939 1365234 409272 304 408968 3.6 15389 4.90% 16143.06
Switzerland 1214705 2 1214703 177657 2.41 177654.59 3.2 2000 17.40% 2348
Belgium 1153581 31 1153550 328525 34 328491 3 2214 4.90% 2322.486
Russian
Federation 1051133 0 1051133 587313 0 587313 2.8 0 0.00% 0
Sweden 783495 0 783495 153539 0 153539 2.1 0 0.00% 0
Denmark 752380 7 752373 254605 1 254604 2 7000 4.90% 7343
Singapore 658976 1152 657824 0 253 -253 1.7 10971 0.00% 10971
Norway 439832 0 439832 86538 0 86538 1.2 0 0.00% 0
Brazil 375641 0 375641 119662 0 119662 1 0 0.00% 0Potential of Countries with Zero Exports from India
Value
imported
World India
in 2018
India Impor Export
(USD
Exports ts(Ton s Poten %
thousand)
Countries (Value) Potential s) (Tons) tial Share CIF Duty FLP
Germany 3144628 0 3144628 1469065 0 1469065 8.3 0 0.00% 0
China 2855247 0 2855247 683866 0 683866 7.5 0 0.00% 0
Russian Federation 1051133 0 1051133 587313 0 587313 2.8 0 0.00% 0
Sweden 783495 0 783495 153539 0 153539 2.1 0 0.00% 0
Norway 439832 0 439832 86538 0 86538 1.2 0 0.00% 0
Germany:
Analysis of Germany :
• Out of the total 14.69L tons of Bottled
wine imported in Germany on yearly
Germany's Import Trade Share
basis, majorly Italy, France and Spain are
the exporters 14%
• Germany itself accounts for >8% of World’s
3%
Wine Exports which shows it being a 4% 37%
potential market for India to develop their
shares in this country
• There is also an incentive of 0% on import 16%
duty for the exporters
26%
Italy France Spain South Africa United States of America OthersChina's Import Trade Share
China: 10%
6%
Analysis of China: 6% 38%
• Out of the total 6.8L tons of Bottled wine
imported in China on yearly basis, majorly
France, Australia and Chile are the exporters 13%
• China itself accounts for >7% of World’s Wine
Exports which shows it being a potential
market for India to develop their shares in this
country 27%
• There is also an incentive of 0% on import
France Australia Chile Spain Italy Others
duty for the exportersSweden:
Sweden's Import Trade Share
Analysis of Sweden:
26% 28% France, Italy are the leading exporters of
wine to Sweden accounting for 28% ,24% of
the Sweden’s imported wine share
5%
respectively.
Spain, South Africa and Germany follow
6%
with their contributions of 11%,6% and 5%
11% 24% respectively.
While the rest countries contribute to 26%
France Italy Spain South Africa Germany Others share of Sweden’s importNorway's Import Trade Share Norway:
15% Analysis of Norway:
3% 32% France and Italy are major exporters of wine
to Norway accounting for 32% of share of
8% Norway’s import each.
These are followed by Spain, Germany and
10% the U.S. with contributions of 10%, 8% and
3% respectively in Norway’s import.
32% The other countries account for 3% of
Norway’s import.
France Italy Spain Germany United States of America OthersRussian Federation's Import
Russian Federation:
Trade Share
Analysis of Russian Federation:
18%
29% Italy and France are major exporters of wine
4% to Russian Federation accounting for 29%
and 18% of share of Norway’s import
respectively.
15%
These are followed by Georgia, Spain and
Chile with contributions of 16%, 15% and 4%
18% respectively in Russian Federation’s import.
16%
The other countries account for 18% of
Italy France Georgia Spain Chile Others Russian Federation’s import.The Indian wine industry is going through structural changes with mergers and acquisitions. This year, the grapes processed at Sula was 55% red variety and 45% white variety grapes. Most of the grapes are crushed and processed in Nashik and southern parts of Maharashtra, though some harvesting and crushing is also done in Karnataka for the wines to be made and sold in Karnataka by Sula Vineyards under its brand ‘Kadu’. While 2019 was positive for grape-growing conditions, the weather may be indicative of the impact of climate change. The harvest was slightly delayed this year, starting in mid- December and continuing into the first week of April. “Wine-making is such an old process, the challenges will always be the weather,” said Sula Vineyards founder Rajeev Samant. Sula is also cultivating additional land across Maharashtra and Karnataka. It planted 360 acres in 2018 and plans to plant an additional 340 in 2019. "This will take our total area under wine grape plantations to about 3000 acres. Today, almost 510 farmers from Maharashtra and Karnataka are working with Sula," company executives said. Maharashtra saw a bumper grape harvest this season, with production in Nashik district, the heart of India’s grape region, crossing 143,000 tonnes. About 2% of these grapes are wine grapes. However, except for 2017, when the highway liquor ban was put into force, the Indian wine industry has recorded a steady growth in CAGR.Just touching on these three growth categories within the global wine market reveals how diverse the wine industry is and how it reflects prevailing culture.
Other areas to watch out for are luxury brands, which continue to grow at a steady
rate alongside other luxury goods, and the varietal pinot noir continues its boom since
more than displacing merlot after the Sideways moment in 2004 (pinot noir plantings in
California have nearly doubled since the film was released, while merlot plantings have
decreased by 23%).
With so many great wines being made today and causing unprecedented competition, is it
a good time to enter the wine market? That depends on how much you like wine—one of
the industry’s charms is that it draws people in because of passion rather than profit.
Unfortunately, this also causes uneconomic actors to distort the market (such as Brangelina,
for example).
As the saying goes, the way to make a small fortune in the wine business is to start out with
a large fortune and open a winery. But there are interesting pockets of growth and it suits
those with a long-term vision: There will always be a demand for good quality wine. It has
been part of civilization for over 8,000 years and although society may not be using Uber or
even driving cars in twenty or thirty years, we will assuredly be drinking wine.
World's Top 20 Wine Importing Countries

United States of America   Country                    % Share                CIF             Duty     FLP
                           France                     33.5%                            12,4802.7%       12,817
                           Italy                      32.1%                             6,1132.7%         6,278
                           New Zealand                7.1%                              6,3022.7%         6,472
                           Australia                  6.0%                              2,3900.0%         2,390
                           Spain                      5.9%                              5,3452.7%         5,489
    United Kingdom         Country                    % Share                              CIFDuty    FLP
                           France                     30.6%                             7,7820.0%           7,782
                           Italy                      21.5%                             3,0820.0%           3,082
                           Australia                  7.7%                              1,4844.9%           1,557
                           Spain                      7.5%                              2,4150.0%           2,415
                           New Zealand                7.3%                              4,0054.9%           4,201
       Germany             Country                    % Share                              CIFDuty    FLP
                           Italy                      36.7%                             2,1810.0%           2,181
                           France                     26.7%                             3,9740.0%           3,974
                           Spain                      16.2%                             1,3790.0%           1,379
                           South Africa               3.8%                              1,2103.0%           1,246
                           United States Of America   2.7%                              2,4474.9%           2,567
         China             Country                    % Share                              CIFDuty    FLP
                           France                     37.4%                             5,95314.7%          6,828
                           Australia                  27.3%                             4,7550.0%           4,755
                           Chile                      13.2%                             2,25114.7%          2,582
                           Spain                      5.9%                              2,43414.7%          2,792
                           Italy                      5.9%                              4,67514.7%          5,362
        Canada             Country                    % Share                              CIFDuty    FLP
                           France                     21.9%                             7,0970.0%           7,097
                           Italy                      20.9%                             5,3950.0%           5,395
                           United States Of America   20.7%                             6,5630.0%           6,563
                           Australia                  9.4%                              2,5880.0%           2,588
                           Spain                      6.3%                              3,4730.0%           3,473
         Japan             Country                    % Share                              CIFDuty    FLP
                           France                     55.1%                            15,5080.0%       15,508
                           Chile                      12.0%                             2,4110.0%         2,411
                           Italy                      11.6%                             4,9300.0%         4,930
                           United States Of America   7.7%                              7,81916.7%          9,125
                           Spain                      5.9%                              3,1300.0%           3,130
   Hong Kong,China         Country                    % Share                               CIFDuty   FLP
                           France                     32.4%                             42,5530.0%      42,553
                           China                      22.8%                             75,2440.0%      75,244
                           United Kingdom             14.3%                           1,15,7530.0%    1,15,753
                           United States Of America   6.8%                             14,8930.0%       14,893
                           Australia                  6.1%                             10,3400.0%       10,340
      Netherlands          Country                    % Share                              CIFDuty    FLP
                           France                     28.8%                             3,9880.0%         3,988
                           Italy                      13.1%                             3,8290.0%         3,829
                           Germany                    12.0%                             2,4510.0%         2,451
                           Spain                      8.4%                              3,0670.0%         3,067
                           Chile                      8.2%                              2,9622.2%         3,027
      Switzerland          Country                    % Share                              CIFDuty    FLP
                           Italy                      36.1%                             6,08118.5%        7,206
                           France                     35.6%                            11,27418.5%      13,360
                           Spain                      12.2%                             5,81218.5%        6,887
                           Germany                    3.4%                              6,48518.5%        7,685
                           Portugal                   3.4%                              3,68418.5%        4,366
        Belgium            Country                    % Share                              CIFDuty    FLP
                           France                     54.7%                             4,3020.0%         4,302
                           Spain                      10.7%                             2,8490.0%         2,849
                           Italy                      8.9%                              3,9200.0%         3,920
                           Netherlands                4.7%                              3,7970.0%         3,797
                           Germany                    4.7%                              1,8170.0%         1,817
France Country % Share CIFDuty FLP
Spain 34.0% 798 0.0% 798
Italy 17.1% 2,3230.0% 2,323
Portugal 10.5% 3,2920.0% 3,292
United States Of America 8.8% 5,7124.9% 5,992
France 8.2% 9,008 9,008
Russian Federation Country % Share CIFDuty FLP
Italy 29.5% 2,250 12.5% 2,531
France 18.2% 3,12812.5% 3,519
Georgia 15.8% 1,7050.0% 1,705
Spain 14.7% 1,36912.5% 1,540
Chile 3.9% 1,76212.5% 1,982
Sweden Country % Share CIFDuty FLP
France 28.3% 9,228 0.0% 9,228
Italy 24.4% 9,2130.0% 9,213
Spain 10.6% 5,3560.0% 5,356
South Africa 5.6% 2,2283.0% 2,295
Germany 5.1% 3,7720.0% 3,772
Denmark Country % Share CIFDuty FLP
France 23.8% 4,254 0.0% 4,254
Italy 22.5% 3,1430.0% 3,143
Spain 8.9% 2,6990.0% 2,699
Germany 6.9% 3,1760.0% 3,176
Chile 6.3% 2,1812.2% 2,229
Singapore Country % Share CIFDuty FLP
France 72.1% 0.0% -
Australia 10.8% 0.0% -
Italy 3.9% 0.0% -
United States Of America 3.6% 0.0% -
New Zealand 2.4% 0.0% -
Australia Country % Share CIFDuty FLP
New Zealand 40.2% 4,359 0.0% 4,359
France 38.9% 12,0115.0% 12,612
Italy 11.8% 5,3335.0% 5,600
Spain 2.4% 4,4595.0% 4,682
Singapore 1.4% 15,6300.0% 15,630
Norway Country % Share CIFDuty FLP
France 32.0% 7,950 0.0% 7,950
Italy 31.7% 5,2200.0% 5,220
Spain 9.8% 4,3970.0% 4,397
Germany 8.1% 5,0820.0% 5,082
United States Of America 3.1% 2,6670.0% 2,667
Italy Country % Share CIFDuty FLP
France 61.4% 10,970 0.0% 10,970
Spain 26.1% 7030.0% 703
Portugal 1.8% 2,9710.0% 2,971
Germany 1.7% 3,3050.0% 3,305
South Africa 1.4% 5673.0% 584
Brazil Country % Share CIFDuty FLP
Chile 38.9% 2,840 0.0% 2,840
Argentina 14.7% 3,4710.0% 3,471
Portugal 14.3% 3,01525.1% 3,772
Italy 10.9% 3,31725.1% 4,150
France 9.4% 4,01425.1% 5,022
Poland Country % Share CIFDuty FLP
Italy 21.7% 3,450 0.0% 3,450
United States Of America 12.6% 3,2784.9% 3,439
Germany 12.1% 2,9730.0% 2,973
France 10.5% 3,3490.0% 3,349
Spain 6.7% 2,2920.0% 2,292You can also read