Combustion and gasification characteristics of low-temperature pyrolytic semi-coke prepared through atmosphere rich in CH4 and H2
←
→
Page content transcription
If your browser does not render page correctly, please read the page content below
Green Processing and Synthesis 2021; 10: 189–200
Research Article
Yuan She*, Chong Zou*, Shiwei Liu, Keng Wu, Hao Wu, Hongzhou Ma, and Ruimeng Shi
Combustion and gasification characteristics of
low-temperature pyrolytic semi-coke prepared
through atmosphere rich in CH4 and H2
https://doi.org/10.1515/gps-2021-0015 that the types of pore structure of semi-coke are mainly
received November 09, 2020; accepted January 24, 2021 micropore and mesopore, and the influence of pyrolytic
Abstract: Thermoanalysis was used in this research to atmosphere on micropores was not of strong regularity
produce a comparative study on the combustion and but could inhibit mesopore development. Aromatic lamellar
gasification characteristics of semi-coke prepared under stack height of semi-coke, specific surface area of mesopore,
pyrolytic atmospheres rich in CH4 and H2 at different and pore volume had a favorable linear correlation with
proportions. Distinctions of different semi-coke in terms semi-coke reactivity indexes.
of carbon chemical structure, functional groups, and Keywords: coal pyrolysis, semi-coke, blast furnace injec-
micropore structure were examined. The results indicated tion, reactivity, pore structure
that adding some reducing gases during pyrolysis could
inhibit semi-coke reactivity, the inhibitory effect of the
composite gas of H2 and CH4 was the most observable,
and the effect of H2 was higher than that of CH4; more- 1 Introduction
over, increasing the proportion of reducing gas increased
its inhibitory effect. X-ray diffractometer and Fourier- Low-temperature pyrolytic semi-coke is a solid product
transform infrared spectrometer results indicated that after removing a number of volatiles from low-rank coal
adding reducing gases in the atmosphere elevated the under low-temperature pyrolysis (500–600°C) and tar is
disordering degree of carbon microcrystalline structures, separated out [1,2]. Part of this product has been applied
boosted the removal of hydroxyl- and oxygen-containing to fields like coal gasification, ferroalloy smelting, and
functional groups, decreased the unsaturated side chains, calcium carbide production; however, there is still a large
and improved condensation degree of macromolecular quantity of semi-coke resources that require market con-
networks. The nitrogen adsorption experiment revealed sumption. In the field of iron-making, pulverized coal
injection (PCI) in blast furnace replaces expensive and
highly deficient metallurgical coke with relatively low-
priced coal to reduce the coke ratio in the blast furnace
* Corresponding author: Yuan She, School of Metallurgical and
during iron-making process, and thereby reduce pig iron
Ecological Engineering, University of Science and Technology
Beijing, 30 Xueyuan Road, Beijing 100083, China; School of
cost [3,4]. With the continuously increasing blast furnace
Metallurgical Engineering, Xi’an University of Architecture and injection ratio, iron and steel enterprises have an
Technology, 13 Yanta Road, Xi’an 710055, China, increasing demand for anthracite. Moreover, anthracite
e-mail: sheyuan1982@163.com reserves only occupy 10.9% of coal reserves in China with
* Corresponding author: Chong Zou, School of Metallurgical unceasingly prominent scarcity, which is then accompa-
Engineering, Xi’an University of Architecture and Technology,
nied by rising price. Therefore, under the background of
13 Yanta Road, Xi’an 710055, China, e-mail: zouchong985@163.com
Shiwei Liu: School of Metallurgical Engineering, Xi’an University of an increase in PCI ratio in blast furnace, seeking for new
Architecture and Technology, 13 Yanta Road, Xi’an 710055, China, low-cost and high-quality injecting fuels such as biochar
e-mail: liushiw2010@126.com [5] and waste plastics [6] has always been a research
Keng Wu: School of Metallurgical and Ecological Engineering, emphasis of metallurgists. Using low price semi-coke as
University of Science and Technology Beijing, 30 Xueyuan Road,
PCI fuel to replace expensive anthracite has been an
Beijing 100083, China
Hao Wu, Hongzhou Ma, Ruimeng Shi: School of Metallurgical
important research orientation for optimizing blast fur-
Engineering, Xi’an University of Architecture and Technology, nace fuel structures, and the reduced production cost has
13 Yanta Road, Xi’an 710055, China attracted attention from metallurgists [7–11]. Semi-coke
Open Access. © 2021 Yuan She et al., published by De Gruyter. This work is licensed under the Creative Commons Attribution 4.0
International License.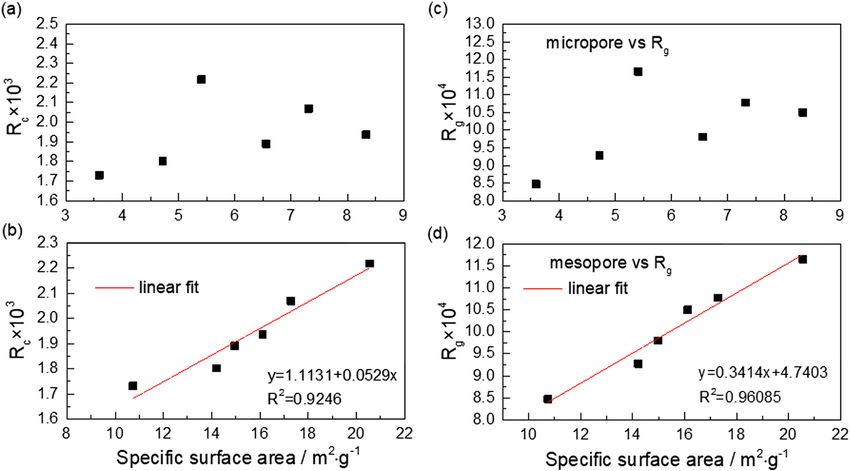
190 Yuan She et al.
is a potential excellent blast furnace fuel by virtue of char combustion and gasification are relatively slow
favorable transport performance, high calorific value, (20 ms vs 1–4 s), and the time needed for a complete
and no explosiveness [7,10]. However, compared with reaction of coal is primarily and jointly determined by
anthracite, the nature difference of semi-coke is consid- char combustion and gasification time [24]. Combustion
erable because of its instable quality; moreover, the fluc- and gasification properties are highly important for the
tuation of its combustion performance is remarkable and utilization ratio of fuels inside the furnace and the stable
hinders its application and promotion in blast furnace operation of the blast furnace because the combustion of
injection, because during semi-coke production, pyro- atmosphere inside the hearth is gradually variational. In
lysis conditions will influence the semi-coke composition the front of the tuyere, generated coal gas components
and structure and cause changes in its reactivity. Even if are different because of different combustion conditions
the same coal category is used as a pyrolytic raw mate- at different positions along the hearth radius in front of
rial, the reactivity of prepared semi-coke will be critically the tuyere. O2 is sufficient in front of the tuyere and reacts
different, and high pyrolysis degree is adverse to follow- with fuel combustion to generate a large quantity of CO2,
up combustion of semi-coke [11,12]. Factors, such as O2 abruptly decreases and disappears, and CO2 rapidly
devolatilization behavior, pore structure, specific surface rises to its maximum value. Therefore, the injected fuel
area, and ordering degree of carbon lattice structure, will first experiences atmospheric combustion with sufficient
result in substantial loss of semi-coke reactivity [13–15]. O2 and then experiences gasification under the atmo-
Combustion reactivity in later phase of semi-coke under sphere with a continuously rising CO2. However, many
high temperature is closely related to semi-coke nature research on reactivity of PCI fuels only focuses on com-
before combustion [16]. bustion reactivity [3,25,26] and neglects the importance
The present industrialized pyrolytic processes gener- of gasification reactivity on the consumption of unburned
ally use internal heating-type gas-carrier pyrolysis reac- char; moreover, comparative studies on the two above-
tors. In such pyrolysis environments, the raw coal exists mentioned subject matter are lacking.
not in a pure N2 atmosphere but in mixed reducing gases In the present research, thermoanalysis was applied
such as CO, H2, and CH4. Moreover, pyrolysis atmosphere to comparatively study the combustion and gasification
contents are different to a certain degree at various posi- reactivity of semi-coke prepared under pyrolytic atmospheres
tions inside the furnace. The influences of pyrolysis con- containing different proportions of H2- and CH4-reducing
ditions, such as pyrolysis temperature, heating rate, gases. Moreover, the relationships between semi-coke com-
atmosphere pressure, and holding time, on semi-coke position/structure and combustion/gasification reactivity
composition, structure, and reactivity [17–19] have been were obtained by analyzing the carbon chemical structures
extensively studied; however, the effects of pyrolytic of different semi-coke, functional group analysis, and micro-
atmosphere on semi-coke reactivity remain controversial. pore structures to provide reference for further scientific
Colette et al. [20,21] studied the influence of the coke- and highly efficient application of semi-coke in PCI.
oven gas atmosphere on product distribution and semi-
coke characteristics in fixed beds and found that semi-coke
combustion characteristics were not eminently different
under H2 and inert atmospheres. Liao et al. [22] indicated
that the combustion reactivity of coal–coke-oven gas co-
2 Experimental procedure
pyrolytic semi-coke is related to pyrolysis pressure and
heating rate, and that low pyrolysis pressure and high 2.1 Experimental raw materials
heating rate contribute to semi-coke combustion reac-
tivity. Zhong et al. [23] found that hydrogen-free radicals Coal samples used in the experiment were typical low-
generated by H2 and CH4 could permeate semi-coke and rank coals from Sunjiacha coal mine in Shenmu region of
influence its oxidizing reactivity. Thus, the influence of Northern Shaanxi. Proximate analysis and element ana-
mixed atmospheres containing reducing gases on semi- lysis of coals are illustrated in Table 1. Vertical-type pyro-
coke nature and its reactivity requires further research. lyzing furnace was used to prepare semi-coke samples,
During iron-making technology in blast furnace, PCI and the pyrolysis system is shown in Figure 1. A total of
fuels experience processes, such as volatile extrusion and 250 g samples with granularity within 20–40 mm was
combustion and gasification of fixed carbon, within con- placed in a furnace and suspended on an electronic scale.
fined spaces in the tuyere and raceway region. Compared A total of six pyrolytic atmospheres (respectively being
with the process of release and combustion of volatiles, (1) pure N2; (2) 10% CH4 in N2; (3) 20% CH4 in N2; (4) 10%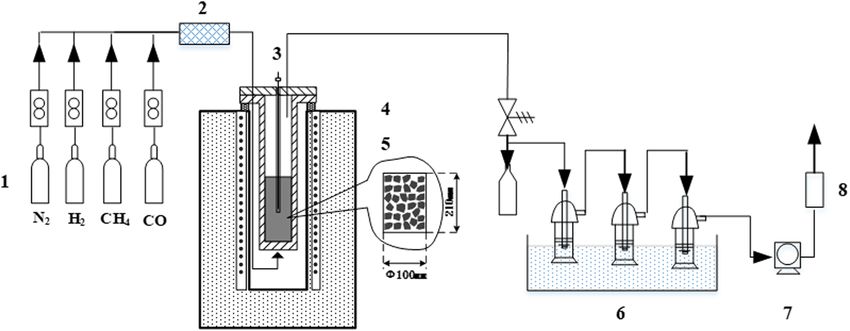
Combustion and gasification characteristics of pyrolytic semi-coke 191
Table 1: Proximate analysis and ultimate analysis of coal and chars
Samples Proximate analysis (wt%, ad) Ultimate analysis (wt%, ad)
Mad Aad Vdaf FC C H N O S
Coal 3.83 7.53 37.06 55.97 71.97 4.08 0.93 10.21 0.20
char1 1.17 9.15 8.21 81.47 82.8 2.42 0.61 1.17 0.23
char2 1.38 9.99 8.04 80.59 83.71 2.02 0.38 1.38 0.20
char3 1.44 8.23 8.01 82.32 83.09 1.87 0.28 1.44 0.21
char4 1.40 9.01 8.49 81.10 82.81 2.24 0.55 1.34 0.16
char5 1.32 8.99 7.40 82.29 83.45 2.01 0.62 1.26 0.19
char6 1.23 8.40 7.11 83.26 83.02 1.95 0.51 1.31 0.17
H2 in N2; (5) 20% H2 in N2; and (6) 10% H2, and 10% CH4 combustion reactivity index Rc and gasification reactivity
in N2) were pumped into the reaction jar at a 0.6 L/min index Rg were introduced [27,28]:
flow rate. Samples were heated to 600°C at a rate of 5°C/min Vrate
and heat was preserved for 30 min, then nitrogen was pumped Rc = , (1)
Tignition
in for cooling in room temperature. After pyrolysis, semi-coke
samples were extracted, labeled char1–char6, and preserved 0.5
Rg = , (2)
in a drying vessel for further property analysis. The detailed t0.5
properties of the samples are summarized in Table 1. where Vrate is the average reaction rate of semi-coke com-
bustion, Tignition is the ignition point of semi-coke com-
bustion determined through thermogravimetry-deriva-
2.2 Representation of semi-coke properties tive thermogravimetry (TG–DTG) method [29], and t0.5
is the time for carbon conversion rate α to reach 50%. α
Combustion and gasification reactivity of semi-coke with was determined using:
an experimental weight of 10 ± 0.1 mg was tested using
w0 − wi
STA449C thermal analyzer from German NESZCH αi = , (3)
w0 − wash
company. Under atmosphere of air (combustion)/CO2
(gasification) and a flow rate of 50 mL/min, the tempera- where w0 is the initial semi-coke mass, wi is the semi-coke
ture was elevated from room temperature to 1,000°C mass at any time, and wash is the ash content mass in the
(combustion)/1,400°C (gasification) at a rate of 15°C/min, semi-coke.
and weight change was synchronously recorded. For Carbon chemical constitution of semi-coke was mea-
the quantitative comparison of semi-coke reactivity, the sured through X-ray diffractometer (XRD) (X’Pert PROMPD)
Figure 1: Pyrolysis device diagram. (1) Gas cylinder; (2) gas blending instrument; (3) sample temperature thermocouple; (4) temperature
thermocouple inside furnace; (5) pyrolyzing furnace; (6) gas purification and tar collection; (7) pump; (8) gas analyzer.192 Yuan She et al.
(a) 100 (b) 100
80 80
TG / %
TG / %
60 60
char1
char1
char2
char2 40
40 char3
char3
char4
char4
20 20 char5
char5
char6
char6
0 0
0.0
0.0
-0.2
DTG / %oC-1
DTG / %oC-1
-0.4 -0.2
-0.6 -0.4
-0.8
-0.6
-1.0
-0.8
300 400 500 600 700 800 900 1000 1100 1200
o
Temperature / C Temperature / oC
Figure 2: TG–DTG curves of combustion and gasification processes of semi-coke samples prepared under different pyrolytic atmospheres.
(a) Air atmosphere; (b) CO2 atmosphere.
using Cu-Kα target at a scanning rate of 4°/min. Feature where C al/ C is the content of aliphatic carbon, H/C is the
sizes of the microcrystalline structure of the semi-coke are ratio of hydrogen/carbon numbers, which can be solved
represented by d002, La, and Lc and were solved according through elemental analysis, Hal/ H is the proportion occu-
to the Scherrer formula and Bragg equation [30]: pied by aliphatic hydrogen in total hydrogen, Hal/ Cal is
the carbon/hydrogen ratio in lipid groups and is taken as
λ
d002 = , (4) 1.8 for coal [31], and Hal is the aliphatic hydrogen, which
2 sin θ002
can be solved by dividing the integral area Aal inside the
0.89λ wave band by the extinction coefficient aal (aal is taken as
Lc = , (5)
β002 cos θ002 744 cm−1 for semi-coke), as shown in Eq. 8:
where d002 is the distance between the single aromatic Aal
Hal = . (8)
layers of the sample, Lc is the microcrystal stack height aal
perpendicular to the aromatic lamellas, θ002 is the glancing
Physicochemical absorber (US Micromeritics, ASAP
angle, β002 is the full width at half maximum of the diffrac-
2020M+C) and N2 adsorption method were used to test
tion peak, and λ is the wavelength at 0.15406 nm of the
the specific surface area and micropore structure of semi-
incident X-ray.
coke, with a degasification temperature during the test
Functional group of semi-coke was detected through
at 200°C.
Fourier-transform infrared spectrometer (FTIR) (German
Bruker, Vector 22). Semi-coke samples were prepared
using the KBr squashing technique, and test spectral range
was 400–4,000 cm−1 with a resolution ratio of 4 cm−1.
The sample spectra were obtained through scanning after 3 Results and discussion
deducting the blank KBr background. Aromaticity was
derived using the formulas by Brown and Ladller [31]: 3.1 Combustion/gasification reactivity
fa = 1 − C al/ C , (6)
TG–DTG curves of combustion and gasification of semi-
C al/ C = [(Hal/ H )⋅(H / C )]/(Hal/ Cal), (7)
coke samples prepared under different pyrolyticCombustion and gasification characteristics of pyrolytic semi-coke 193
atmospheres are shown in Figure 2, and semi-coke com- furthermore, the TG and DTG curves of char2–char6
bustion and gasification characteristic parameters are prepared after adding reducing gases experienced retro-
presented in Table 2. position, and the maximum reaction rate and reaction
As shown in Figure 2a, under air atmosphere, six finishing temperature escalated. The semi-coke gasifica-
semi-coke samples started losing weight under 368°C or tion reactivity indexes were arranged in descending
higher, which indicated that volatiles in semi-coke have order: char6 > char5 > char4 > char3 > char2 > char1.
started to decompose. Subsequently, weight loss rate The results indicated that the addition of reducing gases
increased, which suggested that the fixed carbon experi- in the pyrolysis phase of raw coal resulted in a clear
enced a rapid combustion reaction. Weight loss basically degradation of gasification reactivity and inhibition of
ended under 570°C or so, which indicated semi-coke composite gas of H2; in addition, CH4 was the most recog-
after-combustion. In the initial phase of rapid combus- nizable, the influence of H2 was stronger than that of
tion of six semi-coke samples, differences between TG CH4, and the increased concentration of reducing gases
and DTG curves were not evident. In the phase of max- increased its inhibitory effect.
imum weight loss rate, the maximum combustion rates of To compare the combustion and gasification reac-
different semi-coke were distinctive, with the reaction tivity of different semi-coke, time-dependent changes in
rate of char1 being the fastest, followed by char2; more- carbon conversion rates of different semi-coke are illu-
over, minor differences existed in the reaction rates of strated in Figure 3. At the same combustion reaction time,
char3–char6. In the late combustion phase, DTG curves the difference in combustion conversion rates of the dif-
of semi-coke no. 2–6 slightly advanced. The range of ferent semi-coke was minimal. From Figure 3b, at the
ignition temperature of the six semi-coke samples was same gasification reaction time, different semi-coke had
from 447°C to 455°C, which indicated that the differences observable differences in gasification reactivity. The time
in ignition temperature in the various semi-coke samples required by char1 to complete combustion and gasifica-
were poor. To compare the semi-coke combustion reac- tion was 700 s or so, and that of char2–char6 continu-
tivity values, the six curves were analyzed through com- ously increased; thus, this phenomenon became increas-
bustion reactivity indexes in Eq. 1. After calculation, ingly apparent during gasification. This indicated that the
semi-coke combustion reactivity indexes were sorted in pyrolytic atmosphere conditions influenced the gasifica-
descending order: char6 > char5 > char4 > char3 > char2 tion reactivity at a higher degree than that of combustion
> char1, which indicated that compared with the pyro- reactivity. The semi-coke has favorable combustion reac-
lysis atmosphere of N2, adding reducing gases CH4 tivity; therefore, the after-combustion temperature was
and H2 in the pyrolysis process of raw coal will reduce lower than 600°C, and the chemical reaction itself could
the combustion reactivity and gasification reactivity of be the restrictive link of combustion. The semi-coke gasi-
semi-coke. fication reaction temperature was higher than that of the
Figure 2b indicates that under a CO2 atmosphere, the combustion reaction; moreover, the chemical reaction
six semi-coke samples experienced a volatile and slow itself proceeded rapidly and the diffusion of reactants
gasification phase before 870°C or so, and a rapid gasifi- and products should be the restrictive link of this gasifi-
cation reaction happened under 870°C or so; moreover, cation process. Emphasis will be placed on the factors
the finishing temperature of gasification reaction was influencing semi-coke chemical reactions, such as
from 1,050°C to 1,100°C. The six semi-coke samples carbon chemical structure, functional group distribu-
had noticeable differences in TG and DTG curves com- tion, and micropore structural characteristics that influ-
pared with char1 prepared under a nitrogen atmosphere; ence diffusion.
Table 2: Characteristic parameters of semi-coke during combustion and gasification processes
Samples Tmax (°C) Vmax (°C min−1) Ti (°C) Tf (°C) Rc (×103) T0.5 (°C) Rg (s−1 [×104])
char1 510 0.9915 447 574 2.21812 1,007 11.65501
char2 509 0.9396 454 567 2.0696 1,016 10.77586
char3 512 0.8657 447 559 1.93669 1,020 10.5042
char4 515 0.8468 448 572 1.89018 1,028 9.80392
char5 505 0.8106 450 579 1.80133 1,034 9.27644
char6 501 0.7875 455 570 1.73077 1,048 8.47458194 Yuan She et al.
(a) (b)
1.0
1.0
0.8 0.8
0.6 0.6
D
char1
D
char1
char2 char2
0.4 char3 0.4
char3
char4
char4
0.2 char5 0.2 char5
char6
char6
0.0 0.0
0 100 200 300 400 500 600 700 800
0 200 400 600 800 1000
Time / s Time / s
Figure 3: Time-dependent changes in carbon conversion rates of different semi-coke. (a) Air atmosphere; (b) CO2 atmosphere.
3.2 XRD analysis of chars probably promoted the enhancement of the semi-coke gra-
phitization degree because the hydrogen-free radicals
Figure 4 shows the XRD spectrums of the six semi-coke generated by H2 and CH4 could permeate the semi-coke
samples. The C(002) peaks of samples char1–char6 shar- surface and would enhance the condensation of aromatic
pened, which indicated that the carbon microcrystalline rings, thereby decreasing the number of available active
structures of semi-coke prepared by adding reducing sites [20–22].
gases in the atmosphere were likely to be of the graphite Figure 5 shows the relationships of semi-coke Lc with
state. X’Pert highscore analysis software, together with the combustion and gasification reactivity indexes. As
Eq. 4 and 5, was used to obtain the position of C(002) shown in Figure 5, semi-coke carbon microcrystalline
peak, lamellar spacing d002 , and aromatic lamella stack structure has identical influence rules on combustion
thickness Lc, and the results are listed in Table 3. reactivity and gasification reactivity, namely, with the
In Table 3, the differences in 2θ angle and d002 corre- enhanced ordering degree of carbon microcrystalline
sponding to the C(002) peaks of different semi-coke are structure, decreased semi-coke reactivity indexes, and
unsatisfactory. However, the Lc values of char1–char6 the certain linear relation of the two. In a study on the
gradually increased, thereby indicating that the aromatic influence of heat treatment temperature and heating rate
lamella stack thickness of the semi-coke gradually on coke reactivity, Lu et al. found [24] that from amor-
expanded. The number of carbon stack lamellas increased, phous carbon, the carbon structure described by the aro-
which indicated the enhancement of the pseudo-crystalline maticity and crystallite size became highly systematized
phase degree of semi-coke samples and further indicated with the rise in heat treatment temperature and decline in
the enhancement of the carbon ordering degree in the heating rate, thus, semi-coke reactivity was degraded.
semi-coke. Adding the reducing gases in semi-coke pyrolysis With the increased proportion of reducing gases in the
nitrogen atmosphere, the semi-coke carbon structure
became highly ordered, which degraded semi-coke reac-
C(002)
tivity because when the size of the aromatic lamella
char1
char2
char3
char4
char5 Table 3: Characteristic parameters of microcrystalline structure of
Intensity
char6 semi-coke
Samples C(002) (°) d002 (10−10 m) Lc (10−10 m) Lc (d002)
char1 24.83 3.58 12.09 2.26
char2 24.91 3.57 12.21 2.20
char3 25.01 3.56 12.26 2.32
20 25 30 35 40 45 50 55 60
char4 25.02 3.56 12.39 2.36
2 Theta /degree char5 25.03 3.56 12.50 2.39
char6 25.04 3.56 12.93 2.51
Figure 4: XRD spectrums of different semi-cokes.Combustion and gasification characteristics of pyrolytic semi-coke 195
(a) 2.4 (b) 12.5
2.3 12.0
2.2 11.5
11.0
2.1
Rc×10-3
Rg×10-4
y=6.3907-0.5299x y=40.5837-3.6326x
10.5
2.0 R2=0.7235 R2=0.8833
10.0
1.9
9.5
1.8 9.0
1.7 8.5
1.6 8.0
8.0 8.2 8.4 8.6 8.8 9.0 8.0 8.2 8.4 8.6 8.8 9.0
Lc / ×10-10m Lc / ×10-10m
Figure 5: Relationships of semi-coke Lc with combustion and gasification reactivity indexes. (a) Lc vs Rc; (b) Lc vs Rg.
increased, the ratio of the active marginal carbon atoms char1 is significantly lower than that of other semi-focal
to the non-active carbon atoms in the cardinal plane will points. char1 has obvious vibration peaks at 1,058 and
be reduced [32]. Moreover, when the arrangement of the 1,183 cm−1, which are stretching vibration peaks of
aromatic lamellas became organized, the active carbon Si–O–Si, Si]O, or Si–O–C. Oxygen-containing func-
atoms bonded with the defects and the hetero atoms were tional groups are obvious in char1. When the pyrolytic
reduced [21]. Both could degrade semi-coke combustion atmosphere contains H2 or CH4, removal of hydroxyls and
and gasification reactivity. oxygen-containing functional groups reduced content of
3.3 FTIR analysis of chars
2518
2926 746
879
Figure 6 shows the FTIR spectra of different semi-coke. To 3427
1058
1586
carry out specific analysis on the wave number region of 1163
char1
semi-coke 4,000–400 cm−1, the entire infrared spectrum
1442
is divided into four parts [31] as follows: hydroxyl absorp- 3646 2972 2880 2510 2366
1802
tion peak (3,600–3,000 cm−1), aliphatic hydrocarbon 1565
708
absorption peak (3,000–2,700 cm−1), oxygen-containing
1370 879
1440
char2
functional group absorption peak (1,800–1,000 cm−1),
and aromatic hydrocarbon absorption peak (900–700 cm−1). 2870 1802
2513
2366
Transmittance /%
It can be seen from Figure 6 that the distribution of func- 708
879
tional groups in different semi-coke samples is different. char3 1436
Compared with other semi-coke samples, there is an 2870 1802
obvious hydroxyl absorption peak between char1 and 2513
char2, but char2 is mainly composed of free hydroxyl 708
879
groups, char1 is mainly composed of phenol, alcohol, char4 1436
carboxylic acid, and hydroxyl in water, and there are 1802
2870
obvious antisymmetric stretching vibrations of CH3 and 2513
CH2 in naphthenes or aliphatic groups. All the semi-coke 708
1436
char5 879
samples had stretching vibration of S–H bond near
2,510 cm−1, but the vibration peak shape of char1 was 1802
2870
2513
not obvious. CH3 vibration peak exists in all samples
near 1,440 cm−1, but obvious vibration peak exists in 1436
708
char6
char1 and char2 near 1,590 cm−1. This is the vibration 879
4000 3500 3000 2500 2000 1500 1000 500
peak of aromatic C]C, and it is the skeleton vibration Wavenumber / cm-1
of benzene ring. char1–char6 have obvious characteristic
peaks near 880 and 710 cm−1, but the peak intensity of Figure 6: Semi-coke FTIR spectrums.196 Yuan She et al.
Table 4: Structure parameters deduced from FTIR for chars In summary, when CH4 or H2 is added in the pyrolysis
atmosphere, aliphatic hydrocarbons and carbon groups
Samples Hal (%) Hal/H Cal/C fa in raw coal are more easily decomposed and precipitated,
char1 0.789 0.326 0.05261 0.94739 so as to improve the fa of semi-coke and reduce the reac-
char2 0.559 0.277 0.04344 0.95656 tivity of semi-coke. The influence of its functional groups
char3 0.497 0.266 0.04051 0.95949 is manifested in the fact that hydroxyl group, C]C, and
char4 0.412 0.184 0.04869 0.95131 oxygen-containing functional groups have a promoting
char5 0.37 0.184 0.04336 0.95664
effect on the improvement of reactivity, whereas the
char6 0.359 0.184 0.04228 0.95772
increase in S–H and aromatic hydrocarbon contributes
to the improvement of aromaticity, thus reducing the
unsaturated side chains, and elevated condensation degree reactivity of semi-coke.
of macromolecular network will be facilitated.
To further describe the differences in various semi-
coke samples in the macromolecular structure, Eq. 6–8
were used to calculate and compare the aromaticity of 3.4 Effects of pore structure of chars on
semi-coke. Table 4 presents the obtained IR structural reactivity
parameters. It can be seen from the table that when
CH4 or H2 is added in the pyrolysis atmosphere, aliphatic Figure 8 shows the pore structural distribution of the six
hydrocarbons and carbon groups in the raw coal are semi-coke samples. Figure 8a shows that micropores
more easily decomposed and precipitated, which is spe- below 2 nm and mesopores at 2–50 nm contributes to
cifically reflected in the significant decrease in the con- the main specific surface area. Independent addition of
tents of Hal and Har and the significant increase in fa of the H2 or CH4 to the pyrolytic atmosphere increased the spe-
samples. However, the influence of CH4 atmosphere and cific surface area of semi-coke micropores, and the micro-
H2 atmosphere is different. Compared with H2 atmo- pore-specific surface areas of char2 and char3 added with
sphere, CH4 atmosphere has a more obvious effect on fa CH4 gas were significantly enlarged. Differences in spe-
promotion. cific surface area between semi-coke mesopores were
Relationships of semi-coke aromaticity with combus- visible, and the independent addition of H2 or CH4 in
tion and gasification reactions are shown in Figure 7. pyrolytic atmosphere reduced the specific surface area
There is no obvious relationship between the aromaticity of the semi-coke mesopores. Mesopore-specific surface
and combustion and gasification reaction index, but areas of char3 and char4 added with H2 gas decreased
char1 gasification reactivity and combustion reactivity more evidently than those of char2 and char3 added with
are best, its corresponding fa also minimum, shows that CH4 gas, and the specific surface areas of mesopores
N2 pyrolysis atmosphere compared to add CH4 and H2, added with both H2 and CH4 were mostly reduced. Meso-
can maintain the sample in a certain amount of reactive pores contributed to the main pore volume and the order
strong aliphatic group, inhibit samples influence the of pore volumes of the different semi-coke was consistent
reactivity of the increase of aromatic carbon. with rule of specific surface area. The difference between
(a) 2.4 (b) 12.5
2.3 12.0
2.2 11.5
11.0
Rc×103
2.1
Rg×104
10.5
2.0
10.0
1.9
9.5
1.8 9.0
1.7 8.5
1.6 8.0
0.945 0.948 0.951 0.954 0.957 0.960 0.963 0.945 0.948 0.951 0.954 0.957 0.960 0.963
fa fa
Figure 7: Relationships of semi-coke fa with combustion and gasification reactivity indexes. (a) fa vs Rc; (b) fa vs Rg.Combustion and gasification characteristics of pyrolytic semi-coke 197
(a) (b)
Specific surface area / m 2g-1
35 55
macropore macropore
Pore volume / ×10 3ccg-1
50
30 mesopore mesopore
micropore 45 micropore
25 40
35
20 30
15 25
20
10 15
10
5
5
0 0
char1 char2 char3 char4 char5 char6 char1 char2 char3 char4 char5 char6
Samples Samples
Figure 8: Specific surface area and pore volume of semi-coke.
micropores in terms of pore volume was not obvious, and micropores toward mesopores, as well as the cross-
pore volumes 50 nm above pores were small. The above linking and combination of mesopores. As a result, the
results showed that the main pore structural types of pore-specific surface area and pore volume were reduced.
semi-coke were micropores and mesopores; moreover, Figures 9 and 10 show the relationships between
the influence of the regularity of the pyrolytic atmosphere semi-coke-specific surface area and combustion and
on micropores was not strong, but the pyrolytic atmo- gasification reactivity indexes. Combustion and gasifica-
sphere could reduce the quantity of mesopores. This is tion reactivity indexes presented weak linear correlations
because, with an elevated pyrolysis degree, the genera- with micropore-specific surface area and pore volume.
tion of micropores, which dominated the semi-coke-spe- However, they have a favorable linear correlation with
cific surface area, was reduced. Moreover, the CH4 and H2 mesopore volume (i.e., as mesopore-specific surface
in the pyrolytic atmosphere reacted with macromolecular area and pore volume increased, the combustion and
side chains in the coal during pyrolysis to improve the gasification reactivity were improved) because compared
yield and precipitation rate of pyrolytic gases [33], which with homogeneous reaction, as heterogeneous reaction
then further boosted the development and growth of processes, the semi-coke combustion and gasification
Figure 9: Relationships between semi-coke-specific surface area and reactivity indexes. (a) Micropore vs Rc; (b) mesopore vs Rc;
(c) micropore vs Rg; (d) mesopore vs Rg.198 Yuan She et al.
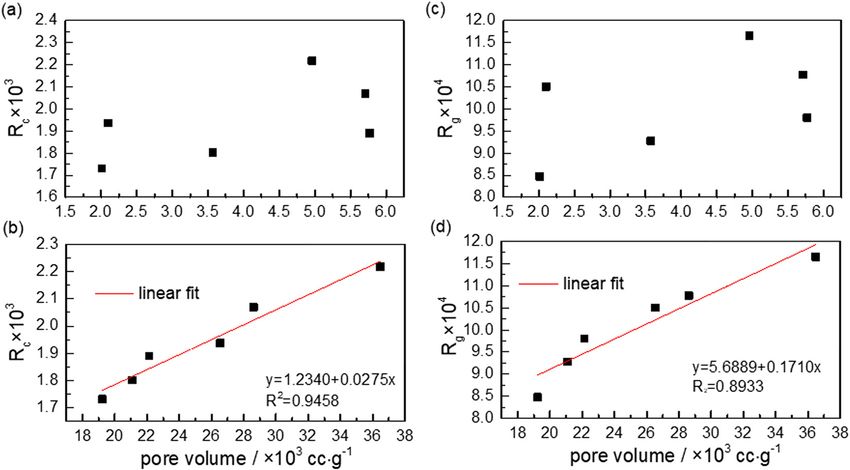
Figure 10: Relationships between semi-coke pore volume and reactivity indexes. (a) Micropore vs Rc; (b) mesopore vs Rc; (c) micropore vs Rg;
(d) mesopore vs Rg.
contained two important features, namely diffusion of reactivity was also analyzed. The results showed that
reactant molecules and reaction interface conditions. CH4 and H2 exhibited inhibiting effect on semi-coke reac-
Semi-coke pore structure not only provided a diffusion tivity. This inhibiting effect on gasification reactivity was
channel for oxygen/carbon dioxide molecules that is stronger than that of combustion reactivity, and the influ-
required by combustion and gasification but also pro- ence of H2 was stronger than that of CH4. The reducing
vided a large specific surface area for gas analysis and solid gases in the atmosphere enhanced the disordering degree
contact during gas–solid heterogeneous reaction [28]. of the carbon crystalline structure, boosted removal
Therefore, the developed pore structure of semi-coke of hydroxyl and oxygen-containing functional groups,
improved their combustion and gasification reactivity. reduced content of unsaturated side chains, and elevated
Semi-coke combustion and gasification reactivity the condensation degree of the macromolecular network.
were closely related to the ordering degree of carbon The main semi-coke pore structural types were micro-
chemical structure and micropore structure; moreover, pores and mesopores. Influence on the regularity of the
they had a certain relationship with the distribution of pyrolytic atmosphere on micropores was not strong, but
functional groups. For the convenience of semi-coke the pyrolytic atmosphere could inhibit mesopore devel-
application in iron-making, the pyrolysis temperature, opment. Aromatic lamella stack height of the semi-coke,
holding time, heating rate, and other conditional para- specific surface area of mesopore, and pore volume had
meters during pyrolysis should be reasonably regulated favorable linear correlations with semi-coke reactivity
to counterbalance the adverse effects of reducing gases in indexes.
the pyrolytic atmosphere on the semi-coke reactivity, so
that they meet blast furnace PCI requirements. Research funding: The authors are grateful for the sup-
port of the National Natural Science Foundation of China
(No. 51904223), the Natural Science Foundation Research
Project of Shaanxi, China (No. 2020JQ-674), and the
4 Conclusions Science and Technology Plan of Yulin (No. Z20200396
and Z20200397).
In this research, the combustion and gasification charac-
teristics of semi-coke prepared under pyrolytic atmo- Author contributions: Yuan She: writing – original draft,
spheres rich in CH4 and H2 at different proportions were review and editing, methodology, formal analysis; Chong
investigated, and the effect of carbon chemical structure, Zou: writing – review and editing, methodology; Shiwei
functional groups, and micropore structure of char on Liu: formal analysis; Keng Wu: methodology, projectCombustion and gasification characteristics of pyrolytic semi-coke 199
administration; Hao Wu: visualization, formal analysis; [12] He XM, Fu PR, Wang CX, Lin HT, Wu S, Cao SX. Combustion
Hongzhou Ma: project administration; Ruimeng Shi: behavior of low rank coal char application in blast furnace
resources. injection. Iron Steel. 2014;49(9):92–6. doi: 10.13228/j.boy-
uan.issn0449-749x.20140066.
[13] Haykiri-Açma H, Ersoy-Meriçboyu A, Küçükbayrak S.
Conflict of interest: The authors state no conflict of Combustion reactivity of different rank coals. Energ Convers
interest. Manag. 2002;43(4):459–65. doi: 10.1016/S0196-8904(01)
00035-8.
Data availability statement: All data generated or ana- [14] Chen CH, Du SW, Yang TH. Volatile release and particle for-
mation characteristics of injected pulverized coal in blast
lyzed during this study are included in this published
furnaces. Energ Convers Manag. 2007;48(7):2025–33.
article. doi: 10.1016/j.enconman.2007.01.001.
[15] Yu JL, Lucas JA, Wall TF. Formation of the structure of chars
during devolatilization of pulverized coal and its thermopro-
perties: a review. Prog Energy Combust Sci.
2007;33(2):135–70. doi: 10.1016/j.pecs.2006.07.003.
References [16] Zou C, Wen LY, Zhang SF, Bai CG, Yin GL. Evaluation of catalytic
combustion of pulverized coal for use in pulverized coal
[1] Blesa MJ, Miranda JL, Moliner R, Lzquierdo MT, Palacios JM. injection (PCI) and its influence on properties of unburnt chars.
Low-temperature co-pyrolysis of a low-rank coal and biomass Fuel Process Technol. 2014;119:136–45. doi: 10.1016/
to prepare smokeless fuel briquettes. J Anal Appl Pyrolysis. j.fuproc.2013.10.022.
2003;70(2):665–77. doi: 10.1016/S0165-2370(03)00047-0. [17] Cai HY, Guell AJ, Chatzakis IN, Lim JY, Dugwell DR, Kandiyoti R.
[2] Wan X, Xing G, Wang Y. Development analysis of low-tem- Combustion reactivity and morphological change in coal
perature pyrolysis technology for low rank coal. Dry Technol chars: Effect of pyrolysis temperature, heating rate and pres-
Equip. 2015;13(2):1–6. doi: 10.16575/j.cnki.issn1727- sure. Fuel. 1996;75(1):15–24. doi: 10.1016/0016-2361(94)
3080.2015.02.004. 00192-8.
[3] Gupta S, Sahajwalla V, Al-Omari Y, French D. Influence of [18] Hu JH, Chen YQ, Qian KZ, Yang ZX, Yang HP, Li Y, et al.
carbon structure and mineral association of coals on their Evolution of char structure during mengdong coal pyrolysis:
combustion characteristics for pulverized coal injection (PCI) influence of temperature and K2CO3. Fuel Process Technol.
application. Metall Mater Trans B. 2006;37(3):457–73. 2017;159:178–86. doi: 10.1016/j.fuproc.2017.01.042.
doi: 10.1007/s11663-006-0030-y. [19] Li Q, Wang ZH, He Y, Sun Q, Zhang YW, Kumar S, et al. Pyrolysis
[4] Osório E, Gomes MLI, Vilela ACF, Kalkreuth W, Almeida MA, characteristic and evolution of char structure during pulver-
Borrego AG, et al. Evaluation of petrology and reactivity of coal ized coal pyrolysis in drop tube furnace: influence of tem-
blends for use in pulverized coal injection (PCI). Int J Coal Geol. perature. Energy Fuel. 2017;31(5):4799–807. doi: 10.1021/
2006;68(1–2):14–29. doi: 10.1016/j.coal.2005.11.007. acs.energyfuels.7b00002.
[5] Wijayanta AT, Alam MS, Nakaso K, Fukai J, Kunitomo K, [20] Colette BD, Cypres R, Fontana A, Hoegaerden M. Coal hydro-
Shimizu M. Combustibility of biochar injected into the raceway methanolysis with coke-oven gas: 2. Influence of the coke-
of a blast furnace. Fuel Process Technol. 2014;117:53–9. oven gas components on pyrolysis yields. Fuel.
doi: 10.1016/j.fuproc.2013.01.012. 1995;74(1):17–9. doi: 10.1016/0016-2361(94)P4324-U.
[6] Gupta S, Sahajwalla V, Wood J. Simultaneous combustion of [21] Colette BD, Fontana A, Labani A, Laurent P. Coal hydro-
waste plastics with coal for pulverized coal injection applica- methanolysis with coke-oven gas: 3. Influence of the coke-
tion. Energy Fuels. 2006;20(6):2557–63. doi: 10.1021/ oven gas components on the char characteristics. Fuel.
ef060271g. 1996;75(11):1274–8. doi: 10.1016/0016-2361(96)00108-1.
[7] Zhang LG, Ren W, Liu DJ, Zhang W, Wang ZY, Deng W. Study on [22] Liao HQ, Li BQ, Zhang BJ. Co-pyrolysis of coal with hydrogen-
semi-coke used as pulverized coal for injection into blast rich gases: 1. Coal pyrolysis under coke-oven gas and synth-
furnace. Angang Technol. 2015;1:13–17. esis gas. Fuel. 1998;77(8):847–51. doi: 10.1016/S0016-
[8] Yang SP, Cai WM, Zheng HA, Liang JQ, Zhang SJ, Xue QC. 2361(97)00257-3.
Performance analysis of semi-coke for blast furnace injection. [23] Zhong M, Ma F. Analysis of product distribution and quality for
Chin J Process Eng. 2014;14(5):896–900. continuous pyrolysis of coal in different atmospheres. J Fuel
[9] Xu CY, Dong J, Li XT, Tang AJ. Experimental research on semi- Chem Technol. 2013;41(12):1427–36.
coke used for blast furnace injection and metallurgical per- [24] Lu LM, Sahajwalla V, Harris D. Coal char reactivity and
formance. J Iron Steel Res. 2016;44(4):17–9. structural evolution during combustion-factors influencing
[10] Yang SP, Guo SQ, Zhang PH, Zhou JF, Wang M. Influence of blast furnace pulverized coal injection operation. Metall
semi-coke on blending coal injection characteristics for blast Mater Trans B. 2001;32(5):811–20. doi: 10.1007/s11663-001-
furnace. J Iron Steel Res. 2017;29(3):201–7. doi: 10.13228/ 0068-9.
j.boyuan.issn1001-0963.20160146. [25] Dong XF, Pinson D, Zhang SJ, Yu AB, Zulli P. Gas-powder flow in
[11] Li PC, Zhang JL, Xu RS, Song TF. Representation of character- blast furnace with different shapes of cohesive zone. Appl
istics for modified coal, simi-coke and coke used in blast fur- Math Model. 2006;30(11):1293–309. doi: 10.1016/
nace injection. Energy Metall Ind. 2015;34(3):41–5. j.apm.2006.03.004.200 Yuan She et al.
[26] Suzuki T, Smoot LD, Fletcher TH, Smith PJ. Prediction of [30] Kevin AD, Robert HH, Nancy YCY, Thomas H. Evolution of char
high-intensity pulverized coal combustion. Combust Sci chemistry, crystallinity, and ultrafine structure during pulver-
Technol. 1986;45(3-4):167–83. doi: 10.1080/ ized-coal combustion. Combust Flame. 1995;100(1–2):31–40.
00102208608923848. doi: 10.1016/0010-2180(94)00062-W.
[27] Gong XZ, Guo ZC, Wang Z. Reactivity of pulverized coals during [31] Li QZ, Lin BQ, Zhao CS, Wu WF. Chemical structure analysis of coal
combustion catalyzed by CeO2 and Fe2O3. Combust Flame. char surface based on Fourier-transform infrared spectrometer.
2010;157(2):351–6. doi: 10.1016/ Proc CSEE. 2011;31(32):46–52. doi: 10.1007/s12583-011-0163-z.
j.combustflame.2009.06.025. [32] Lu LM, Kong CH, Sahajwalla V, Harris D. Char structural
[28] Liang P, Wang ZF, Bi JC. Process characteristics investigation ordering during pyrolysis and combustion and its influence on
of simulated circulating fluidized bed combustion combined char reactivity. Fuel. 2002;81(9):1215–25. doi: 10.1016/S0016-
with coal pyrolysis. Fuel Process Technol. 2007;88(1):23–8. 2361(02)00035-2.
doi: 10.1016/j.fuproc.2006.05.005. [33] Scaccia S, Calabrò A, Mecozzi R. Investigation of the evolved
[29] Li XG, Ma BG, Xu L, Luo ZT, Wang K. Catalytic effect of metallic gases from Sulcis coal during pyrolysis under N2 and H2
oxides on combustion behavior of high ash coal. Energy Fuel. atmospheres. J Anal Appl Pyrolysis. 2012;98(11):45–50.
2007;21(5):2669–72. doi: 10.1021/ef070054v. doi: 10.1016/j.jaap.2012.05.001.You can also read