Association analysis of four storage protein components using microsatellite markers in a japonica rice collection
←
→
Page content transcription
If your browser does not render page correctly, please read the page content below
RESEARCH

Association analysis of four storage protein
components using microsatellite markers in
a japonica rice collection
Wentao Zhang1, Xiuling Zhang1, Jingguo Wang1, Hualong Liu1, Jian Sun1, Hongliang Zheng1,
Guangxin Zhao1, Hongwei Zhao1, and Detang Zou1*
1
 Northeast Agriculture University, No. 600 Changjiang Street, Harbin 150030, China.
*
 Corresponding author (zoudtneau@126.com).

Received: 24 July 2018; Accepted: 30 October 2018; doi:10.4067/S0718-58392019000100003

                                                         ABSTRACT

Protein content is one of the main nutrition quality traits used to measure nutrition value in rice (Oryza sativa L.) Therefore,
improving the protein content is a main target for nutrition quality breeding in rice. Previous studies have mainly focused
on the total protein content in brown and polished rice using bi-parental segregating populations. Few researchers have
focused on four different protein component traits (glutelin, prolamin, albumin, and globulin) in rice, and little is known
regarding association analysis in natural populations. In this study, 329 japonica accessions (Oryza sativa L. subsp.
japonica Kato) were collected from worldwide geographic distributions and genotyped using 154 microsatellite markers
to detect the association between four protein component traits and relative markers in the tested panel. The Coomassie
Brilliant Blue G-250 method was used to measure the phenotype of four protein components. A total of 845 amplified
alleles were detected with allele number ranging from 2 to 9. The whole population was divided into three subgroups via
software STRUCTURE 2.3.4. The scatterplot showed that the LD (linkage disequilibrium) decay distance was about 30
cM in the whole tested population. A total of 15 simple sequence repeats (SSR) markers were identified by using both the
general linear model (GLM) and mixed linear model (MLM). These associated marker loci can provide a higher variety
of choices in improving the nutrition quality of rice. In addition, the carrier materials with excellent alleles identified in
this study can be used as parental genotypes in rice molecular breeding in the future.

Key words: Albumin, association analysis, excellent alleles, globulin, glutelin, Oryza sativa subsp. japonica, population
structure, prolamin, protein components.

                                                     INTRODUCTION

Plants are the main source of the world’s protein. Nearly 70% of the protein consumed by humans globally comes
directly from plants. Crop proteins account for 50% of the world’s total protein requirements and 70% of the plant
protein consumed (Chung and Pomerantz, 2000). The protein content proportion of wheat (Triticum aestivum L.) and
maize (Zea mays L.) is 12% and 14%, respectively. The protein content of rice (Oryza sativa L.) grain is relative lower,
at approximate 8% (Juliano, 1985). However, compared with other crops, rice protein exhibits good solubility, biological
value and energy absorption. The composition of amino acids in rice is in relative good balance, with higher content of
some essential amino acids, such as lysine and threonine (Lasztity, 1984). These aspects all exhibit the advantages of
high-quality rice. Moreover, rice can provide 60%-65% of the energy requirements and over 40% of the dietary protein
for people living in regions that grow rice (Lu and Xu, 1996). Different rice protein content not only affect the nutritional
value of rice but also influences protein absorption and overall level of health people who consume rice as staple food.

CHILEAN JOURNAL OF AGRICULTURAL RESEARCH 79(1) JANUARY-MARCH 2019                                                              3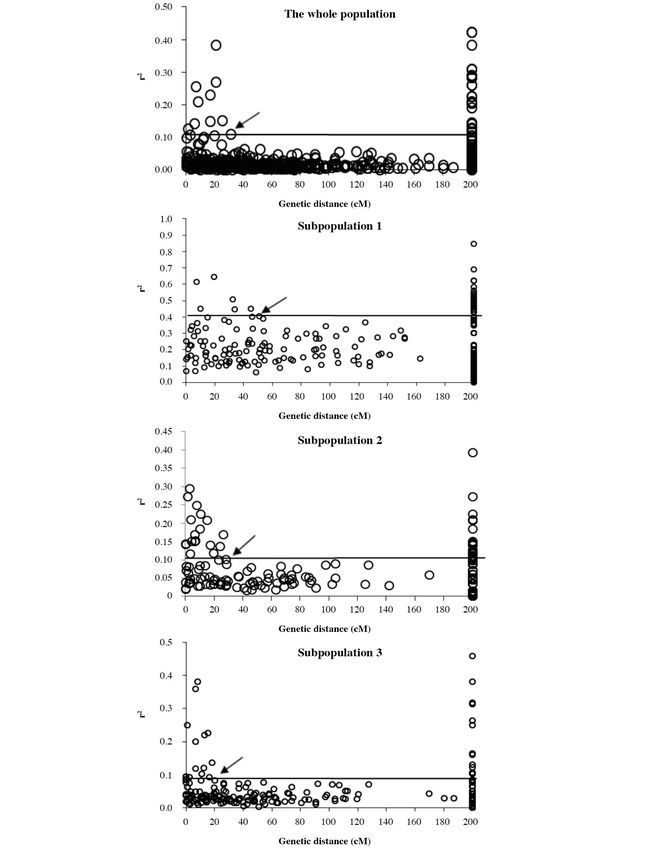
Protein is often considered to be the second most important nutrient in the endosperm of rice. Most of the proteins in
rice seeds are storage proteins. While there are many kinds of structural proteins in rice, they comprise a minimal amount
of the total protein content. Therefore, rice proteins mainly refer to storage proteins. According to the differences in protein
solubility, rice storage proteins can be classified into four types: glutelin, prolamin, albumin and globulin. Most cereals,
such as wheat, maize and barley (Hordeum vulgare L.), produce prolamins as their major seed storage proteins (SSPs).
However, glutelin is produced as the major SSP in rice, and it accounts for nearly 80% of the total endosperm protein in
rice (Shewry and Halford, 2002). On one hand, eating rice with high protein content can increase protein absorption for
healthy people; on the other hand, people with kidney disease or diabetes must restrict protein intake because absorbing
more glutelin will impose a greater physiological burden (Wang et al., 2008). Therefore, increasing or decreasing protein
content and regulating the proportion of protein content in rice to satisfy the dietary requirements of different people has
become an important target in improving rice nutrition quality genetically.
   Most quantitative trait locus (QTL) studies have focused on bi-parental or multiparent populations, which would limit
the allele diversity of the selected parents (Pascual et al., 2016). Association analysis is an effective approach to identify
target loci that can be divided into candidate-gene association analysis and genome-wide association study (GWAS).
Association mapping utilizes a natural population, including diverse sources of germplasm. Comparing to linkage
analysis in studies on quantitative trait identification in plants, association analysis can take advantage of a higher number
of natural alleles and analyze the function of many different alleles. Furthermore, since association mapping utilizes a
natural population instead of a bi-parental segregating population, association mapping saves more time in constituting
the population (Niu et al., 2013). Considering the huge genetic diversity in a worldwide rice natural population, genome-
wide association mapping can also be a feasible approach to identify many different traits and to improve the mapping
resolution simultaneously (Wu et al., 2015). Thus, association mapping is a powerful tool that can be used to identify
complex quantitative traits and is a useful approach for genetic dissection. In recent years, association mapping has been
utilized to identify the associated relationships between relevant loci and various traits, such as yield (Vanniarajan et al.,
2012), outcrossing ratios (Yan et al., 2009), quality (Jin et al., 2010) and resistance (Jia et al., 2012), in rice and other
crops. Most studies of rice protein have focused on identifying relevant glutelin genes (Taiji et al., 2009) and the breeding
of new low-glutelin rice accessions (Chen et al., 2010). There are no association studies for the four storage protein
components in rice.
   In this study, a natural population of 329 japonica accessions (Oryza sativa L. subsp. japonica Kato) with a worldwide
geographic distribution was collected to construct the association panel that was used to conduct the association mapping
between relevant s simple sequence repeats (SSR) marker loci and four storage protein components in rice. The aims
were: (1) to measure phenotypic traits and perform the phenotypic descriptive analysis to ensure protein distinctions
among different accessions, (2) to conduct population structure analysis and genetic diversity analysis in this japonica
rice association panel, (3) to estimate the linkage disequilibrium (LD) on the whole genome and each subgroup in this
association panel, (4) to identify the SSR markers that controlling four storage protein components in rice, and (5) to
explore excellent alleles of four protein components for the design of parental combinations in the future.

                                           MATERIALS AND METHODS

Plant material
A total of 329 japonica rice (Oryza sativa L. subsp. japonica Kato) accessions with different geographic distributions
were collected to construct the association panel. All the accessions were collected from different breeding institutions in
China, including the Chinese Academy of Agricultural Sciences, Heilongjiang Academy of Agricultural Sciences, Liaoning
Academy of Agricultural Sciences and Northeast Agricultural University. The natural population included 196 accessions
cultivated in China, 92 from Japan, 24 from Korea, seven from Russia, four from the Democratic People’s Republic of
Korea (DPRK), four from France, one from Italy, and one from Bulgaria. All the tested accessions were planted in the A
Cheng Experimental Farm of Northeast Agricultural University, Harbin (128°08’ E, 47°98’ N), Heilongjiang Province,
China, in the spring of 2016 and 2017. Each accession was planted in three rows, 2 m in length, to guarantee biological
repeats. The distance between each row was 20 cm. There were 21 hills in a row, and hill spacing in each row was 10 cm.
Fertilizer application and pest control were identical to those of normal field management.

CHILEAN JOURNAL OF AGRICULTURAL RESEARCH 79(1) JANUARY-MARCH 2019                                                              4
Phenotypic measurement To consider the different maturation periods of all the tested accessions, all accessions were harvested on 5 September 2016 and 1 September 2017. Phenotyping for all the harvested accessions was conducted at the Rice Research Institute of Northeast Agricultural University in Harbin, Heilongjiang, China. The Coomassie Brilliant Blue G-250 method was used to measure four storage protein components: glutelin, prolamin, albumin, and globulin. The brown rice was crushed into powder and was passed through a 60-mesh sieve, 0.1 g powder was weighed in a centrifuge tube, and 2 mL pure distilled water were added to the powder in the tube. Next, the sample was placed in a water bath for 1 h at 50 °C, shaken for 30 min, and centrifuged for 15 min (12 000 rpm). This process was repeated three times to ensure the accuracy. The main component of this extract was albumin. Two milliliters of 8% NaCl were added to the sediment in the tube, and then the process of water bath, shaking, and centrifugation described above was repeated. The main component of this extract was globulin. Two milliliters of 75% C2H5OH were added to the sediment in the tube, then the process of water bath, shaking, and centrifugation was repeated. The main component of this extract was prolamin. Two milliliters of 0.2% NaOH were added to the sediment in the tube, then the process of water bath, shaking, and centrifugation was again repeated. The main component of this extract was glutelin. The Coomassie Brilliant Blue G-250 method and a spectrophotometer were used to measure four protein components content (Wang et al., 2008). Bovine serum albumin (BSA), ethanol, phosphate and distilled water were used to establish the standard curve. DNA extraction, PCR and genotyping Fresh leaves from each accession were collected 4 wk after transplantation and wrapped in aluminum foil to ensure DNA activity before extraction. Genomic DNA was extracted using the cetyl-trimethyl ammonium bromide (CTAB) method (Doyle, 1990). Agarose gel electrophoresis was used to evaluate quality of the extracted DNA. The brightness and thickness of the bands were used to assess the concentration of the extracted DNA. One thousand pairs of microsatellite markers evenly covering the 12 chromosomes of rice were selected for agarose gel electrophoresis. All the microsatellite markers were retrieved and designed from http://www.gramene.org and were synthesized by the Sangon Biotech Co., Ltd. (Shanghai, China) subsequently. Twelve accessions of the association panel were selected in this experiment to screen the microsatellite markers to find more polymorphic ones. Three of the selected accessions were from three different provinces in China (Heilongjiang, Jilin, and Liaoning), two were from Japan, and two were from Korea. The remaining five accessions were from Bulgaria, France, Italy, DPRK, and Russia. After the screening, 154 pairs of SSR markers showed greater polymorphism than others in this experiment. The PCR reaction was accomplished in a 10 μL volume that contained 1 μL DNA (40 ng μL-1), 1 μL forward primer (10 μM), 1 μL reverse primer (10 μM), 5 μL 2×Taq MasterMix and 2 μL ddH2O. The 2×Taq MasterMix included Taq DNA Polymerase, PCR Buffer, Mg2+ (3 mM) and dNTPs (400 μM). PCR amplification was performed under the following conditions: an initial denaturation at 94 °C for 5 min, followed by 35 cycles of 94 °C for 30 s, 55 °C for 30 s, 72 °C for 2 min 30 s, and a final extension at 72 °C for 10 min. A 6% denaturing polyacrylamide gel and silver stain were used to detect the PCR products. The alleles were separated due to the differences in allele length, and the stained alleles were analyzed based on their movement. Statistical analysis and population structure analysis The descriptive statistics of four protein component contents (glutelin, prolamin, albumin, and globulin) in each accession in 2016 and 2017 were obtained using Microsoft Excel 2016. Population structure was a major factor leading to false-positive associations (Manicacci et al., 2009). To avoid the effect of lacking population structure analysis and to ensure the accuracy of association results, all the tested accessions were genotyped to accomplish the population structure construction using 154 SSR markers that were evenly distributed throughout the rice genome. The software STRUCTURE 2.3.4 (Pritchard Lab., Stanford University, Stanford, California, USA) was used to construct the best model representing the population structure. A model for the admixture and the correlated allele frequencies were used to test the possible number of subpopulations (K) with a burn-in of 10 000 and a run length of 100 000. The hypotheses of 2-9 subpopulations (K) were tested with 10 independent runs. The most likely subpopulations (K) were determined by LnP(D) in the STRUCTURE output as well as by ΔK (Evanno et al., 2005). ΔK is an ad hoc statistic that is based on the rate of change in LnP(D) between the successive K values. Values of ΔK were determined using STRUCTURE CHILEAN JOURNAL OF AGRICULTURAL RESEARCH 79(1) JANUARY-MARCH 2019 5
HARVESTER (Earl, 2012). Based on the correct K value, each accession was allocated into its own subpopulation for
which the Q value was over 0.65 (Cui et al., 2013). The kinships among all the tested individuals were also estimated using
Spatial Pattern Analysis of Genetic Diversity on the basis of 154 SSR markers, to evaluate their genetic relationships.

Linkage disequilibrium analysis and association analysis
The square value of the correlation coefficient (r2) among different SSR markers was calculated to estimate the linkage
disequilibrium (LD) between all pairs of markers in this experimental panel. The extent of LD between significant
SSR loci was calculated using the software TASSEL3.0 (http://www.maizegenetics.net). To explore the average LD
decay in the whole genome and each subpopulation, significant r2 values were plotted against the genetic distance (cM)
between markers in Microsoft Excel. The 99% of r2 distribution for the markers without linkage was considered as the LD
background level, which determined the distance of LD decay. Pairs of loci were considered to have a significant level of
LD if the P-values were less than 0.01.
   The genome-wide association was accomplished via both a General Linear Model (GLM) and a Mixed Linear
Model (MLM) in TASSEL 3.0. The software TASSEL has been upgraded to version 5.0. However, TASSEL 3.0 was
the most suitable version to perform the association analysis using SSR markers. Because the Q-matrix can reduce false
associations (Yu and Buckler, 2006), the Q value obtained from the results of STRUCTURE 2.3.4 was regarded as a
covariate to ensure accuracy. These two approaches were utilized simultaneously in order to obtain the best associations
between the four target protein component traits and the corresponding SSR loci. Associations between traits and markers
were considered at a significant level when P < 0.01.

Identification of excellent alleles and carrier materials for four protein components
The SSR markers detected in both the GLM and MLM over 2 yr were summarized and to be further analyzed. The
computational procedure was as following:
                                                 αm = (∑Xmp)/nm - ∑Nq/nq
in this computational formula, αm is the value of the phenotypic effects of the mth allele, Xmp is the phenotypic value over
the pth accession with the mth allele, nm is the number of the accession with mth allele, Nq is the phenotypic value over all the
accessions, nq is the number of total accessions. If αm > 0, it means that the allele is considered to have a positive effect; If
αm < 0, it means that the allele is considered to have a negative effect (glutelin is an exception, the allele with low glutelin
content also will be the excellent allele). The excellent alleles of four protein components were identified by selecting the
largest αm value (the other excellent allele of glutelin was identified by selecting smallest αm value).

                                                          RESULTS

Phenotypic analysis
The phenotypic trait measurements of 329 accessions in the tested panel were accomplished in 2016 and 2017. Detailed
information of descriptive statistics for the four protein components is summarized in Table 1. The highest content of
glutelin was 51.248 mg g-1, and the corresponding accession was Tang Yuan 6, which was cultivated in Heilongjiang
Province in China (Table 1). The lowest content of glutelin was 19.799 mg g-1, from the accession Qiu Guang, which

                               Table 1. Descriptive statistics of four protein components in the
                               tested japonica association panel.
                               Protein                           Standard
                               component trait   Year    Mean    deviation       Range       CV
                               		                         mg		                   mg            %
                               Albumin  2016             4.276 0.468          1.336-5.417    10.94
                                        2017             4.290 0.475          1.329-5.428    11.18
                               Globulin 2016             0.915 0.192          0.097-1.523    20.98
                                        2017             0.907 0.181          0.099-1.506    19.96
                               Prolamin 2016             7.529 1.985          3.241-12.072   26.36
                                        2017             7.541 2.008          3.308-12.184   26.63
                               Glutelin 2016            40.446 5.076         19.855-51.006   12.55
                                        2017            40.675 5.148         19.799-51.248   12.66

CHILEAN JOURNAL OF AGRICULTURAL RESEARCH 79(1) JANUARY-MARCH 2019                                                               6
was cultivated in Japan. The highest glutelin content was 2.6 times higher than the lowest glutelin content. The highest
content of prolamin was 12.184 mg g-1, and the corresponding accession was Bai Da Du Xing Ya, which was cultivated
in Jilin Province in China. The lowest content of prolamin was 3.308 mg g-1, from the accession Dao Bei 45, which
was also cultivated in Japan. The highest content of prolamin was 3.7 times higher than that of the lowest in this tested
association panel. The range of albumin content was from 1.329 to 5.428 mg g-1, and the highest content was 4.1 times
greater than the lowest. The accession processing the albumin content of 1.329 mg g-1 was from Lao Guang Tou, which
was planted in Jilin Province in China. The accession processing the albumin content of 5.428 mg g-1 was from Liao Xing
6, which was planted in Liaoning Province in China. The range of globulin content was from 0.099 to 1.506 mg g-1, and
the highest was 15.2 times greater than the lowest. The accession with the lowest globulin content was Jin Gou, and it
was planted in Jilin Province in China. The accession with the highest globulin content was Hong Mao Dao Zi, and it was
planted in Jilin Province in China. Other important statistics are summarized in Table 1, including the mean, variation
and standard deviation. According to these results, the phenotypic data of the associated population conformed to a
normal distribution, meaning that the accessions selected to construct the association panel exhibited suitable phenotypic
diversity, and therefore, it was reasonable to utilize this population for the association analysis.
Genetic diversity in the japonica association panel
A total of 154 SSR markers with high levels of polymorphism were used to measure the genetic diversity of this natural
population. Statistics such as the number of alleles, gene diversity and polymorphism information content (PIC) were
calculated to estimate the genetic diversity in this japonica rice association panel. A total of 845 alleles were amplified
using 154 SSR markers across the 329 accessions. The number of alleles ranged from 2 to 9, and the average allele value
was 5.49 (Table 2). Genetic diversity and PIC ranged from 0.0276 to 0.8645 and 0.0288 to 0.8766, respectively.
Population structure and kinship estimate
All the 154 SSR markers were selected to conduct population structure analysis. Because the log-likelihood increased
with the K value increase, the ΔK value was used to determine the correct K value of the population structure. According
to the result of STRUCTURE HARVESTER, the whole population could be divided into three subpopulations because
the value of ΔK was much higher when the value of K was 3. The detailed trend of ΔK is shown in Figure 1. The three
subpopulations are marked as P1, P2, and P3. The detailed information on the three subpopulations is shown in Figure 2.
The number of accessions in P1 was the least among the three subpopulations, and it contained 29 accessions. Most of the
accessions were from northeast of China, and the remaining accessions in this subpopulation were from Japan and Russia.
P2 contained 81 accessions, and 80 of them were from northeast of China and Japan. Only one accession was from DPRK.
The accessions in this subpopulation showed relative concentrated distributions in comparison with the other subgroups.
P3 contained the highest number of accessions among all three subpopulations, with 147 accessions. The accessions of
P3 had relative wide distributions compared with those of subgroups P1 and P2, and the P3 accessions were from China,
Japan, Korea, Democratic People’s Republic of Korea (DRPK), Russia, Italy, and Bulgaria. P3 contained nearly all the
geographic distributions in this study except France. Because membership probabilities were all less than 0.65 in any
given subpopulation, the remaining 72 accessions were classified into a mixed group. Thus, the corresponding Q matrix
of K = 3 was used for further association analysis in this study.
According to the results of kinship estimates based on the 154 SSR markers, 58.6% of the tested accessions had
zero estimated kinship values. It demonstrates that over half of the accessions had no genetic relationships in this
population. The detailed information of the distribution of relative kinship estimates is summarized in Figure 3. As
Table 2. Summary of genetic diversity in the whole tested panel and each
subpopulation.
Groups Sample size Alleles Alleles/locus Gene diversity PIC
P1 29 557 3.62 0.3765 0.3522
P2 81 825 5.36 0.5982 0.5277
P3 147 767 4.98 0.5671 0.4832
MIX 72 704 4.57 0.5257 0.4659
Whole panel 329 845 5.49 0.5919 0.5473
PIC: Polymorphism information content.
CHILEAN JOURNAL OF AGRICULTURAL RESEARCH 79(1) JANUARY-MARCH 2019 7Figure 1. Different values of Delta K with the value change of K. The diagram shows that Delta K has the highest value
when K = 3. It also indicates that the tested population can be classified into three subpopulations.
shown in Figure 3, these results indicate that most accessions in this tested population had no or weak kinships. This
phenomenon might be because in the process of constructing this association population, broad range genotypes were
selected, and narrow similar genotypes were excluded.
Linkage disequilibrium and LD decay
As the whole panel could be classified into three subpopulations, LD estimates were performed in the whole panel and in
each subpopulation. The average r2 of locus pairs was 0.0109 in the whole panel, and 41.35% were at a significant level.
P < 0.01 was regarded as the threshold of whether LD was at a significant level. This indicated that the LD level was
high in this tested panel. The LD estimates in different subpopulations (P1, P2, and P3) were also analyzed. These results
indicate that average r2 in different subpopulations ranged from 0.0158 to 0.1018. These values are all larger than that of
the whole population, suggesting that LD level increased in subpopulations compared with the whole population. This
phenomenon might result from the close genetic relationships of the accessions in each subpopulation. To compare the
average r2 and the sample size of the three subpopulations, the results indicate that with the lower sample size, the average
r2 increased correspondingly (Figure 4). The detailed information of r2 and significant LD proportion is summarized in
Table 3. A much slower LD decay was also observed in the subpopulations of the tested panel, which may be attributed
to the relative smaller sample size and the close genetic relationships in each subpopulation.
The detailed information of LD decay (r2) for the significant pairs and the distance of LD decay (cM) was also
summarized using scatterplot. LD decay was not a simple monotonous relationship with the change of genetic distance.
However, the values of r2 increased with the distances between different SSR loci decreased. This suggested that the
probability of LD was low while the markers had a big distance. For all the tested accessions, 99% of r2 distribution for
unlinked markers determined the background of LD level, and the r2 of whole panel was 0.0986. The LD level decayed
within about 30 cM. Among the other three subpopulations, the values of r2 were 0.4168, 0.1029 and 0.0898, respectively.
Their LD decayed to the background level within about 50, 30, and 20 cM, respectively. Detailed information was
summarized in Table 4. Among the subpopulations, the slower LD decay was observed except subpopulation 3. This
phenomenon might be attributed to the relative narrow genetic background and relative small sample size.
Association between four protein components and SSR markers
The association analysis between four protein components and SSR markers was performed in both the GLM and MLM
using the software TASSEL 3.0. A total of 15 SSR marker loci were identified to have associations with the four protein-
relative traits at a significant level (P < 0.01) in both the GLM and MLM models. These 15 SSR markers are located on 10
chromosomes, except chromosome 5 and chromosome 9. RM241 was associated with two traits (globulin and glutelin)
in the GLM model in 2016 and 2017 simultaneously.
CHILEAN JOURNAL OF AGRICULTURAL RESEARCH 79(1) JANUARY-MARCH 2019 8Figure 2. Population structure of the 329 tested japonica accessions. Three different colors (red, green and blue) indicate each subpopulation, respectively. Each vertical bar represents an individual and the number of each accession was shown at the bottom of each line. The color more than 0.65 of one accession means that this color represents the subpopulation. Green represents P1; Red represents P2; Blue represents P3. The accession with each color less than 0.65 was allocated into the MIX group. Five SSR markers, RM25, RM233, RM1226, RM1337, and RM1345, were significantly associated with albumin content (P < 0.01). The number of markers associated with globulin content was also five in these four protein component traits. The five loci associated with globulin were RM223, RM243, RM253, RM1300, and RM1367. The number of markers associated with glutelin content was the lowest of these four protein traits. RM241 and RM415 were associated with glutelin at a significant level. Three markers, RM283, RM1284, and RM1306, were associated with prolamin CHILEAN JOURNAL OF AGRICULTURAL RESEARCH 79(1) JANUARY-MARCH 2019 9
Figure 3. Proportion of the pair-wise relative kinship estimates among 329 japonica
                                          accessions in the tested association panel.

content at a significant level in both the GLM and MLM models. The detailed information of identified markers is
summarized in Table 5.

Excellent alleles and carrier materials of each protein component
Fifteen SSR markers were found to be associated with four protein component traits. After the computation, five SSR
markers were identified to have excellent alleles in their corresponding traits. The detailed information of the excellent
alleles was summarized in Table 6. As shown in Table 6, five excellent alleles were identified from five SSR markers in
four traits. RM233, RM253, RM415, RM1284, and RM241 all detected one excellent allele in each marker. The allele
with 225 bp of RM415 was associated with glutelin, and it existed in the carrier materials with high glutelin content. In
contrast, the excellent allele with 255 bp of RM241 was found in carriers with relative low glutelin content. High glutelin
content would pose a heavy burden to people with kidney disease or diabetes. However, healthy people need rice with
high glutelin content to increase their protein absorbance. These two markers provide different choices for various people
in the field of molecular breeding in the future.

                                                     DISCUSSION

Phenotypic diversity in the japonica association panel
329 japonica accessions were screened out after the phenotypic measurement because they had relative better phenotypic
diversity to compare with other accessions. The 329 accessions that were screened contained the lowest and the highest
protein component in japonica rice in the assorted geographic regions. The geographic distributions of accessions and the
proper accession selections resulted in this consequence and in phenotypic diversity.

Genetic diversity in the japonica association panel
The successful association study is dependent on a proper panel size and the abundant diversity of phenotypes and
genotypes. In this study, the association panel was constructed by the 329 selected accessions, which were cultivated with
wide geographic distributions. All the accessions were elite lines with better protein experimental phenotypes from China,
DPRK, Korea, Japan, Russia, and France. The allele number of different SSR markers ranged from 2 to 9, with an average
of 5.49. In comparison with the results of a previous study (Xu et al., 2005), this value is obviously lower than 11.9 alleles
with the range from 2 to 34 that was previously reported. However, we showed higher levels of polymorphism compared
with other studies (Jin et al., 2010; Zhang et al., 2011). The lowest estimate of gene diversity was 0.0276, and the highest
was 0.8645, with an average value of 0.5919. This average gene diversity was higher than those reported in other studies.
Agrama and Eizenga (2008) estimated the gene diversity of US rice collection with an average value of 0.43. Thomson
et al. (2007) found that the average value of gene diversity was 0.46 in the improved indica rice varieties. The PIC values
were also estimated for the japonica accessions in this study, and the PIC range was from 0.0288 to 0.8766. The average
value of PIC was 0.5473. This value was higher than those reported by other researchers but also lower than those in other
studies. Jin et al. (2010) estimated the PIC values of a collection of 416 accessions containing landraces, cultivars and
breeding lines. The average PIC value was 0.4214, and it was lower than that in this study. Cui et al. (2013) estimated the
PIC values of 347 improved japonica rice varieties in former studies and found that the average PIC value was 0.3137.

CHILEAN JOURNAL OF AGRICULTURAL RESEARCH 79(1) JANUARY-MARCH 2019                                                           10
Figure 4. Scatterplot of linkage disequilibrium decay with genetic distance in whole
tested population and each subpopulation.
r2: Correlation coefficient.
CHILEAN JOURNAL OF AGRICULTURAL RESEARCH 79(1) JANUARY-MARCH 2019 11Table 3. Linkage disequilibrium (LD) in the whole panel and subpopulations at
the whole genome level.
Subpopulations P1 P2 P3 The whole panel
r2 0.1018 0.0256 0.0158 0.0109
Proportion of significant LD 20.13 15.68 12.66 41.35
Subgroups P1, P2, and P3 were classified based on the results of STRUCTURE analysis.
r2: Correlation coefficient.
Significant threshold is set to P < 0.01.
Table 4. Values of r2 and genetic distance in the whole panel and
subpopulations.
Nr of accessions in each Genetic
Subgroups subgroup r2 distance (cM)
P1 29 0.4168 50
P2 81 0.1029 30
P3 147 0.0898 20
Whole panel 329 (including MIX) 0.0986 30
r2: Correlation coefficient.
It was also lower than the value found in this study. Xu et al. (2005) used 236 rice materials to find that the average
PIC value was 0.74 in the tested panel, which is much higher than that observed in this study. The difference in genetic
diversity depended on many factors, such as the panel size (the number of accessions in the association population), the
selection of germplasm source for the population, the number of SSR markers and the repeat type of the SSR markers.
A larger panel size, the proper germplasm selection and more SSR markers should increase the genetic diversity in
the constructed population. The relative higher genetic diversity in this study suggests that more phenotypic variation
could strengthen the detection power. This result indicates that these alleles were more suitable to association analysis
in this study.
Population structure of the association panel
Population structure analysis is the main premise and basis in the process of association mapping because using population
structure as a covariant can reduce the false association between the phenotypes and the genotypes. Many previous studies
have focused on the genetic structure in association mapping in crop studies. Tran et al. (2014) classified Asian rice
cultivars into seven subpopulations, and the cultivars were mainly from China. Garris et al. (2005) divided the population
into five major groups from 234 rice accessions. The diverse sample included aromatic, aus, indica, temperate japonica
and tropical japonica. Nachimuthu et al. (2015) selected 192 rice germplasm lines to conduct population structure analysis
only, and the 192 rice germplasm lines were classified into two subpopulations. Mishra et al. (2016) collected 299 wild
rice accessions to perform candidate-gene association, and the whole population could be divided into three major groups.
In this study, all 329 japonica accessions could be classified into three subpopulations, and each subpopulation was
marked as P1, P2, and P3. A phenomenon was observed that most of the japonica accessions from closed geographic
regions were classified into the same subpopulation. It might be because they had relative closer genetic relationships in
close geographic regions. However, a few accessions did not follow the above trend. Their geographic regions were not
consistent with their allocated subpopulations. This might due to the intercrossing and introgressing of the accessions
from different ancestries over the course of their long breeding history. It warrants mentioning that the accessions from
Heilongjiang Province and Jilin Province of China were distributed in three subpopulations. This suggests that the
backgrounds of both regions may experience germplasm exchange in both regions or perhaps share a long breeding
history with other geographic regions.
Linkage disequilibrium of the association panel
The LD extent of a natural population could decide mapping resolution and required marker density in an association
mapping study. The average r2 of LD in this study was 0.0109. This value was lower than those in other previous
experiments (Jin et al., 2010; Li et al., 2011), perhaps because of the genetic diversity of the different rice materials in the
CHILEAN JOURNAL OF AGRICULTURAL RESEARCH 79(1) JANUARY-MARCH 2019 12Table 5. The detected simple sequence repeats (SSR) markers associated significantly
with four protein traits (albumin, globulin, glutelin, prolamin) in 2016 and 2017.
2016 2017
GLM MLM GLM MLM
Trait Marker Chromosome P value r2/% P value r2/%
Albumin RM25 8 7.18E-09 2.39E-06 6.19E-04 2.42E-06
12.64 11.53 11.36 10.36
RM233 2 0.00163 0.00301 0.00246 0.00325
3.87 4.13 4.54 5.02
RM1226 12 1.42E-04 7.49E-04 1.32E-04 7.12E-04
4.43 4.27 5.38 5.16
RM1337 12 0.00148 0.00148 0.00169 0.00188
6.22 7.76 5.99 5.57
RM1345 8 4.55E-04 0.00843 4.59E-04 0.00811
5.93 4.86 6.23 4.23
Globulin RM223 8 4.09E-04 0.00655 4.34E-04 0.00673
6.25 5.48 6.57 5.36
RM241 4 0.00773 0.00816
4.98 4.77
RM243 1 1.34E-04 6.97E-04 1.34E-04 6.75E-05
6.79 6.21 6.79 6.85
RM253 6 0.00349 0.00462 0.00358 0.00572
5.50 5.72 5.46 5.45
RM525 2 0.00630 0.00652
5.54 5.43
RM1300 12 0.00211 0.00241 0.00169 0.00189
5.33 5.52 6.79 6.18
RM1367 2 1.68E-05 3.75E-05 1.34E-05 3.75E-05
10.41 10.44 10.36 10.44
Glutelin RM25 8 0.00922 0.00875
4.45 4.98
RM241 4 0.00419 0.00779 0.00402 0.00898
5.30 4.99 5.88 4.66
RM254 11 0.00774 0.00674
4.96 6.02
RM415 12 0.00288 0.00688 0.00196 0.00714
6.09 5.71 7.36 5.43
RM518 4 0.00292 0.00345
5.51 5.08
Prolamin RM237 1 0.00832 0.00598
3.81 5.71
RM246 1 0.00268 0.00372
4.56 4.21
RM283 1 0.00723 0.00578 0.00766 0.00578
4.68 5.04 4.58 5.04
RM1284 3 6.49E-04 0.00751 6.45E-04 0.00541
4.85 4.76 5.26 7.22
RM1306 7 0.00169 0.00872 0.00186 0.00855
6.93 5.25 6.36 5.37
RM1375 10 0.00693 0.00686
5.16 5.66
GLM: General linear model; MLM: mixed linear model.
distinctive natural populations. For all the accessions in this test, the 99% of r2 distribution for unlinked markers which
determined the background LD level was 0.0986, and the distance of LD decay in this study was about 30cM. The results
of some other studies using SSR markers to detect the distance of LD decayed were at 20 -50 cM in rice (Jin et al., 2010;
Li et al., 2011). These reports are consistent with our results. However, in comparison with SSR markers, using single
nucleotide polymorphism (SNP) markers to detect LD decay indicated that the LD decay was at 1 cM or less in rice (Garris
et al., 2003; Mather et al., 2007). For the approximate 389 Mb rice genome, 154 SSR markers could cover the genome
with a density of about 10 cM (1 cM equals to 250 kb across the rice genome). This provided a reasonable resolution for
association analysis in this study. Different studies showed different results of LD decay. These differences might occur in
CHILEAN JOURNAL OF AGRICULTURAL RESEARCH 79(1) JANUARY-MARCH 2019 13Table 6. Favorable alleles and corresponding carriers related to four protein components.
Nr of
Trait Marker Chromosome Allele/bp carriers Top five carrier materials of each trait
Albumin RM233 2 180 155 Liao Xing 6, Ji Jing 502, Zao Feng, Kong Yu 131, Ji Jing 63
Globulin RM253 6 165 55 Jiu Dao 6, Shuang Feng 8, He Jiang 22, Hong Mao Dao Zi, Ping Rang 10
Glutelin RM415 12 225 57 Ken Dao 8, Long Jing 20, X1, (high) Long Jing 3, Mu Dan Jiang 29
Prolamin RM1284 3 185 60 Miao Miao Xi Yuan, Wu Ming Zhu, Lu Yu 132-1, Lu Wei Dao, Dang Di Bei Hai Dao
Glutelin RM241 4 255 56 Qiu Guang, Lu Ao Xiao Ding, Song Liao 2, (low) Wu You Dao 1, Pu Xuan 18
a variety of experimental situations, such as using different types of molecular markers and different accessions selected
in the experiment. While the same type of molecular marker was used to detect LD decay, selection of different markers
in the same molecular marker type and a different number of markers also affected final results of LD decay.
Population structure was an important factor influencing the LD estimate (Flint-Garcia et al., 2003). In this study,
the whole population was divided into three subpopulations, and this condition was taken into consideration in the LD
estimate. To compare the LD estimate of the whole population, the LD extent in each subpopulation was higher than
that of the whole population except subpopulation 3. The detailed information of LD level in the whole population and
each subpopulation is summarized in Table 3. This phenomenon indicated that the LD level decreased as population size
increased. Comparing population size and average r2 of each subpopulation also indicates that the average r2 decreased
with population size increased. These results all suggest that LD level was partially affected by population size and the
concrete accessions selected in the population. Because of the different LD values in the diverse subgroups that were
observed in this study, different marker densities would be required of varied population sizes and different subgroups
constructed by unique accessions in other association analysis.
Comparison of QTLs for protein content with previous studies
A comparison was undertaken between the microsatellite markers identified by association mapping in this study and
the protein-relative QTLs identified using linkage mapping in previous studies. Zhang et al. (2009) used a recombinant
inbred line (RIL) (Zhong You Zao × Feng Jin) to identify six QTLs that control protein content. These QTLs located
on chromosomes 3, 6, 7, 8, and 11. The locus RM253 on chromosome 6 located within the region of qPc-6. The locus
RM223 on chromosome 8 located in the adjacent region of qPc-8-2 (Zhang et al., 2009). Yu et al. (2006) identified five
protein content QTLs by constructing an RIL using Xie Qing Zao B × Mi Yang 46. RM241 is contained within the region
of qPc-4, and RM1375 occurs within the region of qPc-10 (Yu et al., 2006). RM233 is on chromosome 2, located within
the bpc2(mpc2) region (Zhong et al., 2007). In his study, bpc2(mpc2) was the QTL controlling both protein content of
brown rice and milled rice simultaneously. RM243 on chromosome 1 located in the region of qMRPC1.2, and it was
found to control the protein content of milled rice (Yang et al., 2012). These six SSR markers, which were detected in
different types of populations and various environments, could be regarded as significant and useful markers controlling
the protein content in rice. The remaining markers identified to be associated with target traits in this study were detected
for the first time and might be novel markers associated with protein content. Furthermore, the SSR markers that located
in the regions of previously identified QTL intervals for protein content not only validated the accuracy of QTLs but
also provided more adjacent linked markers. These identified SSR markers will be significant choices for rice breeding
programs in the future. Additionally, the excellent allele of each associated marker and corresponding carrier materials
will also provide proper parental combinations in specific directions of rice breeding.
CONCLUSIONS
Most of previous studies have focused on the brown rice total protein content and milled rice total protein content.
Few previous studies have concentrated on the four protein component traits. These four protein components
(glutelin, prolamin, albumin, and globulin) occupied different proportions in rice. The results of our association
analysis could provide opportunities to regulate the different protein component proportions in the process of rice
breeding. Because few studies have focused on the association of rice protein-relative traits and corresponding
simple sequence repeats (SSR) and single nucleotide polymorphism (SNP) markers, all the detected SSR markers
CHILEAN JOURNAL OF AGRICULTURAL RESEARCH 79(1) JANUARY-MARCH 2019 14in this study were identified for the first time via association mapping analysis. Due to 845 allele loci of this study
showing a relative low coverage of the rice genome, further research should be undertaken to obtain more accurate
mapping loci related to the four protein component traits in rice, including genome-wide association study (GWAS)
utilizing SSR markers or even SNP markers.
ACKNOWLEDGEMENTS
This work was supported by National Key R&D Program of China (2017YFD0300501) and the first-class discipline team
of Northeast Agricultural University, “Storage, transportation and processing of forest fruits and vegetables”. The authors
Wentao Zhang and Xiuling Zhang contributed equally to this work and should be regarded as co-first authors.
REFERENCES
Agrama, H.A., and Eizenga, G.C. 2008. Molecular diversity and genomewide linkage disequilibrium patterns in a worldwide
collection of Oryza sativa and its wild relatives. Euphytica 160:339-355.
Chen, T., Tian, M.X., Zhang, Y.D., Zhu, Z., Zhao, L., Zhao, Q.Y., et al. 2010. Development of simple functional markers for
lower glutelin content gene 1 (Lgc1) in rice (Oryza sativa). Rice Science 17(3):173-178.
Chung, O.K., and Pomerantz, Y. 2000. Cereal processing. p. 243-308. In Nakai, S., and Modler, H.W. (eds.) Food proteins
proceeding applications. Wiley-VCH, New York, USA.
Cui, D., Xu, C.Y., Tang, C.F., Yang, C.G., Yu, T.Q., Xin, X.A., et al. 2013. Genetic structure and association mapping of cold
tolerance in improved japonica rice germplasm at the booting stage. Euphytica 193:369-382.
Doyle, J.J. 1990. Isolation of plant DNA from fresh tissue. Focus 12:13-15.
Earl, D.A. 2012. STRUCTURE HARVESTER: a website and program for visualizing STRUCTURE output and implementing
the Evanno method. Conservation Genetics Resources 4(2):1877-7252.
Evanno, G., Regnaut, S., and Goudet, J. 2005. Detecting the number of clusters of individuals using the software STRUCTURE:
a simulation study. Molecular Ecology 14:2611-2620.
Flint-Garcia, S.A., Thornsberry, J.M., and Buckler, E.S. 2003. Structure of linkage disequilibrium in plants. Annual Review of
Plant Biology 54:357-74.
Garris, A.J., McCouch, S.R., and Kresovich, S. 2003. Population structure and its effects on haplotype diversity and linkage
disequilibrium surrounding the xa5 locus of rice (Oryza sativa L.) Genetics 165:759-769.
Garris, A.J., Tai, T.H., Coburn, J., Kresovich, S., and McCouch, S.R. 2005. Genetic structure and diversity in Oryza sativa L.
Genetics 169:1631-1638.
Jia, L.M., Yan, W.G., Zhu, C.S., Agrama, H.A., Jackson, A., Yeater, K., et al. 2012. Allelic analysis of sheath blight resistance
with association mapping in rice. PLoS ONE 7:e32703.
Jin, L., Lu, Y., Xiao, P., Sun, M., Corke, H., and Bao, J.S. 2010. Genetic diversity and population structure of a diverse set of
rice germplasm for association mapping. Theoretical Applied Genetics 121:475-487.
Juliano, B.O. 1985. Rice. Journal of Plant Foods 6:129-145.
Lasztity, R. 1984. The chemistry of cereal proteins. 216 p. CRC Press, Boca Raton, Florida, USA.
Li, X.B., Yan, W.G., Agrama, H., Jia, L.M., Shen, X.H., Jackson, A., et al. 2011. Mapping QTLs for improving grain yield using
the USDA rice mini-core collection. Planta 234:347-361.
Lu, L.S., and Xu, S.W. 1996. Chinese food demand and countermeasure in 2000. Food and Nutrition in China 2:20-23.
Manicacci, D., Camus-Kulandaivelu, L., Fourmann, M., Arar, C., Barrault, S., Rousselet, A., et al. 2009. Epistatic interactions
between Opaque2 transcriptional activator and its target gene CyPPDK1 control kernel trait variation in maize. Plant
Physiology 150(1):506-520.
Mather, K.A., Caicedo, A.L., Polato, N.R., Olsen, K.M., McCouch, S., and Purugganan, M.D. 2007. The extent of linkage
disequilibrium in rice (Oryza sativa L.) Genetics 177:2223-2232.
Mishra, S., Singh, B., Panda, K., Singh, B.P., Singh, N., Misra, P., et al. 2016. Association of SNP haplotypes of HKT family
genes with salt tolerance in Indian wild rice germplasm. Rice 9:15.
Nachimuthu, V.V., Muthurajan, R., Duraialaguraja, S., Sivakami, R., Pandian, B.A., Ponniah, G., et al. 2015. Analysis of
population structure and genetic diversity in rice germplasm using SSR markers: An initiative towards association mapping
of agronomic traits in Oryza sativa. Rice 8:30.
Niu, Y., Xu, Y., Liu, X.F., Yang, S.X., Wei, S.P., Xie, F.T., et al. 2013. Association mapping for seed size and shape traits in
soybean cultivars. Molecular Breeding 31:785-794.
Pascual, L., Albert, E., Sauvage, C., Duangjit, J., Bitton, B.F., Desplat, N., et al. 2016. Dissecting quantitative trait variation in
the resequencing era: complementarity of bi-parental, multi-parental and association panels. Plant Science 242:120-130.
CHILEAN JOURNAL OF AGRICULTURAL RESEARCH 79(1) JANUARY-MARCH 2019 15Shewry, P.R., and Halford, N.G. 2002. Cereal seed storage proteins, structures, properties and role in grain utilization. Journal
of Experimental Botany 53:947-958.
Taiji, K., Masayuki, P.Y., Satoru, M.T., Hiroshi, Y., and Fumio, T. 2009. Compensation and interaction between RISBZ1 and
RPBF during grain filling in rice. The Plant Journal 59:908-920.
Thomson, M.J., Septiningsih, E.M., Suwardjo, F., Santoso, T.J., Silitonga, T.S., and McCouch, S.R. 2007. Genetic diversity
analysis of traditional and improved Indonesian rice (Oryza sativa L.) germplasm using microsatellite markers. Theoretical
Applied Genetics 114:559-568.
Tran, T.T.G., Dang, X.J., Liu, Q.M., Zhao, K.M., Wang, H., and Hong, D.L. 2014. Association analysis of rice grain traits with
SSR markers. Chinese Journal of Rice Science 28(3):243-257.
Vanniarajan, C., Vinod, K.K., and Pereira, A. 2012. Molecular evaluation of genetic diversity and association studies in rice
(Oryza sativa L.) Journal of Genetics 91:1-11.
Wang, Y.P., Tang, L.H., and Fang, X.W. 2008. Screening of natural rice low glutelin content mutant. Journal of Jinling Institute
of Technology 24(1):45-47.
Wu, J.H., Feng, F.J., Lian, X.M., Teng, X.Y., Wei, H.B., Yu, H.H., et al. 2015. Genome-wide association study (GWAS) of
mesocotyl elongation based on re-sequencing approach in rice. BMC Plant Biology 15:218.
Xu, Y.B., Beachell, H., and McCouch, S.R. 2005. A marker-based approach to broadening the genetic base of rice in the USA.
Crop Science 44:1947-1959.
Yan. J., Shah, T., Warburton, M.L., Buckler, E.S., McMullen, M.D., and Crouch, J. 2009. Genetic characterization and linkage
disequilibrium estimation of a global maize collection using SNP markers. PLoS ONE 4:e8451.
Yang, Y.C., Ni, D.H., Song, F.S., Li, L., Feng, G., Li, Z.F., et al. 2012. Identification of QTL for protein content in brown and
milled rice in two environments. Chinese Journal of Rice Science 26(3):351-355.
Yu, J., and Buckler, E.S. 2006. Genetic association mapping and genome organization of maize. Current Opinion in Biotechnology
17:155-160.
Yu, Y.H., Zhu, Z.W., Fan, Y.Y., Duan, B.W., and Zhuang, J.Y. 2006. QTL mapping of brown rice protein content and lipid
content in a recombinant inbred population of rice. Acta Agronomica Sinica 32(11):1712-1716.
Zhang, P., Li, J., and Li, X. 2011. Population structure and genetic diversity in a rice core collection (Oryza sativa L.) investigated
with SSR markers. PLoS ONE 6:e27565.
Zhang, T., Zheng, J.K., Wu, X.J., Jiang, K.F., Yang, Q.H., Chen, W.F., et al. 2009. QTL mapping of brown rice protein content
in a RIL population of rice. Molecular Plant Breeding 7(1):67-72.
Zhong, M., Wang, L.Q., Luo, L.J., and He, Y.Q. 2007. Comparison of quantitative trait loci controlling the protein content of
brown and milled rice using a recombinant inbred line population. Molecular Plant Breeding 5(5):631-638.
CHILEAN JOURNAL OF AGRICULTURAL RESEARCH 79(1) JANUARY-MARCH 2019 16You can also read