Prediction of Evaporation Values in starting-recipes of Gasoline-Ethanol Blends
←
→
Page content transcription
If your browser does not render page correctly, please read the page content below

Prediction of Evaporation Values
in starting-recipes of Gasoline-
Ethanol Blends
Master’s thesis in Innovative and Sustainable Chemical Engineering

PONTUS JOHANSSON

DEPARTMENT OF CHEMISTRYAND CHEMICAL ENGINEERING
CHALMERS UNIVERSITY OF TECHNOLOGY
Gothenburg, Sweden 2021
www.chalmers.se
Prediction of Evaporation Values in Starting-Recipes of Gasoline-
Ethanol Blends

© Pontus Johansson, 2021

Supervisor: Martin Nilsson, Gothenburg, Preem
Examiner: Derek Creaser, Department of Chemistry and Chemical Engineering

Department of Chemistry and Chemical Engineering

Chalmers University of Technology
SE-412 96 Gothenburg
Telephone +46 31 772 1000
DEPARTMENT OF CHEMISTRY AND
CHEMICAL ENGINERING
CHALMERS UNIVERSITY OF TECHNOLOGY
Gothenburg, Sweden 2021
www.chalmers.se
Prediction of Evaporation Values in Starting-Recipes of Gasoline-Ethanol Blends
Pontus Johansson
Department of Chemistry and Chemical Engineering
Chalmers University of Technology

ABSTRACT
This thesis was carried out at Preem Refinery, Gothenburg, where gasoline-ethanol
blends are regularly produced at 5-10% ethanol content. Ethanol produced from
renewable sources reduce the environmental impact of gasoline. This thesis will study the
effect that ethanol, up to 25% volumetric content, has on the distillation curves of gasoline-
ethanol blends. Gasoline and ethanol form azeotropes. Azeotrope formations produce
vapor-liquid equilibrium states, which cause distillation parameters, evaporation and
temperature, to become difficult to predict. By analyzing different gasoline-ethanol blends,
equations that can predict the influence on the distillation curves were obtained for
evaporation values at 70 ˚C and 100 ˚C. From the study it was also concluded that ethanol
did not influence evaporation at 150˚C. The equations were divided to accommodate for
today’s regular production of 5-10% ethanol content, and a future scenario where gasoline
contains 15-25% ethanol. Dividing the 0-25% ethanol content in two intervals also
simplified the equations by allowing them to be linear.

Keywords: Ethanol, Distillation, Azeotrope formation, Gasoline

 I
Table of content
1. Introduction 1
1.1 Background ........................................................................................................................... 1
1.2 Purpose .................................................................................................................................. 1
2. Theory 3
2.1 Ethanol ................................................................................................................................... 3
 2.1.1 Properties of ethanol .............................................................................................................................3
 2.1.2 Azeotrope formation ..............................................................................................................................3
 2.1.3 Ethanol production from biomass ........................................................................................................4
 2.1.4 Green-house gas emission ..................................................................................................................6
2.2 Gasoline compounds ........................................................................................................... 6
 2.2.1 Reformate ...............................................................................................................................................7
 2.2.2 Isomerate ................................................................................................................................................7
 2.2.3 SRB and SRG ........................................................................................................................................8
 2.2.4 Polymerate .............................................................................................................................................9
 2.2.5 Butane .....................................................................................................................................................9
2.3 BOB Recipes ....................................................................................................................... 10
2.4 Method ................................................................................................................................. 11
 2.4.1 Mixing of the BOB................................................................................................................................11
 2.4.2 Mixing the Gasoline-Ethanol-Blends .................................................................................................12
 2.4.3 Distillation .............................................................................................................................................12
2.5 Instruments .......................................................................................................................... 16
 2.5.1 DMA 4500M .........................................................................................................................................16
 2.5.2 Reformulyzer ........................................................................................................................................16
 2.5.3 OptiDist: Atmospheric Distillation ......................................................................................................17
2.6 Repeatability ........................................................................................................................ 18
3 Results and Discussion 20
3.1 Comparison of blends ........................................................................................................ 20
3.2 The influence of ethanol .................................................................................................... 22
3.3 Results for EV70 ................................................................................................................. 24
3.4 Results for EV100............................................................................................................... 26
3.5 Summarized results............................................................................................................ 29
Conclusion 30
Abbreviations 31
Appendix A 32
References 34

 II
1. Introduction
Improving gasoline to reduce emissions could have a global effect in reducing green-
house gas emissions. Ethanol from renewable sources effectively reduces emissions
when mixed with gasoline, but mixing ethanol and gasoline also has its drawbacks. In this
thesis the change in evaporation values from adding ethanol to gasoline has been
evaluated. Evaporation values are only a few of many parameters that are used to define
the quality of gasoline. According to ISO: 228:2012+A1 evaporation values at 70 ˚C, 100
˚C and 150 ˚C was analyzed, which lays the foundation for this study.

1.1 Background
Preem is the largest producers of gasoline in Sweden with two refineries, one in
Gothenburg and one in Lysekil [1]. “Reduction quota” is a government implemented
greenhouse gas reduction mandate for gasoline and diesel in Sweden. By 2021, 30th
June, gasoline will have an increase from 4,2% to 6% of renewable content. Which means
that an increased part of the gasoline needs to originate from renewable sources to reduce
the climate impact [2]. A promising substance for the substitution is ethanol, as it can be
produced from biomass and can successfully combine with gasoline. When introducing
ethanol an azeotropic formation between the ethanol and gasoline compounds will occur,
leading to a change in the distillation curve for gasoline. This change in the distillation
causes gasoline quality prediction to become difficult while creating gasoline starting
recipes. Starting recipes are used to calculate the amount of each compound, that is used
when producing gasoline, by using the desired end-quality.

1.2 Purpose
The purpose of this thesis is to study the effects renewable ethanol content has on the
distillation curve of gasoline. Specifically, how the distillation curves will allow for a more
accurate calculation of evaporation values, EV70/EV100/EV150 in the starting recipes of
gasoline. The EV- parameters represent the amount of gasoline that has been evaporated
during distillation at 70 ˚C, 100 ˚C and 150 ˚C, respectively. Gasoline contains several
components that all need to be finely tuned for economic, environmental, and legal
reasons. The starting recipes uses a “backwards” calculation, meaning that the gasoline
starting components are calculated based on what properties the desired gasoline should

 1
have. In this study, gasoline with 0-25% ethanol content has been analyzed, which will be
named E0-E25. The aim is to produce equations that will allow for starting recipes to
accurately predict the evaporation values that the Gasoline-ethanol-blend, GEB, will have.
E25 is not used in Sweden today, but with increasing reduction duties higher content of
ethanol will most likely become more common in the future.

When blending ethanol and gasoline, it forms azeotropes with other carbohydrates in the
gasoline, which will cause the evaporation values to deviate from the linear conjunction
that non-ethanol gasoline exhibits [3]. Hence, the produced GEB, will not match the
desired evaporation values calculated from the starting recipes, when increased amount
of ethanol is used. Common gasoline in Sweden contains 5 Vol% ethanol, E5, the effect
of the ethanol at 5% is small, but noticeable. Increasing the amount of ethanol to 10%, or
even 25%, causes increasing problems with the EV’s starting recipes. To accommodate
for the broad spectrum of different gasolines that Preem produces, several starting
components for gasoline were used.

 2
2. Theory
This section covers the individual components that were used to make the gasoline,
including the ethanol, and the interaction that likely occurs as ethanol is mixed with the
gasoline.

2.1 Ethanol
Ethanol, CH3-CH2-OH, is an oxygenate that, compared to regular gasoline compounds,
contains an oxygen molecule. Adding ethanol to gasoline has several advantages,
especially the reduced fossil fuel dependence as ethanol can be produced from biomass.
A drawback however is the compatibility with car engines as high concentrations of
ethanol increase corrosion that the fuel has on engine parts. Higher contents of ethanol
such as E85, that contains 85% ethanol, and 15% gasoline is still a viable fuel option, but
only for specialized vehicles. The 15% gasoline helps reduce the corrosion and increase
starting efficiency in cold weather [4].

2.1.1 Properties of ethanol
The oxygen in ethanol allows for higher combustion efficiency, as well as higher
evaporation enthalpy compared to gasoline [5]. A big difference between gasoline and
ethanol is that ethanol is miscible with water. The solubility of water, with its dielectric and
conductive properties, increases the risk of galvanic corrosion of fuel on engine parts.
Dielectric and conductive properties are also influenced by the ethanol in a way that will
increase the risk of galvanic corrosion [6]. Ethanol has a higher octane number than that
of regular gasoline, as well as higher heat of vaporization [7]. Ignition quality, a measure
of flammability of gasoline, is closely related to the octane value. Ethanol is what is called
an octane booster, as blending ethanol into gasoline will increase the octane value and
thus have the effect of improved engine efficiency. Higher power output is related to higher
temperature and pressure inside the engine. Higher octane value allows the fuel to be
further compressed before ignition, this means higher temperature and pressure can be
achieved before ignition. Higher octane value will increase the resistance to auto-ignition
and knock [8].

2.1.2 Azeotrope formation
Azeotropes are vapor-liquid equilibrium states, when in this state the composition between
the two phases are the same. In an ideal mixture, intermolecular interaction between non-

 3
similar molecules is the same as between same molecules, the vapor pressure ( ) follows
Raoult’s law:

 = 1 1 ( ) + 2 2 ( ) Equation 1

Raoult’s law applies to a binary system, hence only two substances 1 and 2 are included.
An azeotrope occurs when the mixture strongly deviates from Raoult’s law, which results
in a minimum boiling azeotrope if the deviation is positive, or a maximum if the deviation
is negative. Evaporation of an azeotropic mixture will cause no change in the composition
of the fluid which makes separation difficult. Azeotropes are more likely to form between
substances with similar boiling points [9] [10].
An example of a binary azeotrope, which forms a minimum boiling azeotrope, is that of a
mixture of ethanol and water. Ethanol boils at 78.4 ˚C and water at 100 ˚C, a mixture of
the two will have a boiling point at 78.2 ˚C with a final composition of 96% V/V ethanol
and 4% V/V water, from which no further separation is possible through normal distillation.
It is also possible to form ternary mixtures, including three different compounds, such as
an ethanol-benzene-water azeotrope. Benzene has a boiling point of 80.1˚C while the
ternary mixture will have a boiling point of 64.9 ˚C at atmospheric pressure [11].

2.1.3 Ethanol production from biomass
There are three distinct feedstocks for producing ethanol. They are divided into the first-,
second- and third generation. All three generations use fermentation of sugars. The basics
of fermentation is that yeast, such as Saccharomyces cerevisiae, is kept in an anaerobic
environment under controlled temperature. The yeast can then convert monomer sugars
to ethanol and carbon dioxide. For the best yield, due to yeast selectivity, the sugars
should be hexoses, e.g fermentation of glucose 6 12 6 in Equation 2. Alternatively,
bacterial- or fungi fermentation can be used, but yeast is the dominating industrial method
for producing ethanol as it has the highest yield.

 6 12 6 → 2 2 5 + 2 2 Equation 2

With the exception of sugar cane, most biomass does not contain large quantities of
monomer sugars, instead they contain natural polymers such as starch, cellulose and
hemicellulose.

 4
Hydrolysis is required to reduce the polymers into fermentable sugars. As an example
cellulose hydrolysis is shown in Equation 3. Hydrolysis is typically performed using
enzymes, or acid to produce sugar monomers, preferably glucose. Enzymatic hydrolysis,
also known as saccharification, is the most common practice. Hydrolysis of cellulose and
starch will yield glucose while hydrolysis of hemicellulose yields a mixture of pentoses and
hexoses, glucose being a hexose. This is because hemicellulose is a slightly more
complex polymer compared to starch and cellulose, and as fermentation works best with
hexoses the yield of ethanol will be less from feedstock with high hemicellulose content.

 ( 6 10 5 ) + 2 → 6 12 6 Equation 3

First-generation production of ethanol uses simple sugars from feedstocks like corn,
wheat, oats and barley as they all contain a high content of starch. There is also the option
of sugar cane, the second most common feedstock for producing ethanol. Sugarcane
contains 12-17% sugars, specifically glucose, making it suitable for ethanol production.
The first generation can produce ethanol by utilizing hydrolysis and fermentation [5].

Second-generation uses lignocellulosic biomass. Hydrolysis and fermentation are both
used for second-generation, but the lignin further increases the complexity of the
polymeric structure. The complexity requires lignocellulosic biomass to have additional
pretreatment to separate the polymers. Lignocellulosic feedstock includes agricultural
waste, different species of wood and many other. Waste from the first-generation
feedstock, which contains lignin, can be used in the second-generation. Such is the case
of sugarcane bagasse, a solid residue with high lignin content. Integrating second-
generation plants with first-generation can thus increase the yield of ethanol.
Before hydrolysis the cellulose, hemicellulose and the lignin need to be separated. The
next step is saccharification of the pretreated material which will liberate the fermentable
sugars. The sugars can then be fermented to produce ethanol. There are currently several
different ways to carry out fermentation, all depending on which lignocellulosic material
that is being converted. Agricultural waste as a feedstock uses what is called a Physical-
Chemical pretreatment. Pretreatments differ greatly depending on the feedstock as
Physical-Chemical pretreatment works poorly for softwoods, but well for hardwoods. The
Chemical pretreatment can use either acid or alkaline solutions together with oxidizing
agents to separate the carbon polymers from almost any feedstock depending on which
solution is used. Both the Chemical and the Physical-Chemical treatments are cost- and

 5
energy intensive. A less common but more environmentally friendly method is the
Biological pretreatment. The Biological pretreatment use microorganisms called white-,
brown-, and soft-rot fungi. This method is superior from an environmental perspective
while also requiring less energy, but hydrolysis is very slow compared to the others [5]
[12].

Hydrolysis breaks down the cellulose to monomeric sugars, as shown in Equation 4.

 ( 6 10 5 ) + 2 → 6 10 6 Equation 4

Third generation use nonfood crops, such as micro- and macroalgae. Algae can inhabit
diverse ecological habitats with the benefit of not competing with food crops. Microalgae
has rapid growth, which require large amounts of carbon dioxide. That leaves the
possibility of funneling carbon dioxide from power plants or refineries to both help the
growth of the algae and reduce carbon dioxide emission. The procedure for producing
ethanol from algae is similar to ethanol produced from agricultural waste, it requires
pretreatment, enzymatic hydrolysis and fermentation from yeast [5].

2.1.4 Green-house gas emission
In a life cycle assessment, LCA, of bioethanol produced from sugarcane compared to pure
gasoline a clear reduction in green-house gas emission, GHG, was found. When
completely replacing gasoline with ethanol an 81% reduction in GHG emissions was
obtained [13].
In a comprehensive study by Borrion et. al, they found that for lignocellulosic biomass
conversion to ethanol, the GHG emissions could be reduced by 4-15% for a E10 [14].
Other sources reported that an E10 could reduce the petroleum usage by 6%-6.6%, with
a 3% reduction of fossil energy and 2% reduction in GHG emissions [5].
Ozone layer depletion can be reduced by half when ethanol is used instead of gasoline.
However, ethanol from sugarcane can have a negative impact regarding acidification,
eutrophication and human ecotoxicity [13].

2.2 Gasoline components
The building blocks for gasoline differs depending on several factors such as climate,
economic value of a compound, the desired gasoline quality and environmental impact.
In the same way the composition can vary to some extent between companies and

 6
countries, so can the terminology of constituents. Components used to blend gasoline
include: Reformate, Isomerate, Straight-Run-Gasoline (SRG), Straight-Run-Benzine
(SRB), Polymerate and Butane.

2.2.1 Reformate
Reformate is often a large portion of gasoline, mainly consisting of aromatics and
branched alkanes, see Table 1 for a simplified components list. Reformate is produced by
catalytic reforming of SRB, straight-run-benzine, where naphtenes and some paraffins are
transformed into cyclic naphthenes and branched alkanes. By partial dehydrogenation
naphtenes and alkanes produce aromatic hydrocarbons which have a high octane value,
which is the reason why Reformate is the major component in gasoline [3].

Table 1. Component list shown as normalized volume percent results for Reformate from Preem. List is
simplified and may deviate from normal production at Preem.
 Carbon n-Paraffins Isoparaffins Naphtenes Aromatics

 C4 0.7 0.3
 C5 2.0 4.7 0.1
 C6 1.7 3.9 0.5 1.6
 C7 2.8 9.8 0.6 25.4
 C8 0.8 3.3 0.2 25.6
 C9 0.2 0.7 12.8
 C10 0.5
 C11
 C12+ 0.3

2.2.2 Isomerate
Isomerate is produced through an isomerization process of SRG, straight-run-Gasoline.
The isomerization process can briefly be explained as rearrangement of carbons in
alkanes or alkenes, without changing the carbon number for best yield. Isomerization of
n-pentane produces isopentane. Isomerization is performed to increase the octane value
of SRG, as isomers have a higher octane rating [15]. Isomerate does not contain any
aromatics, this is an important feature as this reduces the risk of unburned aromatics as
they are cancerogenic. The other reason for isomerization is environmental, as burning
benzene produces very high amounts of carbon dioxide. Isomerization of the benzene
ring is performed catalytically under high pressure and low temperature which saturates
the benzene into cyclo-hexane followed by a final isomerization into hexane isomers [16].

 7
Table 2. Component list shown as normalized volume percent results for Isomerate from Preem. List is
simplified and may deviate from normal production at Preem.
 Carbon n-Paraffins Isoparaffins Naphtenes
 C5 1.3 32.0 1.8
 C6 0.1 41.0 17.5
 C7 1.1 2.2
 C8 0.2 0.5 0.8
 C9 0.7

2.2.3 SRB and SRG
Before reformate goes through the octane enrichment steps, it is Straight-Run-Benzine,
so the chemical composition of the two is quite similar. Straight-Run-Gasoline is the
naphtha feed to produce isomerate. SRB and SRG is usually used in smaller quantities
as the resulting gasoline would otherwise have low octane value. Restrictions for reduced
benzene and aromatics levels in gasoline has also reduced the quantities of SRB and
SRG, making isomerization and octane enrichment a fundamental process [17].
The component list of SRB and SRG are shown in Table 3 and Table 4.

Table 3. Component list shown as normalized volume percent results for SRG from Preem. List is simplified
and may deviate from normal production at Preem.

 Carbon n-Paraffins Isoparaffins Naphtenes Aromatics

 C4 1.2
 C5 22.4 14.6 2.9
 C6 16.6 18.9 17.5 2.3
 C7 0.1 2.5 1.0
 C8

 8
Table 4. Component list shown as normalized volume percent results for SRB from Preem. List is simplified and may
deviate from normal production at Preem.

 Carbon n-Paraffins Isoparaffins Olefins Naphtenes Aromatics

 C6 0.8
 C7 8.4 6.8 18.8 3.9
 C8 6.6 8.4 15.9 5.0
 C9 11.3 9.9 1.1
 C10 0.2 1.1 1.8
 C11

2.2.4 Polymerate
Polymerate is produced through catalytical polymerization of unsaturated propylene and
butenes. The reaction is pressure and temperature sensitive while also being exothermic.
The operation is temperature controlled by recirculation and intermediate cooling.

Table 5. Component list shown as normalized volume percent results for Polymerate from Preem. List is simplified and
may deviate from normal production at Preem.

 Carbon n-Paraffins Isoparaffins Olefins Naphtenes Aromatics

 C4 7.0 5.9 0.9 -
 C5 7.4 1.3 -
 C6 1.4 0.7 0.1 -
 C7 1.9 7.9 0.8 0.2
 C8 2.8 13.6 10.7 6.6 1.0
 C9 0.1 3.3 1.8 0.9 0.4
 C10 0.1 1.6 0.5 4.1
 C11 0.1 3.5 0.2 0.6
 C12 0.4 0.2 0.6

2.2.5 Butane
Butane, or C4, is a gas in room temperature and atmospheric pressure and was therefore
kept refrigerated to enable mixing using butane in liquid form. Compared to the other
substances required to mix the gasoline, butane was the only “single substance”
component.

 9
2.3 BOB Recipes
The gasoline also referred to as BOB, before oxygenate blending, is blended prior to
adding the oxygenate, ethanol. Gasoline differs depending on season and country,
meaning that gasoline that is used during the summer is not necessarily the same as
during the winter. Typically, for what is called a “winter-blend” the vapor pressure of
gasoline is higher as that helps with cold engine start-up. Higher vapor pressure can be
achieved by adding an increased amount of butane. The recipes for the BOB:s, were
constructed by the Planning-unit at Preem. The recipes were created specifically for the
project, which means they can deviate from regular production at the two Preem
refineries. Recipes can change depending on the clients need, production pricing, sale
prices, or because of legal reasons. Polymerate is produced at the refinery in Lysekil,
while the other components that were used are produced at the site in Gothenburg. The
recipes covered production that could be carried out at both production sites, while using
components mainly from Gothenburg. See Table 6 for the contents of the different blends.
Ethanol was added to the blends without influencing the recipes as E15-E25 blends are
currently not produced on any site, so no experience existed at the time of how the
components are to be combined to make a viable BOB recipe for E15 blends.

Table 6. Recipes with their respective components excluding the ethanol.
 Recipe Reformate Isomerate SRG SRB Butane Polymerate
 1 0.50 0.40 0.10
 2 0.55 0.31 0.03 0.11
 3 0.56 0.26 0.07 0.11
 4 0.51 0.28 0.07 0.12
 5 0.52 0.28 0.09 0.11
 6 0.49 0.44 0.04 0.03
 7 0.34 0.38 0.08 0.20
 8 0.47 0.40 0.10 0.03

 10
2.4 Method
This section will cover the overall method of mixing the BOB, before-oxygenate-blending,
as well as blending the ethanol with the BOB.

2.4.1 Mixing of the BOB
All components except butane are liquid at room temperature. Butane requires cooling
below -1 ˚C to stay in liquid form at atmospheric pressure. Evaporation of butane was
avoided by cooling the components to approximately -10 ˚C before mixing. The butane
was stored in a pressurized container, shown in Figure 1, while the other samples were
kept in glass bottles with gas-secure screw caps. The container with butane was placed
in a downwards angle, as this enables evacuation from the lowest point where liquid can
build up.

Figure 1. Setup for how the container of butane was used. The lowest point was used for evacuation.

Measuring the individual components to make the BOB was done by weight. Using the
density ( ) and fraction ( ) of each component with the necessary
amount for 2 dm3 of BOB, the grams of individual components was calculated according
to Equation 5

 2 3 ∗ ∗ = Equation 5

 11
The density of the finished, mixed BOB was analyzed using the DMA 4500M to ensure
correct mixing and to calculate the amount of BOB that should be used to make the GEB:s.

2.4.2 Mixing the Gasoline-Ethanol-Blends
GEB:s were produced by mixing BOB and ethanol, ethanol is miscible with all components
in gasoline, hence BOB and ethanol easily mixed in a glass container. Five different GEB:s
were produced, by adding ethanol to BOB to achieve the following ethanol concentrations:
5, 10, 15, 20 and 25%. In total eight BOBs were created from which five GEBs were
produced from each, rendering a total of 40 different GEB:s for used as a foundation for
the analyses performed in this study.
The amount of BOB was calculated based on results from the DMA 4500M density meter.
Both the ethanol and the BOB were cooled before mixing to -10 ˚C, to minimize the
evaporation of butane contained in the BOB. The sample size of the individual GEB:s
were 250ml. The amount of BOB changed for each recipe, depending on its density with
each new blend. The amount of ethanol would not change across blends unless the
correction factor was changed, as the same batch of ethanol was used for all recipes.
The required amount of ethanol was calculated using the same procedure as for the
components in the BOB, except for the addition of the correction factor which was used
to accommodate for ethanol. The correction factor is required as the ethanol was
denatured. Equation 6 gives the amount of ethanol (g) required to make 0.25 dm3 GEB
by using the desired ethanol content (X ethanol ). Ethanol had a concentration of 92%
(0.92).
 0,25 3 ∗ ℎ ∗ ℎ
 = ℎ Equation 6
 0.92

2.4.3 Distillation
Distillation was used to study the correlation between temperature and evaporation of the
gasoline according to ASTM D86-20a and ISO:3405:2019. With the blends completed,
both the BOB and GEB could be distillated using the apparatus: OptiDist™.
The first results from the distillation that would help construct the evaporation-temperature
curves for the GEB were the curves corresponding to each BOB. The BOB served as a
baseline for how the ethanol would influence the gasoline evaporation. Running only the
BOB in the OptiDist yielded result according to Figure 2. Distillation curves are shown with
Evaporation (%) which represent the fraction of the total amount that has been evaporated
at the given temperature (˚C).

 12
Figure 2. Distillation curve of BOB from recipe 5 (B5).

The current method used at Preem to predict EV70, EV100 and EV150 did not include
the azeotropic formation between ethanol and gasoline but assumed linearity for the
evaporation values in starting recipes. Using Figure 2 as an example which does not
include any ethanol, the linearity of the BOB is strong, even with Initial-boiling-point, IBP,
and Final-Boiling-Point, FBP, included. By removing IBP and FBP stronger linearity can
be achieved, as indicated by the increased R2-value in Figure 3 compared to Figure 2.

Figure 3. Distillation curve of BOB from recipe 5. IBP and FBP removed.

IBP and FBP influence the trendline negatively while also being outside of the scope of
the study. If the values from IBP or FBP are of importance they should be extracted
individually. Hence, IBP and FBP were removed from the graphs to allow the trendline to
be as accurate as possible when the equation for EV70, EV100 and EV150 is determined.

 13
The final step to complete the gasoline blends was to determine the exact ethanol content
in the blends. The specific amount of ethanol was measured by the Refomulyzer, see
section 2.5.2. The ethanol content would deviate from the intended amount for some of
the blends. The result will, regardless of what the intended ethanol content was, be based
on the results from the Reformulyzer even if the blends are still named as E5-E25.

For each recipe, the ethanol content was 0-25% with 5% step increments. Figure 4 can
be used to compare the ethanol’s influence on evaporation

Figure 4. Recipe 5 as an example, starting with the BOB as E0.

From Figure 4 there are several aspects to consider. The influence of the ethanol does
not only shift vertically, i.e increased evaporation, but also horizontally as ethanol content
is increased. Ethanol has an evaporation temperature of 78.4 ˚C, which explains the
increase in Evaporation (%) as the evaporation temperature of ethanol is reached.
However, the increased evaporation can be noticed several degrees earlier than 78.4 ˚C.
The azeotropes formed between the ethanol and substances in the BOB enables the
gasoline to evaporate at lower temperatures. The azeotrope formation is what makes the
gasoline deviate from the linearity that non-ethanol gasoline, E0, has [9] [10] [11].

Knowing both the distillation behaviors of the BOB and the GEB:s, with their respective
ethanol contents, the equation for predicting EV70, EV100 and EV150 for the GEB:s could

 14
be constructed. Creating the equations was performed in Excel, using trendlines after
removing the temperature and evaporation of the BOB from its respective GEB. In other
words, the BOB functioned as a baseline. The results will be divided into three cases, one
case for 0-10% ethanol content, one for 15-25% and lastly the full range of 0-25%. The
blends were divided for two reasons: Firstly, Preem produces gasoline with up to 10%
ethanol on site. The second reason is due to the change in evaporation, especially for
EV70, as ethanol content is increased beyond 10%. Elaboration on the second reason
can be seen in section 3.3.

 15
2.5 Instruments
This section includes a brief description of instruments that were used, how they
functioned, what type of results that were obtained and what those results were used for.

2.5.1 DMA 4500M
The density meter was an important tool that was used multiple times while making and
controlling the blends. Only liquids can be correctly analyzed, so any gas or bubble-
formation would yield a lower density value than that of the actual result. Cooling the
samples was important to avoid butane evaporation while preparing the instrument. DMA
4500M operates at 15 ˚C, which could be a problem as the butane has a boiling point of
-1 ˚C. Due to butane being miscible with the other gasoline components, butane will stay
as liquid during the short operational time.
The theoretical density of the BOB, based on the component’s densities, was compared
to the density results obtained by the DMA 4500M. The comparison identified if there had
been any issues during mixing, for example it could be identified if the density of the
mixture did not increase with higher ethanol content, which would render re-testing or
potentially the need to completely redoing of the BOB. Ethanol has a density of 791.0
kg/dm3, as average density of the gasoline was lower, the density would increase with
higher concentrations of ethanol.

2.5.2 Reformulyzer
The AC Reformulyzer M3 is a multidimensional gas chromatographic system and is widely
used in the petroleum industry. The system uses column switching, operational time and
temperature change to separate the different fractions in the sample. One sample takes
75 minutes to run. Results can either be based on volume, molecular weight, or weight.
For the purpose of this study only volume was used [18]. The instrument was used
according to ISO:22854.
The Reformulyzer uses a sample size of 2ml, prepared in a glass vial. Internal restriction
on the laboratory required the sample to contain a maximum of 15 vol% ethanol, whereas
instrument restriction was 20%. The 15%, and higher, GEB samples were diluted to 5%
ethanol with n-Dodecane to reduce any risk of damaging the instrument. Dilution with n-
Dodecane was calculated using the density of the GEB and the n-Dodecane by assuming
the intended ethanol content had been reached. For a E15 this meant having a 3:1 ration
of n-Dodecane and ethanol to reach 5% ethanol. With the Refomulyzer being able to

 16
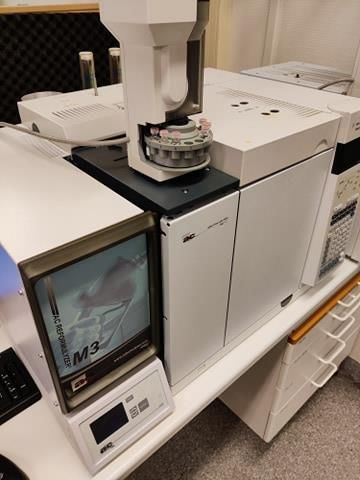
distinguish between the GEB and the n-Dodecane the instrument was able to disregard
the results from the n-Dodecane and the 3:1 ratio should not influence the ethanol content
result. Hence, the assumption of having correctly blended an E15 did not influence the
result, but ensured that the internal restriction of 15% ethanol was not exceeded.

Figure 5. AC Reformulyzer M3

2.5.3 OptiDist: Atmospheric Distillation
OptiDist, is the instrument that was used to obtain the distillation curves of the E0-E25
according to ISO:3405. On the instrument a sample group was selected according to
ISO:3405, any E0-E85 blend belongs to Sample Group 1. The only modification made to
the standard settings was adding more data points, this meant having a data point at every
2 ˚C at a chosen interval. The extra data points were selected at a region that would
correspond to the “steeper line” of the evaporation curve to gather more detailed
information about that section.

 17
Figure 6. Picure of the OptiDist

Results were obtained for evaporation levels, as percentage of the total sample, at certain
temperatures in ˚C. Together the evaporation and temperature formed a distillation-curve
from which the desired values EV70, EV100 and EV150 could be read. The distillation
curve ranged from initial-boiling point to the final-boiling point, but as mentioned before
IBP and FBP were removed.
For simplicity, all the increments of ethanol were categorized as if they had the intended
amount of ethanol. However, the equation for calculating the EV-values will use the
ethanol content acquired from the refomulyzer. Evaporation of ethanol can cause surges,
which can be described as sudden increases in evaporation rate. The OptiDist has a
unique optimizer that improves the distillation rate by avoiding surges. As a result, an even
distillation rate can be kept throughout the distillation [19] [20] [21]. To confirm that both
low- and high contents of ethanol would yield accurate results, as there was risk of
surging, a repeatability test was conducted.

2.6 Repeatability
The OptiDist was tested to ensure that repeatability was possible, and to ensure the data
was reliable as high contents of ethanol could potentially cause surges. A repeatability
test was conducted on recipe 4, using 5% and 20% ethanol content. The results are shown
in Figure 7 and Figure 8.

 18
Figure 7. The graph shows 11 runs. All runs are of the same E5 on recipe 4, not including IBP or FBP.

Figure 8. The graph shows 11 runs. All runs are of the same E20 on recipe 4, not including IBP or FBP

From the repeatability test it was concluded that both low and high contents of ethanol
would yield even results with no risk of surges.

 19
3 Results and Discussion
Results will firstly be discussed from a broad perspective, ending with summarized results
which shows the final equations.

3.1 Comparison of blends

A comparison of distillation curves, at all tested ethanol levels, is displayed in Figure 9,-
Figure 10 and the full range, 0-25% ethanol content, is displayed in Appendix A. The
overview was used to show how increased ethanol content, changes the distillation curves
due to azeotrope formation, as ethanol is incorporated into gasoline. This overview would
also indicate if any blends failed, by how the distillation curves order themselves. For
example, Blend 7, named as B7, has the lowest evaporation percentage throughout the
distillation of E0-E25. That strongly indicates that the blends have been correctly mixed
as there are no obvious deviations.

Figure 9. BOB:s with 0% ethanol, where B1-B8 represent the different blends/recipes.

Figure 10. E25 blends, 25% ethanol content. No longer linear evaporation due to azeotrope formation.

 20
By comparing evaporation values at 150 ˚C, Table 7 indicate that EV150 would not require
any modification, adding ethanol did not indicate any significant change. The maximum
difference for EV150, when compared to the BOB, is a 2% difference in evaporation value
at 25% ethanol. In comparison, the minimum difference at 25% ethanol content for EV70
and EV100 was 30.4% and 27.3% respectively. Results will henceforth focus on EV70
and EV100.

Table 7. EV150 evaporation values, in volume %, for all blends 1-8, showing marginal change.
 Ethanol B1 B2 B3 B4 B5 B6 B7 B8

 0% 95,2 94,7 94,1 94,7 94,6 94,3 92,5 95

 5% 95,4 94,9 94,4 95,1 95 94,7 92,9 95,1

 10% 95,4 95,2 94,8 95,2 95,1 94,9 93,3 94,8

 15% 95,6 95,3 95 95,4 95,4 95,4 93,6 95,3

 20% 95,8 95,6 95,5 95,9 95,9 95,4 93,8 95,3

 25% 95,90 96,10 95,90 96,10 96,00 96,00 94,40 95,7

 21
3.2 The influence of ethanol
In the previous section, 3.1, the distillation curves involved all evaporation values. From
this section and onwards, the desired evaporation values corresponding to 70 ˚C and
100 ˚C will be analyzed so that the final equations for predicting EV70 and EV100 can be
reached.
To make the distillation curves only account for the influence of ethanol, a point zero or
rather a baseline, was created by subtracting the results of the BOB´s (E0) distillation
data to the each of the GEB:s, E5-E25, for each specific blend. The difference in
evaporation will thus be in correlation to the ethanol. The results of subtracting EV70 of
the BOB, from the value of EV70 for all the GEB:s is plotted in Figure 11 and Figure 12,
respectively.

Figure 11. With the BOB as baseline, the figure illustrates how the evaporation changes depending on
ethanol content at 70 ˚C.

 22
Figure 12. With the BOB as baseline, the figure illustrates how the evaporation changes depending on
ethanol content at 100 ˚C.

From Figure 11 and Figure 12 there is a noticeable increase in standard deviation as
ethanol content was increased, especially above 10% ethanol content. A distinct
difference between samples below 15% ethanol content compared to above 15% ethanol
content, is that samples above 15% where diluted. Dilution is one possible factor for the
increased deviation. As dilution increased with increased ethanol content it would explain
the increased deviation with increased ethanol content.
As mentioned in 2.1.2, ethanol can form both binary and ternary azeotropes. In the BOB,
there are almost hundreds of different substances ranging from C3-C12+ carbons, which
could lead to several possible azeotrope formations. Each recipe could potentially
produce its own set of azeotropes, which means comparing different blends might always
lead to some degree of deviation. Increasing the ethanol content might also be a factor
that can influence the azeotrope formation.
Comparing Figure 11 and Figure 12 the noticeable trend is that deviation from a linear
conjunction is the greatest at 70 ˚C, and then subsides at 100 ˚C. This result is
strengthened by the fact that at 150 ˚C, evaporation values for gasoline-ethanol blends
were almost indistinguishable from those of the BOB. The reason for this is probably
because of ethanol’s boiling temperature, at 78.4 ˚C. Azeotrope formation is likely
influencing evaporation at 70 ˚C more decisively.

 23
3.3 Results for EV70
For EV70, the equation that best described the data points was a fourth-order polynomial,
written in Figure 13. As can be seen, there are several data points with large deviation
from the trendline.

Figure 13. Trendline for EV70. Set intercept at 0:0.

Gasoline blends containing 0-10% ethanol represent gasoline produced at Preem at the
present.
For that purpose, results were divided into smaller segments. Ethanol content between 0-
10% will cover todays production of GEB:s at Preem, while 15-25% will cover a potential
future scenario. Results were therefore divided into a “present case” and “future case” to
predict the change in EV70 as ethanol is added to gasoline. Another reason for this
division is that instead of a fourth-order polynomial, EV70 can be described using two
linear equations.

 24
The “Present case”:

Figure 14. Present case for EV70 with a set intercept at 0:0

The “Future Case”:

Figure 15. Future case, covering ethanol content above 15% V/V

The ethanol should not influence the BOB, if there is no ethanol in the BOB. The trendline
was thus set with a set intercept at (0:0) in Figure 14.
As the breaking point, for where the future case and the present case should start/end,
the two linear equations could potentially cover that area until further analysis can be
done.

 25
Figure 16. The breaking point for EV70 described using the two linear equations.

Acknowledging that the intersected area of 10-15% requires further investigation, the best
option for now is to use the two linear equations to cover this uncertain area. Thus, the
present case can be increased to 11.8% just as the future case can be increased to cover
11.8% if desired.

3.4 Results for EV100
Applying a linear conjunction to EV100 resulted in the following:

Figure 17. EV100 with a linear equation.

 26
As both 5% and 10% ethanol content have significant deviation from the trendline, a linear
equation would incorrectly predict EV100 at what is the crucial area for the present.
Instead of a linear equation a second order polynomial, shown in Figure 18, describe the
increase in EV100 more accurately.

Figure 18. EV100 as polynomial 2:n order.

As the section 0-10% ethanol content is of high importance, a present case, was produced
for EV100 as well.

Figure 19. Present case for EV100, covering 0-10% ethanol content.

The linear equation in Figure 19 has low accuracy at 5% ethanol content. This is caused
by B3, at 10% ethanol content, as it significantly impacts the equation. It would be easy

 27
to remove B3 from the data series, but with an already relatively low number of data points,
removing data would reduce credibility.

A future case, with ethanol content above 15%, for EV100:

Figure 20. Future case for EV100

 28
3.5 Summarized results
To account for azeotrope formation, these final equations can be used to predict
evaporation value.

For 0-10% ethanol content (X)
 70 = 1.8042
 100 = 0.4235

For 15-25% ethanol content
 70 = −0.69 + 29.33

 100 = 0.8942 − 4.1738

The full 0-25% ethanol content
 70 = 0.0004 4 − 0.0196 3 + 0.2143 2 + 1.147
 100 = 0.015 2 + 0.3573

Several other equations are possible to arrive at from the data obtained during this thesis.
To find the optimum equation, the equation needs to be verified by practical use in starting
recipes. Practical applications would be tested by comparing the predicted evaporation
values, to the actual values obtained from gasoline which is produced from this prediction.
This procedure would either validate that the equations function as intended, or serve as
a good foundation as additional data points are obtained.

 29
Conclusion

Substituting part of the gasoline with ethanol has several environmental advantages.
Reduced green-house gas emissions as well as reduced dependence on fossil fuel being
the two main benefits. Ethanol has a high production versatility, allowing it to be produced
from a range of different sources, which enables a production process that is not
dependent on a single source of raw materials. Ethanol is an octane booster, meaning the
octane value will increase with increased ethanol content. Higher octane value means the
fuel can withstand increased compression, which results in increased pressure and
temperature in the engine, hence increases the fuel efficiency.

From the results it has been shown that the evaporation values at 70 ˚C, 100 ˚C and 150
˚C react differently as increased levels of ethanol is added. At 70 ˚C the evaporation value
strongly deviates from a linear relation as ethanol level increases, and can best be
described with a fourth-order polynomial. Evaporation levels at high temperatures are less
effected by the addition of ethanol, and as temperatures of 150 ˚C is reached, the
difference in evaporation values were not significant enough to require an equation.

Results from dividing the ethanol content showed that below 10% ethanol, EV70 and
EV100 could be explained linearly. This was a practical decision as the starting recipes,
as of today, only needed to accommodate for ethanol content up to 10%. Equations for
ethanol content above 15% were produced to accommodate for a future scenario, as it is
likely that gasoline with higher content of ethanol will be produced in a not so distant future
with increasing reduction quotas.

 30
Abbreviations
E5 Gasoline with 5 V/V ethanol
GEB Gasoline-Ethanol blend
C5 Carbohydrate with 5 carbons
RON Researched octane value
MON Motor octane value
i- Iso-
n- normal-
IBP Initial-boiling point
FBP Final-boiling point
BOB Before oxygenated blending
B5 BOB based on recipe 5
B5E5 BOB 5 with 5% ethanol
EV Evaporation values
EV70 Corresponds to: amount evaporated as temperature reach 70˚C

 31
Appendix A

Figure 21. E0 blends, where B1-B8 denotes the recipe used.

Figure 22. The E5 blends.

Figure 23. E10 blends.

 32
Figure 24. E15 blends

Figure 25. E20 blends

Figure 26. E25 blends

 33
References

[1] Preem, "Preem," Preem AB, 16 September 2020. [Online]. Available:
 https://www.preem.com/in-english/. [Accessed 16 September 2020].
[2] "Regeringskansliet," 11 09 2020. [Online]. Available:
 https://www.regeringen.se/pressmeddelanden/2020/09/branslebytet-forstarks-med-
 hogre-inblandning-av-fornybart-i-drivmedel/. [Accessed 16 11 2020].
[3] M. Amine, E. N. Awad and Y. Barakat, "Reformate-enriched gasoline-ethanol blends:
 Volatility criteria and azeotrope formation," Egyptian Journal of Petroleum, vol. 28, no. 4,
 pp. 377-382, 2019.
[4] W. P. Leland, Ethanol and Biofuels: Production, Standars and Potential, New York: Nova
 Science Publishers, Inc, 2009.
[5] A. I. F. D. T. N. V. Angelo Basile, Ethanol : Science and Engineering, Amsterdam: ELSEVIER,
 2019.
[6] L. Matějovský, "Study of Corrosion of Metallic Materials in Ethanol–Gasoline Blends:
 Application of Electrochemical Methods," Energy & Fuels, vol. 31, no. 10, pp. 10880-
 10889, 2017.
[7] D. D. J. G. U. K. T. L. H. R.-P. T. W. J.E. Anderson, "High octane number ethanol–gasoline
 blends: Quantifying the potential benefits in the United States," Fuel, vol. 97, pp. 585-594,
 2012.
[8] A. Demirbas, "Octane Rating of Gasoline and Octane Booster Additives," Petroleum
 Science and Technology, vol. 33, no. 11, pp. 1190-1197, 2015.
[9] Z. G. N. K. V. Dongyang Li, "Molecular Mechanism for Azeotrope Formation in
 Ethanol/Benzene Binary Mixtures through Gibbs Ensemble Monte Carlo Simulation," The
 Journal of Physical Chemistry B, vol. 124, no. 16, pp. 3371-3386, 2020.
[10] J. B.-G. J. Bevan Ott, Chemical Thermodynamics: Advanced Applications, San Diego,
 California : Academic Press, 2000.
[11] R. R. W., Handbook of Separation Process Technology, John Wiley & Sons, 2017.
[12] G. J. D. M. Rocha, "Dilute mixed-acid pretreatment of sugarcane bagasse for ethanol
 production," Biomass and Bioenergy, vol. 35, no. 1, pp. 663-670, 2011.
[13] E. v. d. V. G. H. Lin Luo, "Life cycle assessment and life cycle costing of bioethanol from
 sugarcane in Brazil," Renewable and Sustainable Energy Reviews, vol. 13, no. 6-7, pp.
 1613-1619, 2009.
[14] M. C. G. P. Aiduan Li Borrion, "Environmental life cycle assessment of lignocellulosic
 conversion to ethanol: A review," Renewable and Sustainable Energy Reviews, vol. 16, no.
 7, pp. 4638-4650, 2012.
[15] P. R. R. Chang Samuel Hsu, "Gasoline Production," in In: Petroleum Science and
 Technology. Springer, Cham., Switzerland, Springer, Cham, 2019, pp. 189-210.

 34
[16] M. F. M. F. K. G. Walaa Mahmoud Shehata, "Monitoring and modelling of variables
 affecting isomerate octane number produced from an industrial isomerization process,"
 Egyptian Journal of Petroleum, vol. 27, no. 4, pp. 945-953, 2018.
[17] R. A. Meyers, Handbook of Petroleum Refining Processes, Fourth Edition, New York:
 McGraw-Hill Education, 2016.
[18] G. G. F. L. Filippo Lo Coco, "Multidimensional gas chromatographicdetermination of
 naphthenes, paraffins, olefins,and aromatics in reformed gasolines," Journal of Separation
 science, vol. 30, no. 14, pp. 2305-2310, 2007.
[19] PAC, PAC L.P, 2021. [Online]. [Accessed 25 01 2021].
 https://www.paclp.com/tenants/pac/documents/distillation%
 20optimization%20through%20atomospheric%20distillation.pdf
[20] P. LP, "paclp," 2020. [Online]. [Accessed 25 01 2021].
 https://www.paclp.com/tenants/pac/documents/optidist-brochure-rev4-us.pdf
[21] PAC, "PAC," PACLP. [Online]. [Accessed 01 02 2021].
 https://www.paclp.com/lab-instruments/industry/
 petrochemical/product/7/optidist-atmospheric-distillation

Compilation of ISO-standards

ISO: 228:2012+A1, 2017
Automotive fuels – Unleaded petrol – Requirements and test methods

AST D7794, 2020
Standard Practice for Blending Mid-Level Ethanol Fuel Blends for Flexible-Fuel Vehicles
with Automotive Spark-Ignition Engines

ISO: 3405:2019
Petroleum and related products from natural or synthetic sources – Determination of
distillation characteristics at atmospheric pressure.

ASTM D86-20a
Standard Test Method for Distillation of Petroleum Products and Liquid Fuels at
Atmospheric Pressure

 35
You can also read