The role of Amazon river runoff on the multidecadal variability of the Atlantic ITCZ - IOPscience
←
→
Page content transcription
If your browser does not render page correctly, please read the page content below
LETTER • OPEN ACCESS

The role of Amazon river runoff on the multidecadal variability of the
Atlantic ITCZ
To cite this article: S Jahfer et al 2020 Environ. Res. Lett. 15 054013

View the article online for updates and enhancements.

                                This content was downloaded from IP address 46.4.80.155 on 19/02/2021 at 05:00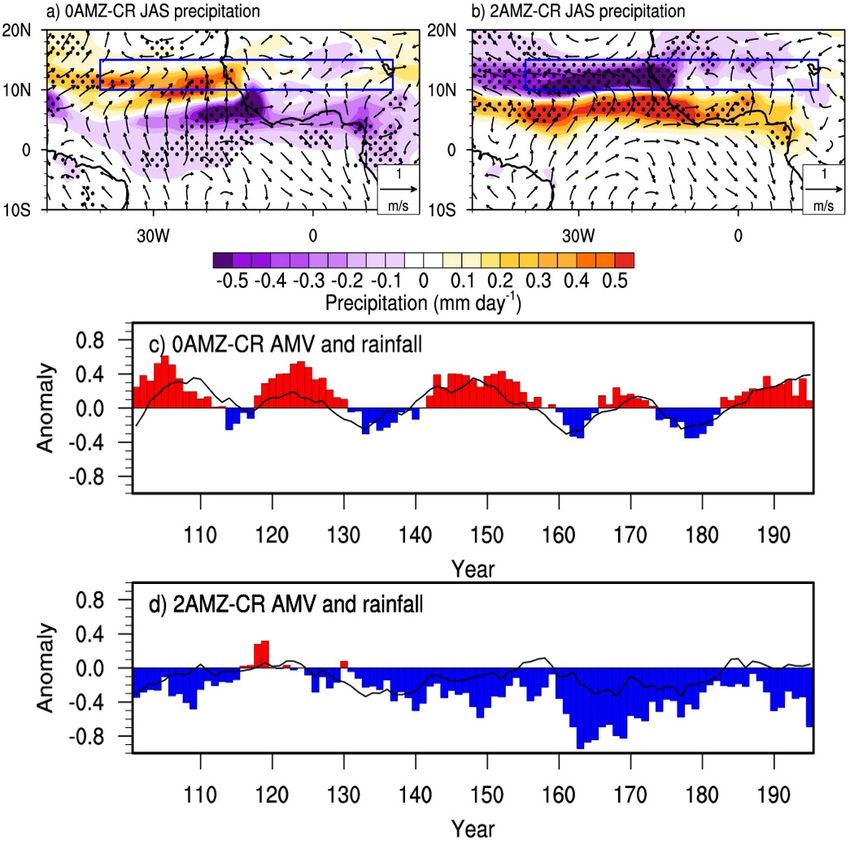
Environ. Res. Lett. 15 (2020) 054013 https://doi.org/10.1088/1748-9326/ab7c8a
Environmental Research Letters
The role of Amazon river runoff on the multidecadal variability of
the Atlantic ITCZ
OPEN ACCESS S Jahfer1,2, P N Vinayachandran1,2 and Ravi S Nanjundiah1,2,3
1
Centre for Atmospheric and Oceanic Sciences, Indian Institute of Science, Bangalore, 560012, India
2
RECEIVED Divecha Center for Climate Change, Indian Institute of Science, Bangalore, 560012, India
13 September 2019 3
Indian Institute of Tropical Meteorology, Dr Homi Bhabha Road, Pashan, Pune, 411008, India
REVISED E-mail: jaffsharif@gmail.com
29 February 2020
ACCEPTED FOR PUBLICATION Keywords: Amazon discharge, Atlantic Multidecadal Variability, Intertropical convergence zone
3 March 2020
Supplementary material for this article is available online
PUBLISHED
12 May 2020
Original Content from
Abstract
this work may be used Climate model projections for the 21st century predict an elongated dry season in the Amazon
under the terms of the
Creative Commons basin, potentially reducing the discharge into the equatorial Atlantic Ocean. In order to understand
Attribution 4.0 licence.
the climatic role of Amazon runoff into the ocean, sensitivity experiments were carried out using
Any further distribution
of this work must the Community Earth System Model (CESM). Without Amazon runoff, the Atlantic Meridional
maintain attribution to
the author(s) and the title
Overturning Circulation (AMOC) strengthens and the associated increase in northward heat
of the work, journal transport induces a positive temperature anomaly in the North Atlantic Ocean with a spatial
citation and DOI.
structure similar to the positive phase of the Atlantic Multidecadal Variability (AMV). A positive
phase of AMV developed in the absence of Amazon runoff triggers a bipolar seesaw in SST across
the thermal equator with warming to the north and cooling to the south. The boreal summer
rainfall in the tropical Atlantic Ocean sector responds to this change in SST by displacing the
intertropical convergence zone (ITCZ) to the north of its mean position. An alternate experiment
by doubling the Amazon runoff shows a weakening of AMOC and AMV and a southward shift in
the summer–time ITCZ. In both the experiments, we find that the largest change in rainfall is
exhibited over the region where the AMV–induced decadal variability in rainfall is prominent,
confirming the source of rainfall variability. Based on sensitivity experiments by varying the runoff,
we propose that the Amazon discharge can affect the multidecadal variabilities, the AMOC and
AMV, and thereby the low–frequency variability of rainfall over the tropical North Atlantic Ocean
and northwest Africa. We conclude that the freshwater input from the Amazon plays a significant
role in the sustained wet and dry climatic phases of rainfall events over the tropical North Atlantic
Ocean and West African nations and thus have an impact on the regional hydrological cycle and
economy.
1. Introduction in large–scale meridional heat transport, the Atlantic
meridional overturning circulation (AMOC), is a
The intertropical convergence zone (ITCZ) is charac- major source of global climate variability on decadal
terized by a narrow band of deep convective clouds to multidecadal timescales [7, 8]. The variability in
and heavy rainfall stretching zonally over the thermal AMOC–driven heat transport induces a basin–wide
equator, where the easterlies converge [1]. During sea surface temperature (SST) anomaly termed as the
boreal summer (June to September; JJAS, hereafter Atlantic Multidecadal Variability (AMV [9, 10]). The
simply summer, for the sake of brevity) the ITCZ is AMV is associated with the SST variability in the
located to the north of the equator [2]. The variab- North Atlantic basin with alternate cold and warm
ility in the meridional position of summer ITCZ in phases occurring at a frequency of several decades. A
the Atlantic sector affects the South American mon- positive phase of AMV (warm North Atlantic) favors
soon [3], West African monsoon [4] and the rain- a northward displacement of intertropical conver-
fall over the tropical Atlantic Ocean [5]. The West gence zone (ITCZ), whereas, during a weaker phase,
African rainfall exhibits variability ranging from sea- the ITCZ migrates southward [11–15]. Several studies
sonal to multidecadal timescales [6]. The fluctuations show that the continental–scale multidecadal drought
© 2020 The Author(s). Published by IOP Publishing Ltd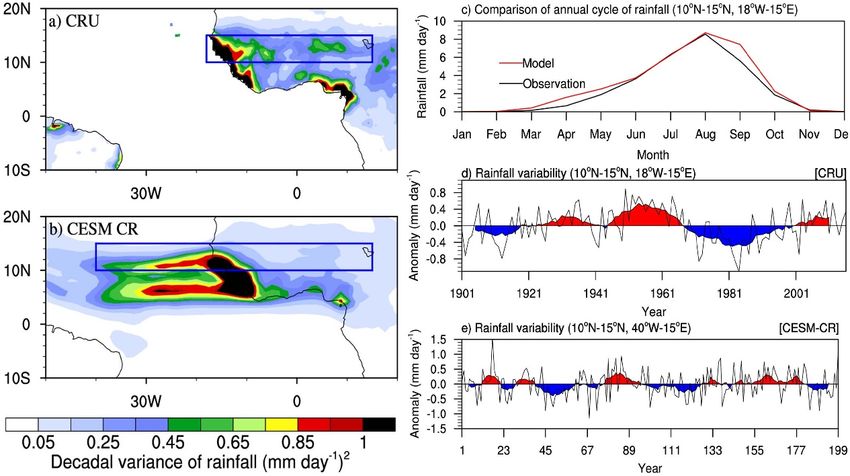
Environ. Res. Lett. 15 (2020) 054013                                                                       S Jahfer et al

events in northwest Africa and the Sahel are related        the northern half compared to the south (figures 1(a)
to the changes in AMV through its control on the            and (b)). In the past decades, this region experi-
meridional position of ITCZ [6, 11, 16]. Therefore,         enced severe and prolonged drought events that resul-
a deeper understanding of various factors affecting         ted in large–scale human migrations [27, 28]. This is
the low–frequency variability in ITCZ is vital for the      because there exists a strong multidecadal–scale vari-
longterm prediction of rainfall.                            ability in rainfall over this region, overlying the inter-
     Seasonally, the surface salinity budget in the trop-   annual variability (Supplementary figures 1(a)–(d)).
ical Atlantic Ocean is regulated by a net loss of fresh-    Several studies have shown that these extreme events
water as the evaporation dominates over precipit-           are associated with the low–frequency SST variabil-
ation. But, the freshwater influx from the Amazon           ity in the Atlantic, the AMV [11, 13, 29]. Paleocli-
river partly compensates for the evaporative loss and       mate studies of the past millennia also signify the act-
is one of the major sources of salinity variability in      ive role of AMV on the multidecadal droughts in the
the tropical Atlantic Ocean [17]. Amazon river dis-         Sahel region [16]. Observed anomalies in SST dur-
charges ∼ 6.6 × 10³ km3 of freshwater into the equat-       ing a positive AMV event coincide with a positive
orial Atlantic Ocean annually [18]. Climate projec-         rainfall anomaly over the southern half of the Sahel,
                                                                                                        ◦          ◦
tions for the 21st century predict a reduced discharge      demarcated by the blue box between 10 N and 15 N
from the Amazon, owing to an elonged dry season             in figures 1(c) and (e), suggesting a northward shift
and increased damming and diversion of river water          in the mean ITCZ. The SST anomaly associated with
                                                                                                                   ◦
[19–22]. However, the impact of such large–scale            a positive AMV shows warming to the north of 10 N
changes in Amazon runoff on climate remains largely         and cooling to the south of it, creating a meridional
unexplored. In this study, using coupled climate            SST gradient across the thermal equator (figure 1(d)).
model simulations, we demonstrate the role of               On the other hand, when the observed AMV is in
Amazon runoff in regulating the AMV that sub-               a cooler phase, the rainfall anomaly is negative over
sequently affects the multidecadal variability of sum-      the region enclosed by the box in figure 1(e), with
mer rainfall over the tropical Atlantic sector. A           a southward shift in the mean ITCZ position and
climate model experiment demonstrated that the              the associated meridional gradient in SST reverses
Amazon river runoff affects the oceanic heat trans-         (figure 1(f)). Below we focus on the role of Amazon
port and large–scale climate variabilities across the       runoff on the aforementioned variability of rainfall
globe including the AMOC [23], North Atlantic               over the tropical Atlantic region and West Africa that
Oscillation [23], and El Niño [24]. Studies using stan-     has a significant impact on the regional economy and
dalone ocean model [25] and coupled simulations             hydrological cycle.
[23] reveal that Amazon runoff influence the AMOC                The decadal variance in JJAS rainfall (variance of
through changes in upper ocean salinity and dens-           10–year running average) shows that the CESM CR
ity and thereby the rate of deepwater formation. In a       simulation is able to pick up the high variability (> 1
previous study [23] we showed that the largescale cli-      mm day−1 ) along the coasts of West Africa, with some
mate oscillations in the Atlantic Ocean are modulated       difference in magnitude (figures 2(a) and (b)). The
by the Amazon runoff. Using the Community Earth             observed and simulated decadal variance (figures 2(a)
System Model (CESM, Version 1.0 [26]), we carried           and (b)) in the summer rainfall is confined to the
out two sensitivity experiments, one without Amazon         north of the equator exhibiting significant variability
runoff (0AMZ) and the other by doubling the run-            in the southern Sahel (blue box). However, the vari-
off (2AMZ). We analyze the active role of Amazon            ance of inland rainfall, away from the coast, is not well
freshwater input on the AMV and the summer–                 reproduced in the CR when compared to the obser-
time Atlantic ITCZ by comparing the responses in            vation (figures 2(a) and (b)) and we are unable to
0AMZ and 2AMZ with respect to the control simu-             present the observed decadal rainfall variability over
lation (CR). Model configuration and experimental           the ocean since the CRU dataset [32] is land–based. A
details are provided in the Supplementary Material          comparison of simulated rainfall variability over the
(stacks.iop.org/ERL/15/054013/mmedia), section 1.           selected box in figure 2(b) with and without oceanic
                                                            grid points is shown in Supplementary figure 2(a) and
2. Low-frequency variability of the                         (b). Further, the decadal variance of longterm rain-
Atlantic summer ITCZ                                        fall over the tropical North Atlantic Ocean and Sahel
                                                            region is unrealistically large in the reanalysis datasets
The climatological mean rainfall and winds from the         and therefore not shown.
observation as well the CESM control (CR) simula-                Though there are some disagreements in the
tion show that the summer–time (June–August; JJAS)          magnitude and spatial extent of the decadal vari-
ITCZ is located to the north of the equator, roughly        ance between observed and simulated rainfall, we use
                    ◦
centered around 8 N, where the low–level easterly           the CESM model simulations to qualitatively show
winds converge (figures 1(a) and (b)). In both the          the Amazon runoff–induced longterm variability of
                                          ◦       ◦
observation and CR, the Sahel region (10 N–20 N,            the Atlantic ITCZ. From figures 1(c) and (e), it is clear
   ◦     ◦
18 W–15 E [6]) receives relatively less rainfall over       that the AMV–related rainfall variability over the

                                               2
Environ. Res. Lett. 15 (2020) 054013 S Jahfer et al
Figure 1. Atlantic ITCZ–AMV connection. Upper panels show the climatological mean summer (JJAS) rainfall (shaded; in mm
day−1 ) overlaid with surface wind vectors (m s−1 ) from (a) observation and (b) CESM control simulation. Middle and bottom
panels present the JJAS low–frequency variability in rainfall and SST associated with AMV. Composite of observed rainfall (c) and
SST (d) anomalies during a positive phase of AMV (from 1930 to 1960) is presented in the middle panel. (e) and (f) represent the
observed rainfall and SST anomalies during a negative AMV (from 1970 to 1990). The rainfall and wind data in (a) were obtained
from the Global Precipitation Climatology Project (GPCP, Version 2.2 [30]) and the Modern-Era Retrospective Analysis for
Research and Applications (MERRA, Version 2 [31]), respectively, for the period 1980 to 2016. The blue box encloses the Sahel
◦ ◦ ◦ ◦
region exhibiting the largest response (southern Sahel; 10 N–15 N, 18 W–15 E) to the change in phase of AMV. The longterm
observed land rainfall and SST (in (c)–(e)) were obtained from the Climatic Research Unit Timeseries (CRU, Version 4 [32]) and
the Met Office Hadley Centre’s sea ice and SST data set (HadISST [33]), respectively.
Sahel region is mostly confined to the southern half for the JAS season as the response over the south-
◦ ◦ ◦
(box encompassing the region 10 N–15 N, 18 W– ern counterpart is almost opposite in sign (as seen
◦
15 E). Further, the decadal variance in summer rain- in figures 1(c) and (e)). The mean rainfall over the
◦ ◦ ◦
fall to the north of 10 N is largely contributed by southern half of the Sahel (averaged over 10 N–15 N,
◦ ◦
the July, August, and September months (JAS; Sup- 18 W–15 E) shows a clear seasonality, with the
plementary figures 1(b)–(d)). Therefore, we focus highest rainfall in the month of August (8.2 mm
our further analysis on the JAS rainfall variability in day−1 ) with significant contribution during July and
the model and its response to Amazon runoff over September months as well [6, 34], in both observa-
the southern half of the Sahel and northern tropical tion and CR (figure 2(c)). The timeseries of inter-
Atlantic Ocean. annual (black curve) and decadal (10–year running
In the CR, there are two zonally distinguishable average; red and blue shades) rainfall during peak
bands of high decadal variability over the north- months of JAS in the box enclosed in figures 2(a)
ern tropical Atlantic Ocean (figure 2(b)). When the and (b) are shown in figures 2(d) and (e), respectively.
AMV is positive, the northern band experience higher From observation, it is evident that the southern Sahel
than normal rainfall (over the box in figure 2(b)), experienced prolonged wet (from 1930 to 1960) and
whereas the rainfall over the southern band reduces. dry periods (from 1970 to 1990) that sustained for
We present the variability over the northern band more than a decade (figure 2(d)) before its recovery
3Environ. Res. Lett. 15 (2020) 054013 S Jahfer et al
Figure 2. Low–frequency variability of rainfall. Decadal rainfall variability in CRU (a) and CR (b) estimated as the variance (in
(mm day−1 )2 ) of the 10–year running average of JJAS rainfall. The blue box in (a) encloses the southern Sahel region where the
low–frequency rainfall variability is high, whereas the box in (b) encloses the same latitude but by including the high rainfall
variability over the oceanic region as well. Since the CRU dataset lacks rainfall over ocean grid points, the comparison of the
◦ ◦ ◦ ◦
annual cycle of rainfall (c) is presented over the southern Sahel region (10 N–15 N, 18 W–15 E; for the box shown in (a)) from
the observation (black curve) and the CR (red curve). Note that the southern half of the Sahel receives its largest share of rainfall
during the summer months of July, August, and September (JAS) as seen in (c). The observed interannual (black curve) and
10–year average (red and blue shades) timeseries of rainfall over the southern Sahel during peak months (JAS) is presented in (d).
◦ ◦
(e) shows the timeseries of interannual and decadal rainfall variability in the CR run including the ocean points (10 N–15 N,
◦ ◦
40 W–15 E) for JAS months (for the box shown in (b)).
since 2000. Though the simulated interannual vari- relatively small and, therefore, a complete shutdown
ability of rainfall is comparable to the observation of freshwater would result in pile up of water over
(~0.2 mm day−1 ), the decadal variance is relatively the land, submerging a huge area and affecting the
weaker (figures 2(d) and (e)). A similar analysis was local hydrology and ecosystem. These feedbacks in
performed for the CR simulation by selecting the the real world will not be captured in our study as
same box over the southern Sahel region as in obser- it is an idealized experiment that does not account
vation (Supplementary figures 2(a) and (b)). Though for the water that is stopped from reaching the ocean.
there exist large differences in interannual rainfall, the Further, the simulated longterm impacts of shutting
decadal rainfall variability in the CR run over the land off/doubling of Amazon runoff cannot be segreg-
region (blue box in figure 2(a)) and the region that ated from the observation since the observed run-
includes the ocean rainfall (blue box in figure 2(b)) off does not show a consistent increase/reduction
exhibits a striking similarity (Supplementary figures in longer timescales [22]. Moreover, the observed
2(a) and (b)). This suggests that the source of multi- AMOC record from the Rapid Climate Change-
decadal rainfall variability over the demarcated land Meridional Overturning Circulation and Heatflux
and ocean region is of the same origin (Supplement- Array (RAPID/MOCHA) covers only the last 2 dec-
ary figures 2(a) and (b)). Keeping this in mind, we ades; which is insufficient to analyze the longterm
explore the impact of runoff on AMV and summer impacts.
ITCZ using CESM1.0 CR run and sensitivity experi-
ments by shutting off (0AMZ) and doubling (2AMZ)
the Amazon runoff. The model simulations were car- 3. Oceanic response to Amazon runoff
ried out for 200 years and the results from the last
100 years are used for our analysis (for more details The summer–time (JAS) response of sea surface salin-
on model configuration and experiments see Supple- ity (SSS) to the blocking of Amazon runoff into the
mentary section 1). ocean (0AMZ) is shown in figure 3(a). The differ-
This model study on the climatic impacts of ence (0AMZ–CR) in JAS surface salinity for the 100–
Amazon runoff have the following limitations. The 200 year period (figure 3(a)) shows that the effect
sensitivity experiments were conducted by shutting of runoff can be found even thousands of kilomet-
down or doubling the Amazon discharge, which is not ers far away from the river mouth [23, 24]. In the
realistic. In reality, the natural variability in runoff is absence of Amazon discharge (0AMZ), the North
4Environ. Res. Lett. 15 (2020) 054013 S Jahfer et al
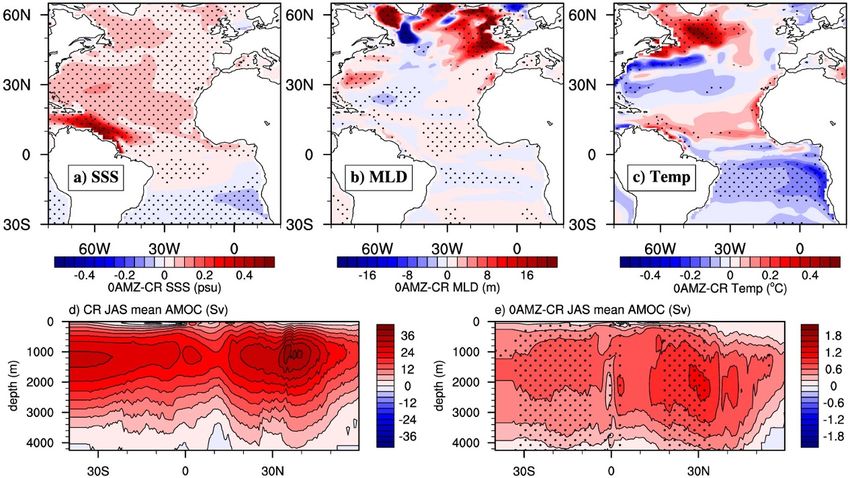
Figure 3. Oceanic response to Amazon runoff. Mean response (sensitivity (0AMZ) minus control (CR)) in SSS (in psu; (a)),
◦
MLD (in m; (b)), and upper 50 m temperature (in C; (c)) to a shut down of Amazon runoff. The differences are plotted for the
JAS season for SSS and SST whereas the MLD response is shown for DJF (December–February). The mean simulated meridional
overturning circulation in the Atlantic basin (Sv) in the CR and its difference with the 0AMZ (0AMZ–CR) is shown in (d) and (e),
respectively. Positive value denotes a clockwise circulation in the meridional and a positive difference in (e) implies a
strengthening of meridional circulation in the 0AMZ, compared to the CR. Dotted regions denote the differences that are
significant at 90% confidence level estimated using Student’s t–test.
Atlantic turns saltier (figure 3(a)) and the salin- including the Labrador Sea region) in the DJF months
ity anomalies from the river mouth (~2 psu) reach is considered as a fingerprint of enhanced deepwa-
the northern extratropics via strong and prevailing ter formation and intensification of AMOC (briefly
northward boundary currents [23–25]. The western explained in [23]). Earlier studies on Amazon run-
boundary currents carry anomalous SSS from the off proposed that a significant change in tropical
◦
Amazon mouth along the coast (till ~40 N) and then freshwater input can influence the AMOC [23, 25]
directed to the open ocean by the offshore currents through salinity–induced changes in the rate of deep-
(Supplementary figure 3). However, there exists a water formation. Consistent with an increase in
huge interannual variability in the northward advec- SSS and deepening of MLD in the extratropics, the
tion of the positive SSS in the 0AMZ (Supplementary AMOC strengthens in the absence of Amazon run-
figures 3(b) and (c)). The Amazon runoff–induced off (maximum increase of ~5% at around 2000 m
◦
changes in air–sea interaction also contributes to the along 30 N; figure 3(e)). Though the magnitude of
SSS anomalies in the 0AMZ (positive P minus E leads increase in AMOC in the 0AMZ in figure 3(e) is weak
to freshening in Supplementary figures 3(b) and (c)). compared to the mean AMOC strength of the CR
The direct impact of runoff on SSS (positive differ- (figure 3(d)), the upper ocean temperature response
ence) is negligible to the south of the equator, high- to this change in circulation is significant. One of
lighting the predominant role of northward surface the robust responses to an intensification of AMOC
currents in the salinity distribution in the Atlantic is the development of meridional SST dipole with
Ocean. An increase in SSS in the northern Atlantic cooling to the south and warming to the north of
Ocean has a significant effect on the mixed layer depth the thermal equator [35, 36]. Consistent with the
(MLD) and the deepwater formation, especially dur- earlier studies (e.g. [37]), a reinforced AMOC (in the
ing northern winter (December to January; DJF) as absence of Amazon input) warms the upper ocean
the exchange of heat fluxes between atmosphere and (top 50 m) of the North Atlantic and cools the south-
◦
ocean is strongest during that period of time. ern part (by ~0.3 C) via changes in meridional heat
The runoff–induced changes in MLD in the transport and enhanced upwelling in the southern
northern extratropics are not significant in the sum- latitudes (figure 3(c); for more details see [23]). On
mer months and therefore not shown. During DJF, the other hand, when the runoff from the Amazon
the mean MLD in the 0AMZ deepens over the is doubled, we get a contrasting response, with
◦
extratropical North Atlantic, north of 40 N. A sig- fresher and cooler North Atlantic and a suppressed
nificant increase in MLD (by more than 20 m) in deepwater formation and AMOC (Supplementary
the extratropics (over the deepwater formation sites figure 4).
5Environ. Res. Lett. 15 (2020) 054013 S Jahfer et al
Figure 4. Rainfall response to runoff and its relation with AMV. Mean difference in JAS rainfall in the 100–200 years of
simulation for (a) 0AMZ–CR and (b) 2AMZ–CR. The blue box delineates the region where the model rainfall decadal variance is
prominent (shown in figure 2). Dotted regions are significant at 90% confidence level. Note that the ITCZ shifts to the north of its
mean position in the absence of Amazon runoff and to the south with doubling of Amazon runoff. The timeseries of difference in
magnitude of JAS rainfall (bar chart) and AMV index (black curve) after applying a 10–year running average for 0AMZ–CR and
2AMZ–CR is shown in (c) and (d), respectively.
In the absence of Amazon runoff, a tripole response of rainfall over the tropical Atlantic Ocean in
pattern of temperature anomaly emerges in the relation to the AMV–like SST pattern.
North Atlantic with a cool anomaly centered around During the JAS season, the atmospheric feedback
◦
40 N and 2 warm anomalies surrounding it to the on the SST is relatively weak (Supplementary figure
◦ ◦
north (centered around 55 N) and south (15 N), 5). We also find that the equatorial cold–tongue in
respectively (figure 3(c)). This tripole pattern off SST the top 50 m of the upper ocean, stretching off the
difference in the 0AMZ over the North Atlantic Ocean coast of the Gulf of Guinea, intensifies (0.35◦ C cool-
resembles the SST anomaly induced by a negative ing along the coast), generating a meridional dipole
NAO. In an earlier study, we have found that the in SST (figure 3(c)). Several studies have focussed on
absence of Amazon runoff leads to a negative NAO– the inverse relationship between AMOC and meri-
like atmospheric response over the North Atlantic dional SST dipole (for e.g. [36, 38, 39]) and sugges-
sector during winter [23]. Typically, the AMV is char- ted that this can be used as a fingerprint of AMOC
acterized by a basin-wide warming/cooling of the strength. The enhancement of the cold tongue in the
North Atlantic Ocean. In our study, the monopolar equatorial Atlantic (in figure 3(c)) further confirms
SST pattern in the North Atlantic Ocean associated the intensification of AMOC in the absence of run-
with AMV is embedded with the tripolar SST asso- off. On the other hand, when the Amazon runoff is
ciated with NAO. However, we find that the rainfall doubled, the anomaly over the cold tongue becomes
and SST changes in the tropical Atlantic are coherent warmer and the meridional dipole reverses its sign
with the phase of AMV rather than NAO. Further, the (Supplementary figure 4(c)). Earlier studies suggest
effects of NAO are limited to the extratropical Atlantic that the occurrence of meridional see–saw in SST
Ocean, and thus the changes in the tropical Atlantic anomaly over the tropical Atlantic Ocean is largely
sector are driven by the positive AMV–like SST pat- driven by the wind–evaporation–SST (WES) feed-
tern. Therefore, in the rest of the study, we analyse the back in the tropical Atlantic Ocean [10]. However,
6Environ. Res. Lett. 15 (2020) 054013 S Jahfer et al
in the absence of Amazon river input, the contri- The JAS rainfall in 0AMZ shows a mean increase
bution of atmospheric feedback to the cooling in (shades of red) in the region enclosed by the box in
the southern tropical Atlantic Ocean in the 0AMZ is figure 4(a) (maximum increase of 0.63 mm day−1
not significant (Supplementary figures 5(a) and (b)). over the ocean). In contrast, the mean rainfall in
From figure 3(c) (and Supplementary figure 4(c)), it 2AMZ reduces over the North Atlantic Ocean (-0.47
is evident that the upper 50 m of the tropical North mm day−1 ) and the Sahel region with peak reduction
Atlantic Ocean turns warmer (cooler) in the absence of -0.95 mm day−1 over the ocean (figure 4(b)). To
(doubling) of Amazon runoff. How does this runoff– the south of southern Sahel, the rainfall response
induced temperature change in the Atlantic Ocean reverses with suppressed rainfall in 0AMZ and
affect the summer–time ITCZ? enhanced rainfall in 2AMZ (figures 4(a) and (b)).
The AMV index used in the study is calculated as As seen in figure 2(b), the northern zonal band of
the area–average upper ocean (top 50 m) temperature high decadal variance has a contrasting response to
◦ ◦
in the North Atlantic Ocean over region 0 N–60 N, the changes in the southern band. This is due to the
◦ ◦
70 W–10 W. Most of the earlier studies opted basin– AMV–induced excursion of Atlantic ITCZ between
wide SST instead of top 50 m [37, 40, 41]. How- the northern and the southern band on a multi-
ever, we find that the simulated multidecadal vari- decadal timescale. The surface wind difference also
ability of rainfall in the CR and sensitivity (0AMZ shows convergence towards the high rainfall band
and 2AMZ) is better correlated with mean temper- (vectors in figures 4(a) and (b)). Consistent with the
ature in the upper 50 m than the SST. The upper– earlier studies, our simulations show that anomalous
ocean temperature shows mean warming in the North warming (cooling) over the tropical North Atlantic
Atlantic without Amazon runoff, favoring a positive Ocean lowers (increases) the surface pressure lead-
phase of AMV (figure 3(c)) whereas, with a doub- ing to a weakening (strengthening) of low–level trade
ling of Amazon runoff, the mean SST shows a cool- winds and northward (southward) displacement of
ing to the north (Supplementary figure 4(c)). But, the summer ITCZ [43, 44]. When the AMV is positive,
typical SST pattern associated with a positive AMV the ITCZ prefers to migrate to the northern band
is a basin–wide warming in the North Atlantic and (towards underlying warmer water) bringing heavy
cooling to the south [10]. The tripolar SST pattern rainfall whereas the rainfall over the southern band
(figure 3(c)) found in the North Atlantic Ocean is diminishes. However, except over the western coastal
suggested to be induced by a negative NAO at inter- regions, the runoff–induced changes in simulated
annual timescales [42] as proposed by [23]. Dur- land rainfall (figures 4(a) and (b)) is not significant
ing a negative phase of NAO, the winds over the (significant regions are demarcated by black dots).
extratropical North Atlantic Ocean turn weaker and Timeseries of decadally smoothed difference in
thereby reduces the rate of deepwater formation [23]. AMV (black curve) and mean JAS rainfall (bar chart)
Thus the atmospheric response to the suppression of over the region delineated in figure 2 are shown for
Amazon runoff tends to weaken the AMOC. But, we 0AMZ (figure 4(c)) and 2AMZ (figure 4(d)) for the
find that the AMOC turns stronger in the absence of last hundred years. Evidently, the 100–200 years of
runoff, underlining the dominance of oceanic pro- JAS rainfall in 0AMZ enhances in the northern band
cesses. The strengthening of AMOC, despite a neg- associated with a basin–wide warming in the north
ative NAO, signifies the importance of oceanic pro- Atlantic (positive AMV). Though there are few years
cesses in the low–frequency variability of the Atlantic with negative rainfall years averaged over the box
Ocean. Further, we find that the rainfall response (8 years with a reduction of more than -0.25 mm
in the tropical Atlantic is closely associated with the day−1 ), the low–frequency positive rainfall episodes
AMV rather than NAO (a detailed analysis of the rel- are stronger in both magnitude and duration (34
ative roles of NAO and AMV on the Atlantic ITCZ is years with > 0.25 mm day−1 rainfall; figure 4(c)).
beyond the scope of this study). The effect of wind– Similarly, episodes of low rainfall dominated over
evaporation–SST (WES) feedback on the meridional the box enclosed in the 2AMZ case with only 7 pos-
see–saw of SST in the tropical Atlantic Ocean is neg- itive events and 93 negative events (figure 4(e)) in
ligible during summer (Supplementary figures 5(a) conjunction with negative AMV. In summary, the
and (b)). In Supplementary figure 5(b) we find that runoff–induced strengthening (weakening) of AMV
the cooling of SST in 0AMZ (black curve) leads to reinforces the rainfall in the northern (southern)
reduced evaporation in the southern tropical Atlantic zonal band of high decadal variance and diminishes
Ocean, suggesting the role of oceanic processes on (strengthens) to the south (north) when Amazon
tropical Atlantic ocean on longer timescales. There- runoff is intercepted (doubled). The response in rain-
fore, we propose that the Amazon runoff–induced fall for the individual months of June, July, and
strengthening of AMOC (largely driven by oceanic August in 0AMZ and 2AMZ also show similar meridi-
advective processes) and the resultant AMV plays a onal shifts in the ITCZ position (Supplementary fig-
major role in the cooling of the southern tropical ures 6(a)–(f)). However, the response to doubling of
Atlantic Ocean. Amazon is not exactly opposite to that of Amazon
7Environ. Res. Lett. 15 (2020) 054013 S Jahfer et al
shut down since the interactions in the climate sys- hydrology of the North Atlantic Ocean and the adja-
tem are highly non–linear. But, we find that the large– cent landmasses including West Africa whose eco-
scale features associated with AMV and Atlantic ITCZ nomy thrives on agriculture and related industries
◦
show opposite signals with and without Amazon run- [46]. The West African region between 10 N and
◦
off, adding robustness to the conclusions drawn in 20 N (comprising the Sahel) is one of the most vul-
this study. nerable regions since its economy and agriculture
largely relies on the rainfed water during summer
months [47]. Therefore, prolonged changes in rainfall
4. Summary and conclusions over the West African nations can significantly impact
freshwater availability and agriculture. As seen in
We have shown that the multidecadal variability of Supplementary figure 7(b), the inland river flow is
rainfall over the North Atlantic Ocean and West significantly affected by the changes in rainfall over
Africa is influenced by the freshwater input from the the catchment area. Though the conclusions reached
Amazon. The strength of multidecadal variability in are based on idealized freshwater modification exper-
SST (AMV) controls the low–frequency climate in iments and the forcing is exaggerated compared to
both the tropics and extratropics including the large– the natural variability, we attempt to explain the role
scale atmospheric circulation and rainfall pattern. of Amazon runoff on the multidecadal variability of
The atmosphere responds to the fluctuations in AMV SST and the overlying ITCZ. The experiments should
by an apparent north–south shift in the mean posi- be considered like numerous other freshwater hos-
tion of the ITCZ. A comprehensive understanding of ing studies wherein an unrealistically huge freshwa-
the factors affecting AMV is essential for the longterm ter is added or removed from the ocean, to assess the
prediction of ITCZ in the Atlantic sector since its latit- response of AMOC and its climatic implications. Fur-
udinal position is modulated by the AMV–driven SST thermore, carrying out century–long simulations by
anomalies [16, 45]. Our results reveal that freshwater increasing and decreasing Amazon runoff (based on
input into the tropical ocean is one of the factors that observed variability) is computationally expensive.
affect the AMV. The resultant change in rainfall signi- The results presented here signifies the importance
fies the vital role of Amazon discharge in modulating of incorporating river runoff in model simulations
the mean position and intensity of the Atlantic ITCZ for a better representation of salinity, temperature,
on multidecadal timescales. and rainfall. The results show that Amazon runoff has
Two sensitivity experiments were conducted using a vital role in the dynamics, thermodynamics, and
the CESM model to study the climatic role of Amazon freshwater cycle of the tropical Atlantic Ocean and
runoff by intercepting and doubling the Amazon West Africa.
discharge into the equatorial Atlantic Ocean. When
the Amazon runoff is suppressed, the upper ocean
Acknowledgments
responds by an increase in SSS and a strengthening of
the oceanic meridional circulation, carrying warmer
Computational facilities for the model simulations
South Atlantic water to the north. The AMOC and
were provided by Supercomputer Education and
AMV strengthen in the absence of Amazon run-
Research Centre (SERC) at IISc. This study was partly
off. As a result, the North Atlantic switches into
funded by the Divecha Centre for Climate Change
a warmer–than–normal phase, favoring a positive
and PNV acknowledges partial support from J. C.
AMV in the absence of runoff. The region of highest
Bose fellowship. Thanks to NCAR for providing the
rainfall response lies exactly over the region where
CESM1.0 source code and input data files.
the multidecadal variability is sensitive to the phase
of AMV. Thus the Amazon runoff affects the multi-
Data availability statement
decadal Atlantic ITCZ through its influence on basin–
wide temperature. In an alternate experiment, when
The data that support the findings of this study are
the runoff from Amazon is doubled, the SST and
available from the corresponding author upon reas-
rainfall response is opposite to the shutdown experi-
onable request.
ment. The 100–200 year difference in simulated rain-
fall in each of the summer months (July, August, and
September) signifies the sensitivity of Atlantic ITCZ ORCID iD
to the runoff–induced variability in the underlying
SST pattern (Supplementary figure 6). This suggests S Jahfer https://orcid.org/0000-0001-9602-3335
that a longterm significant variation in Amazon run-
off would affect the regional hydrological cycle over References
the West African nations as seen in Supplementary
[1] Hastenrath S and Lamb P 1978 Tellus 30 436–48
figure 7.
[2] Donohoe A, Marshall J, Ferreira D and McGee D 2013 J.
The factors affecting the longterm variability of Clim. 26 3597–3618
climate are of utmost importance for the regional [3] Mehta V M 1998 J. Clim. 11 2351–75
8Environ. Res. Lett. 15 (2020) 054013 S Jahfer et al
[4] Dieppois B, Durand A, Fournier M, Diedhiou A, Fontaine B, [25] Huang B and Mehta V M 2010 Adv. Atmos. Sci. 27 455–68
Massei N, Nouaceur Z and Sebag D 2015 Theor. Appl. [26] Hurrell J W et al 2013 Bull. Am. Meteorol. Soc. 94 1339–60
Climatol. 121 139–55 [27] Mulitza S, Prange M, Stuut J B W, Zabel M, von Dobeneck T,
[5] Arbuszewski J A, deMenocal P B, Cleroux C, Bradtmiller L Itambi A C, Nizou J, Schulz M and Wefer G 2008
and Mix A 2013 Nat. Geosci. 6 959–62 Paleoceanography 23 PA4206
[6] Martin E R, Thorncroft C and Booth B B 2014 J. Clim. [28] Castañeda I S, Mulitza S, Schefuß E, dos Santos R A L,
27 784–806 Damsté J S S and Schoutena S 2009 Proc. Natl Acad. Sci.
[7] Delworth T L and Zeng F 2012 Geophys. Res. Lett. 39 L13702 106 20159–63
[8] Peings Y and Magnusdottir G 2014 Environ. Res. Lett. [29] Knight J R, Folland C K and Scaife A A 2006 Geophys. Res.
9 034018 Lett. 33 L17706
[9] Sutton R T, McCarthy G D, Robson J, Sinha B, Archibald A T [30] Adler R F et al 2003 J. Hydrometeorol. 4 1147–67
and Gray L J 2018 Bull. Am. Meteorol. Soc. 99 415–25 [31] Gelaro R, McCarty W, Suarez M J, Todling R, Molod A,
[10] Zhang R, Sutton R, Danabasoglu G et al 2019 Rev. Geophys. Takacs L and Randles C A 2017 J. Clim. 30 5419–54
57 316–75 [32] Harris I, Jones P D, Osborn T J and Lister D H 2014 Int. J.
[11] Folland C K, Palmer T N and Parker D E 1986 Nature Climatol. 34 623–42
320 602–7 [33] Rayner N A, Parker D E, Horton E B, Folland C K, Alexander
[12] Rowell D P, Folland C K, Maskell K and Neil Ward M 1995 L V, Rowell D P, Kent E C and Kaplan A 2003 J. Geophys.
Q. J. R. Meteorol. Soc. 121 669–704 Res.: Atmos. 108 4407
[13] Zhang R and Delworth T L 2006 Geophys. Res. Lett. [34] Thorncroft C, Nguyen H, Zhang C and Peyrille P 2011 Q. J.
33 L17712 R. Meteorol. Soc. 137 129–47
[14] Feng S and Hu Q 2008 Geophys. Res. Lett. 35 L01707 [35] Stouffer R J et al 2006 J. Clim. 19 1365–87
[15] Alexander M A, Kilbourne K H and Nye J A 2014 J. Mar. [36] Sun C, Li J, Li X, Xue J, Ding R, Xie F and Li Y 2018 Environ.
Syst. 133 14–26 Res. Lett. 13 074026
[16] Shanahan T M, Overpeck J T, Anchukaitis K J, Beck J W, [37] Wang C and Zhang L 2013 J. Clim. 26 6137–62
Cole J E, Dettman D L and Peck J A et al 2009 Science [38] Latif M, Boning C, Willebrand J, Biastoch A, Dengg J,
324 377–80 Keenlyside N, Schweckendiek U and Madec G 2006 J. Clim.
[17] Tzortzi E, Josey S A, Srokosz M and Gommenginger C 2013 19 4631–7
Geophys. Res. Lett. 40 2143–7 [39] Rahmstorf S, Box J E, Feulner G, Mann M E, Robinson A,
[18] Dai A and Trenberth K 2002 J. Hydrometeorol. 3 660–87 Rutherford S and Schaffernicht E J 2015 Nat. Clim. Change 5
[19] Zeng N, Yoon J H, Marengo J A, Subrahmanyam A, Nobre C [40] Enfield D B, MestasNuñez A M and Trimble P J 2001
A, Mariotti A and Neelin J D 2008 Environ. Res. Lett. Geophys. Res. Lett. 28 2077–80
3 014002 [41] Knight J R, Allan R J, Folland C K, Vellinga M and Mann M
[20] Boisier J P, Ciais P, Ducharne A and Guimberteau M 2015 E 2005 Geophys. Res. Lett. 32 L20708
Nat. Clim. Change 5 656–60 [42] Cayan D R 1992 J. Phys. Oceanogr. 22 859–81
[21] Marengo J A and Espinoza J C 2016 Int. J. Climatol. [43] Lamb P J 1978 Tellus 240–51
36 1033–50 [44] Hastenrath S 1990 Int. J. Climatol. 10 459–72
[22] Latrubesse E M et al 2017 Nature 546 363–36 [45] Vellinga M and Wu P 2004 J. Clim. 17 4498–4511
[23] Jahfer S, Vinayachandran P N and Nanjundiah R S 2017 Nat. [46] Sultan B, Baron C, Dingkuhn M, Sarr B and Janicot S 2005
Sci. Rep. 7 10989 Agric. Forest Meteorol. 128 93–110
[24] Vinayachandran P N, Jahfer S and Nanjundiah R S 2015 [47] Diaconescu E P, Gachon P, Scinocca J and Laprise R 2015
Environ. Res. Lett. 10 054008 Clim. Dyn. 45 1325–54
9You can also read