Precision Stroboscopy, Voice Quality and Electrolaryngography1
←
→
Page content transcription
If your browser does not render page correctly, please read the page content below
Precision Stroboscopy, Voice Quality and Electrolaryngography1
           Adrian Fourcin, University College London & Laryngograph Ltd

1.     Aim

The aim of this brief overview is to introduce the use of Laryngograph voice
measurement equipment and to give some examples of the newer methods of voice
quality assessment that these techniques are beginning to make available. Special
reference is made to the use of these methods in,
• precision stroboscopy,
• the analysis of connected speech,
• and in regard to their auditory relevance.

2.     Background

The term “Electroglottograph” – or EGG for short, has become a generic name for a
simple electrical method for the non-invasive examination of vocal fold phonatory
vibration. The apposition of two electrodes on the alae of the thyroid cartilage provides
a circuit element which can be monitored either in terms of its impedance or in regard to
its admittance.

The technique was first applied to voice work by Fabre (1957) and he used a constant
current, impedance based, method of observation. He also introduced the term
“électroglottographie” considering that the main information derived from the device
was in respect of the glottal opening. In fact, however, the main information concerns
vocal fold contact, and it was for this reason, early on, that the term “Laryngograph”
was used (Lx is used here as an abbreviation for the resulting signal, now derived via a
constant voltage, admittance based, method).

The practical importance of vocal fold contact has since been established in several
ways. Direct synchronised cinematic/Lx observation of vocal fold movement with
different voice qualities (for example: Lecluse (1977); Donovan, Roach and Fourcin (in
Fourcin, 1974)), made it feasible reliably to infer the contribution to Lx waveforms
made by contact between the opposing faces of the vocal folds. Human experiments in
vivo by the interposition of a non-conducting strip within the glottis (Gilbert, Potter &
Hoodin (1984)) radically established the overriding importance of contact between the
folds to the Lx waveform. (Earlier work, based on electrical admittance measurements,
had shown that up to 4.5MHz resistance was potentially the more important electrical
contributor to the Lx waveshape than capacitance, Fourcin & Norgate (1965)). Cadaver
experiments have confirmed and extended these results. For instance using an excised
single canine vocal fold dynamically abutting a conducting viewing plate (Scherer,
Druker & Titze, 1988) the correspondence between conductance and contact area was
shown. Using excised human cadaver larynges the nature of the contact waveform as a
function of some of the physical factors influencing vibration was investigated
(Laukkanen, Vilkman & Laine, 1992).

Initially, essentially only the Lx signal was presented in the form of a waveform going
positive (up) for increasing vocal fold contact area (this was also Fabre’s aim, but his
1
 Reprinted from Chapter 13 of ‘Voice Quality Measurement’ (2000) Kent R.D.
and Ball M.J. (eds) San Diego: Singular Publishing Group
actual waveforms were positive for increasing glottal opening). As the result of the
work described above, and many other contributions, the near universal practice is now
to use both EGG as well as Lx information with positive contact polarity.

In normal voice the main acoustic excitation of the vocal tract coincides with vocal fold
closure and since this is a salient aspect (see Baken (1985) pp 221-227, for an excellent
discussion), the Lx signal is widely relied on to provide larynx frequency information.

Even though the separate contributions of the two vocal folds cannot be established
using Lx, the waveshape is also a potentially rich source of voice quality information.
In recent years this has led to the combined use of Lx waveform information together
with laryngeal stroboscopy. A first step towards routine clinical use was made by
Anastaplo and Karnell (1988) so that both synchronisation and waveshape came from
an Lx signal source.

A logical extension of this approach is to use a clinical desktop computer to control the
stroboscope on the basis of Lx period to period closure information. This gives two
advantages. First, the instant of illumination of the vibrating vocal folds can be
automatically adjusted so that an exact sequence of stroboscopic light pulses can scan
through successive periods, providing precision vocal fold images in the computer
memory for immediate subsequent animation/examination. Second, a longstanding
objection to stroboscopy itself can be, in some measure, avoided by the use of these
precisely defined single light flashes each uniquely linked both to a single image and to
a defined point on the reference Lx waveform. Pathological voices are often temporally
irregular and this variable periodicity makes it impossible with ordinary stroboscopy
both to freeze a picture at one point in the vibration cycle and also adequately to
interpret a sequence of images. By associating each single image with its corresponding
Lx/EGG waveform these familiar stroboscopic ambiguities are avoidable. This facility
has been incorporated in the LxStrobe system.

The first three figures attached have made use of LxStrobe to exemplify some of the
special features of Lx/EGG waveforms for three different normal voice qualities: modal,
breathy and falsetto.

Figure 1 shows a sequence of eight images uniformly spaced through one vocal fold
period during the production of modal voice by a normal speaker. Each of the pictures
is linked to the Lx waveform which was responsible for its illumination, and the
corresponding trigger instant is shown on that waveform. The images have been
automatically acquired to memory in a minimum of phonation time so, for this normal
speaker, there is no observable variation in the Lx waveform across the sequence.

In modal voice, the initial closure of the folds, shown by the sharp rise in the Lx
waveform, is well defined. This closure is responsible for the initiation of the very
marked acoustic response in the Sp (microphone) waveform shown above the lower Lx
signal (typically there is a small air path transmission delay of Sp relative to Lx).
Closed phase is also well defined and this interval of contact between the vocal folds
isolates the supra-glottal resonances from sub-glottal effects. The mucosal wave which
is so important to normal voice production is clearly seen in the seventh and eighth
strobe flash pictures.
Sp

                                                                     Lx

Figure 1        Modal Voice; adult male, 120 Hz
Above, a series of eight stroboscopically derived images of the vocal folds
with the corresponding Lx waveform under each image – together with its
trigger instant. Below, the Sp and Lx waveforms for the sixth image.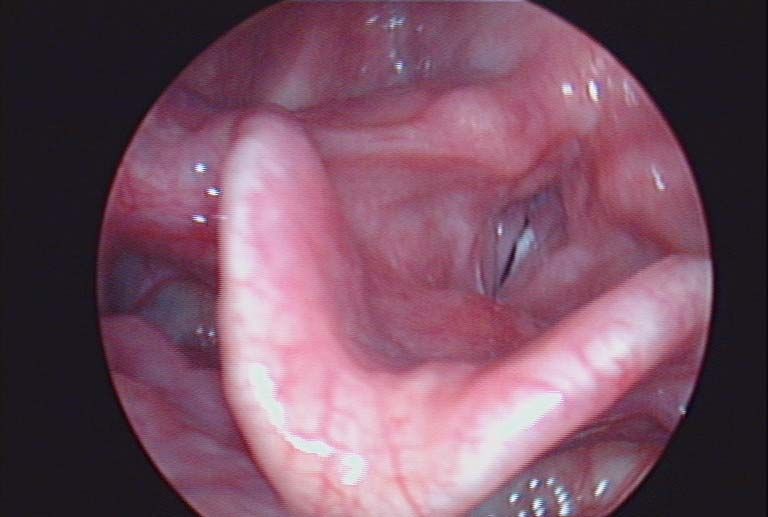
The breathy voice phonation quality shown in Figure 2 is characterised primarily by its
longer open phase. This is especially easy to see both in the Lx waveforms for each of
the strobe shots and in the Sp and Lx waveforms at the foot of the figure. During the
open phase the supra-glottal vocal tract is coupled to the sub-glottis and, as a
consequence, its resonances are more damped than for modal voice. Vocal tract
resonances are also less well defined in amplitude because this voice quality is
associated with a less rapid closing phase. An additional aspect of breathy voice, as its
name implies, is that it is associated with a frictional quality coming from glottal
turbulent air flow excitation. Although Lx is periodic this gives an auditorily
perceptible component of irregularity to the Sp waveform from period to period which
can just be seen in the Sp open phase intervals of the waveform figure.

The falsetto voice quality images and the speech and Lx waveforms displayed in Figure
3 show the main features of this phonation type by the length, and extension, of the
vibrating vocal folds, the lack of mucosal waves on their surfaces and the somewhat
sinusoidal Lx waveshape. This phonation type is also characterised by near sinusoidal
simplicity of vocal fold motion. The consequently less rapid vocal fold closures give a
relative lack of higher spectral components in the vocal tract excitation, and this is
reflected in a correspondingly simple Sp waveform.

3.     Subjective Assessment and Objective Evaluation

In many cases the original impetus to seeking a clinical check on voice function comes
from the auditory observation that there is a deficiency in voice quality – made by a
teacher, family, friends or in the workplace or by the speaker himself. Normality is
partly subjective, it can be culturally determined (eg Moore, 1971), phonetically defined
as a function of the language environment (eg Maddieson, 1984), or simply exist in the
ear of the particular listener (eg Aronson, 1985). Kent (1996) regards the clinician as
the final arbiter and in modern society this must be largely the case, at least
administratively, since final outcome measures depend on demonstrable results which
can only come from appropriate clinical investigation.

Auditory assessment is intrinsically difficult to administer in standard, repeatable
fashion and a number of clinical multi-dimensional scaling approaches have been
evolved to objectivise auditory subjective methods. Well known examples are: the
GRBAS scale from Japan (Hirano, 1981) and its extended form recently developed and
applied in Europe (Dejonckere, Remacle, Fresnel-Elbaz et al); in Sweden, Hammarberg
& Gauffin (SVEC, 1995) have worked on another comprehensive set of clinically
relevant voice descriptors with special reference to perception. Laver (1991) has
introduced a phonetically motivated set of dimensions, which, however, add further to
this real dilemma by confounding voice, in the sense of vocal tract excitation, with
attributes of the vocal tract setting. All these approaches suffer from the unresolved
problem of providing links between the levels of auditory description used and the
levels of objective analysis and measurement which it is convenient and possible to
apply clinically.

The auditorily based methods of voice quality assessment aim to give a basis for
quantification and they have the great advantage that they are applicable to connected
speech. The main techniques of objective evaluation, however, tend to be directed
towards the use of sustained sounds as the foundation for their measurements.
Prominent examples are the CSL system (Kay Elemetrics, Computer Speech
Sp

                                                                  Lx

Figure 2       Breathy Voice; adult male, 105 Hz
Eight stroboscopic images above, each with its triggering instant superimposed
on the corresponding Lx waveform. Sp & Lx waveforms below for image 6.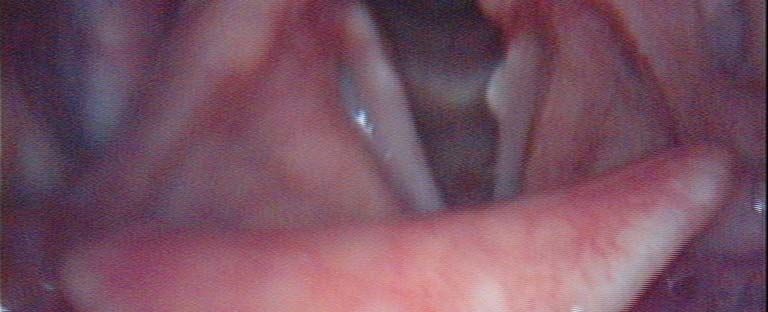
Sp

                                                                         Lx

Figure 3       Falsetto Voice; adult male, 323 Hz
Eight stroboscopic images above, each with its triggering instant superimposed
on the corresponding Lx waveform. Sp & Lx waveforms below for image 5.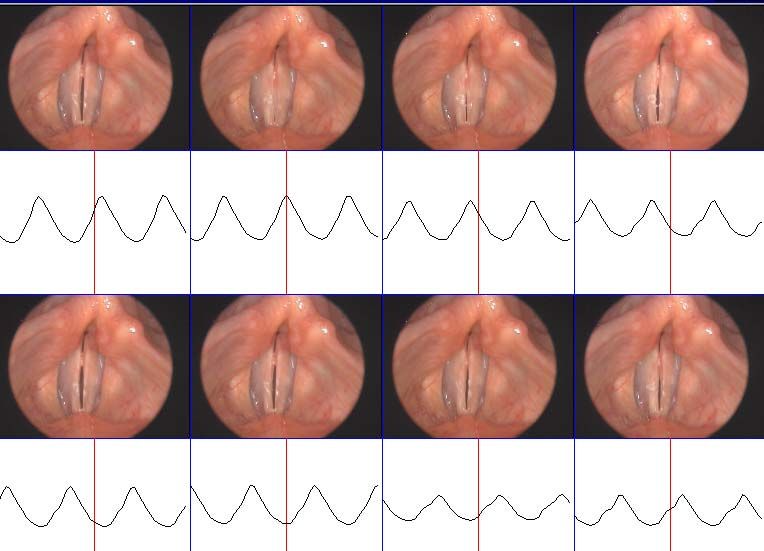
Laboratory) and the “Dr Speech” system (Tiger Electronics) worked on by Huang and
Minifie. A possible reason for this difference may arise from the obvious need to assess
connected “real-life” speech, which motivates subjective work, and the real difficulties
which arise in applying rigorous signal analytic techniques to real-life clinical material
(mobile telephone networks cannot even cope with some “normal” phonation).
The following examples of Lx based processing of clinically derived pathological
material are intended as a contribution towards the future solution of some of the
problems associated with the development of auditorily significant, rigorous methods of
objective speech, and voice quality, analysis.
4. Laryngograph data and the objective analysis of connected pathological
speech
[The following four sets of data were derived from Mr Julian McGlashan’s Voice Clinic
at QMC Nottingham. The LxStrobe observations were in each case routinely preceded
by a speech and laryngograph recording session organised by Ms Beverly Towle. In
each case the connected speech sample had a duration of about 2 minutes.]
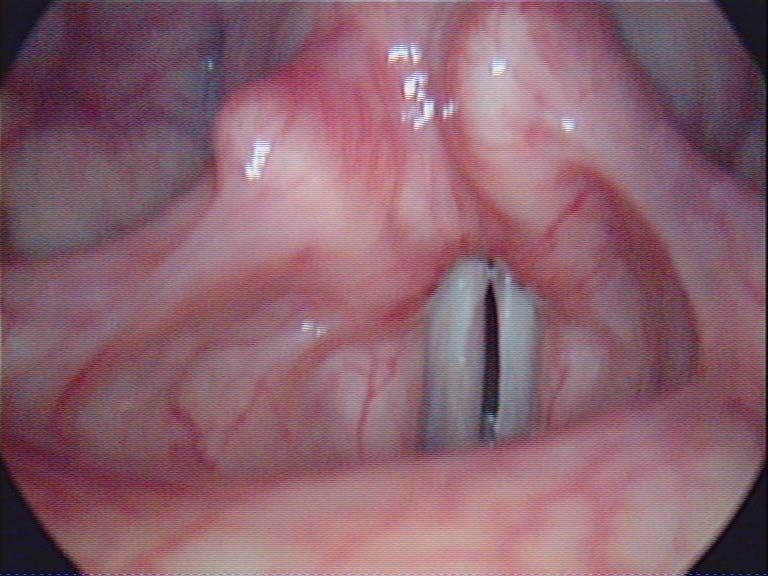
Figure 4(a) gives an open phase view taken from a sequence of eight images uniformly
spaced so as to cover, within a sustained utterance, one vocal fold period, as for figures
1, 2 & 3.
The speaker is a woman of 35 years who had previously had a left vocal fold cyst
removed. Subsequent to this visual inspection it was found that her left vocal fold
epithelium was very adherent to the underlying ligament. Her preferred “comfortable”
frequency of sustained phonation was around 300Hz, a quite abnormally high value.
The use of the laryngograph (Lx) recording makes it possible to make two more
complete quantitative checks. The simple larynx frequency distribution of Figure 4(b),
[called DFx1] shows that this very high pitch has been chosen because it is at the
dominant mode. Although the overall shape of the distribution is grossly abnormal, the
sub-mode at 160Hz is appropriately placed and shaped. It is interesting to note that in
the region of 300Hz the ratio of vocal fold contact duration to period (Qx) in fig 4(c),
often an indication of good voice quality, is abnormally large. In auditory terms, the
two quantitative distributions are related to the subjective impression of a very hoarse,
irregular voice [from DFx1], with an unnaturally dominant high pitched component,
[from both DFx1 and Qx].
These examples of Lx based processing could not be obtained either as easily or as
reliably from the acoustic signal (Sp) alone. The “instantaneous” frequency, Fx, which
is measured on a period by period basis from Lx, is especially suitable for the analysis
of most pathological voices. And the contact phase ratio within a single period, Qx, can
be at least usefully estimated again from the Lx/EGG signal (the values used here are
taken from period by period ratio estimates of Lx closure width, 70% down from each
positive peak, to the instantaneous period Tx).
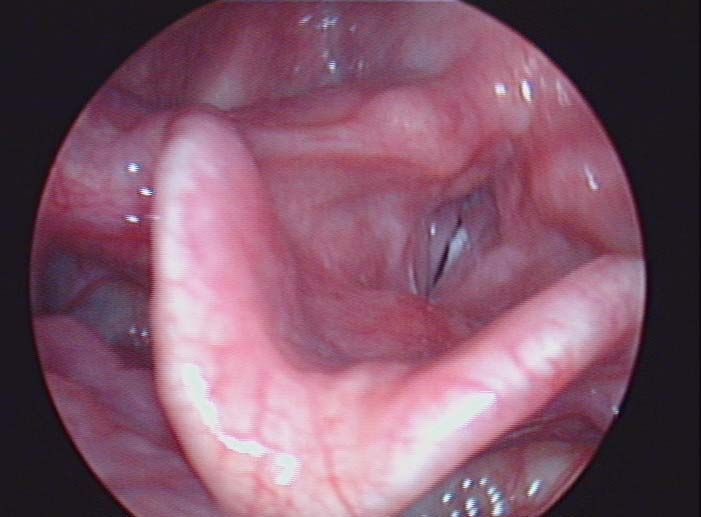
Figure 5(a) is from another stroboscopic larynx period related sequence, here for a man
of 57 years with a voice use problem. Neither this image nor the waveforms indicate
any special source of difficulty. Figure 5(b), however, taken with the folds retracted,
shows a granuloma. The distribution of figure 5(c), with its marked step down above
100Hz, also shows an abnormal condition. By using the temporal accuracy of the Lx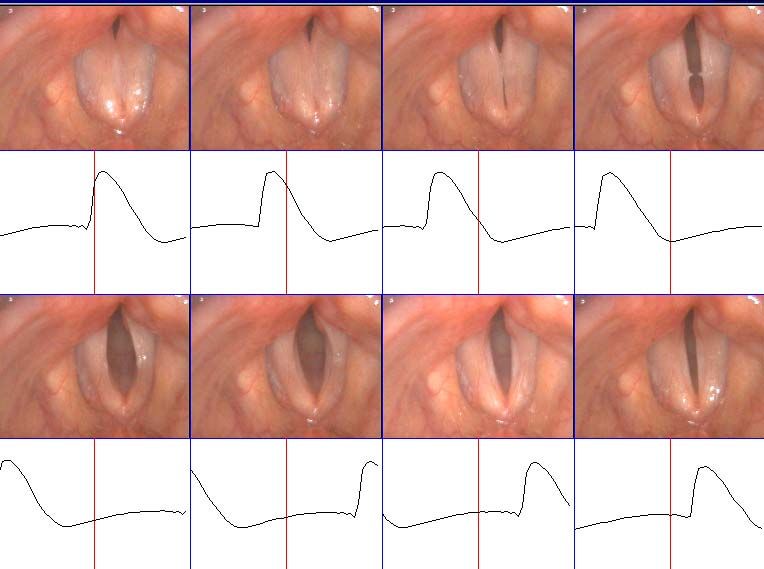
Sp
                                                                             Fx = 310Hz

Lx                                      strobe trigger

Figure 4(a)    Left vocal fold scarring – speaker CW

The image shows a single shot, in the middle of the open phase, from a
stroboscopic sequence using LxStrobe to cover the interval of one period.
The acoustic, laryngograph, and strobe trigger (centre) signals are below.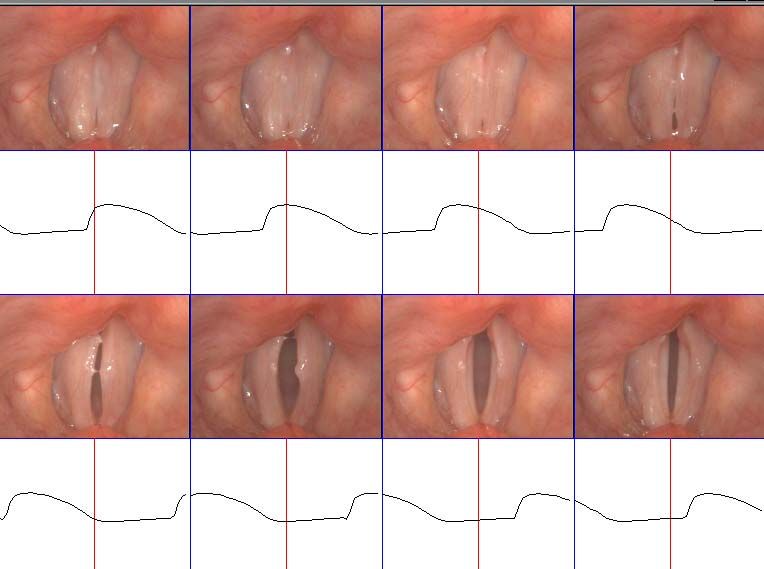
DFx1                        Figure 4(b) DFx1
                                   CW cont1.SPE
                       20
                                                              Lx
                                                                    Larynx frequency distribution
                                                                    Since the laryngograph signal
                       10                                           makes it easy to detect each
                                                                    vocal fold closure on a period
                        5                                           by period basis, even very
                                                                    irregular phonatory activity can
Probability ( %)

                                                                    be measured. The simple larynx
                        2                                           period distribution shown here
                                                                    for speaker CW, has three
                        1                                           modal peaks. Only the central
                                                                    mode is appropriate, the others
                       0.5                                          arise from the pathology − but it
                                                                    is the highest which is typically
                                                                    chosen at “comfortable pitch”,
                       0.2
                             50   100         200       500
                                                                    as in the stroboscopic image.
                                        Fx (Hz)

                                        QxFx1
                                   CW cont1.SPE
                       80
                                                               Lx      Figure 4(c) QxFx
                       74                                              Quality Index Distribution
                       68
                                                                       Contact phase ratio is one of
                                                                       the indices of good quality
                       62
                                                                       voice production and the Lx
                       56                                              signal can be used to give a
                                                                       useful indication of this
             Qx ( %)

                       50
                                                                       parameter, Qx. The
                       44                                              distribution on the left shows
                       38
                                                                       Qx plotted against Fx. The
                                                                       main concentration of high
                       32
                                                                       closed phase ratio voicing is at
                       26                                              the abnormal mode, in the
                                                                       vicinity of 300Hz.
                       20
                             50   100             200   500
                                        Fx (Hz)
Sp
Fx = 157Hz
Lx
Figure 5a Speaker DC
Open phase view above; Sp & Lx waveforms and trigger for this view
Figure 5b Speaker DC1
Granuloma of the left vocal fold process – visible during abduction
(mucus anterior to the granuloma)DFx2
DC cont.SPE
20
Lx Figure 5(c) DFx2
10
The second order larynx
frequency distribution on
5
the left is produced by
only counting the
Probability ( %)
occasions when two
2 successive vocal fold
periods fall into the same
1 Fx frequency bin. This
picks up regularity in the
0.5 speech sample – there is a
break around 120 Hz
0.2
50 100 200 500
Fx (Hz)
QxFx1
DC cont.SPE
80
Lx
Figure 5(d) QxFx
74
Qx, the distribution of
68 contact phase ratios is
62 shown here as in figure
4(c). The speaker has an
56
evident reduction in
Qx ( %)
50 closed phase ratio for the
44 upper part of his register,
and this change in Qx
38
corresponds exactly with
32
the break in the larynx
26 frequency distribution.
20
50 100 200 500
Fx (Hz)
VRP1
DC cont.SPE
120
Lx
112
Figure 5(e) VRP1
This distribution is the
104
familiar phonetogram but
96 applied to connected speech
88
rather than sustained sounds;
intensity is plotted against
Ax (dB)
80 larynx frequency, Fx. There
72 is, however, no smoothing
and the same sample of
64
connected speech is used.
56 This plot shows how the
48
intensity is also reduced for
the upper part of the register.
40
50 100 200 500
Fx (Hz)signal it is possible to produce larynx frequency distributions which seek out vocal fold vibrational regularity – here by only plotting those occasions when two successive periods have essentially the same value (DFx2). A marked reduction in regular vibration is evident from about 120Hz. Above this vocal fold frequency, the Qx distribution, Figure 5(d), is also rather broken, indicating poor closure duration control in the upper register. The control of loudness is similarly affected above 120Hz as shown by the simple connected speech phonetogram in Figure 5(e) (VRP1, in which Fx is, as above, the instantaneous frequency per period and the intensity is derived from the Lx gated acoustic peak in each Sp period). The three plots relate respectively to important subjective aspects of pitch, projection and loudness. The single image shown in Figure 6(a) is taken from a lady of nearly 80 years with previous mild candidiasis. Her sustained voice is of good quality. Her speaking voice is, however, mildy irregular and she complains of its being of low pitch. Both DFx1 and the Qx distributions are not pathological (although the influence of age is shown by the rather ragged shape of DFx1). The third distribution, (CFx), in Figure 6(d) gives the clue to the auditory component of her voice complaint. For normal voice (Fourcin (1979)) plotting the frequencies of successive vocal fold vibrations against each other gives a well defined single diagonal distribution – an indication of regularity of vibration. Different pathologies give different types of deviation from this diagonal. Speaker CW for instance, has a main diagonal which has three distinct parts and two outliers corresponding to the abnormal frequency modes. The present analysis shows a quite distinct type of irregularity in which over a large part of the voice frequency range there are structured departures from regularity coming from a tendency for a low frequency larynx pulse to be followed by a high – and vice versa. This voice quality characteristic, when it occurs through range of larynx frequencies, leads to the presence of three parallel lines in the CFx distribution. In the low pitch register of the voice this is often referred to as creaky voice (an irregular paired alternance of well and poorly defined vocal fold closures) but here it is spread abnormally into the higher frequencies. This effect would give an impression of roughness even at modal pitches and could account for the speaker’s own auditory impression of low voice pitch in spite of the presence of a higher than normal range. Figure 7(a) is for a male speaker of nearly 50 years with workplace induced laryngitis. His Lx waveform is abnormal in regard to its opening/open phase shape and his DFx1 (basic voice frequency distribution in Figure 7(b)) very broad. The second order larynx frequency distribution (DFx2), which picks out regularity in the voice recording, shows a core of well defined voice pitch which is at the heart of his speech. The use of the very simple technique of plotting paired regularities has been applied in Figure 7(c) to the Sp/Lx phonetogram analysis of the two minute connected speech sample in regard to both larynx period and speech intensity (on a larynx synchronous basis). This VRP2 plot shows that his speech has a core of intensity regularity as well as larynx frequency. In each one of these four pathological voice samples, derived from connected speech, a different aspect of voice quality has been made viewable by the use of simple Lx based processing. But also in each case there is a quantitative analytic aspect of the work which gives the basis for a rigorous approach to voice quality management that can complement other clinical methods. Speech and laryngograph data files or recordings also provide a basis for comparison over time and contribute to reliable litigation archives.
Sp

                                                                      Fx = 351Hz

                                                                         Lx

Figure 6(a) Speaker MF
An open phase stroboscopic image is shown above together with the speech and
laryngograph waveforms that accompanied it and its trigger instant.
The images and waveforms show no sign of the irregularity found in connected speech
DFx1
MF cont.SPE
20
Lx
Figure 6(b) DFx1
10 The first order Fx
distribution is for the
5
female voice of fig 6(a).
The slight vocal fold
Probability ( %)
asymmetry seen in the fig
2 6(a) seems to have given
rise to the characteristic
1 broad larynx frequency
distribution which is often
0.5 associated with mild vocal
fold vibrational irregularity
0.2
50 100 200 500
Fx (Hz)
QxFx1
MF cont.SPE
80
Lx
74 Figure 6(c) QxFx
The heart of the contact
68
phase ratio distribution, of
62 Qx against Fx, is fairly well
56 formed and shows this
aspect of the voice to be
Qx ( %)
50
under appreciable control in
44 the whole of the centre
38
register, even though there
are outlying irregularities.
32
26
20
50 100 200 500
Fx (Hz)
CFx
MF cont.SPE
Lx Figure 6(d) CFx
The larynx frequency
500 cross-plot on the left
simply indicates the
relation between
successive pairs of vocal
200
fold periods each of which
Fx2 (Hz)
has been analysed in the
100
sample of connected
speech. Normally only a
single slim diagonal is
50 found, but here
irregularity gives three
lines with a broad centre.
50 100 200 500
Fx1 (Hz)Sp
Fx = 104Hz
Lx
trigger
Figure 7(a) Speaker SK Acute Chronic Laryngitis
The view has been taken, as shown by the trigger marker, midway between two
closures in what would ordinarily be a well defined open phase. The speech and
laryngograph waveforms are at the modal frequencyDFx1&2
SK cont.SPE
20
Lx
Figure 7(b)
DFx1,2
10 The basic larynx
frequency distribution,
DFx1 (red), based on a 2
5
minute sample of
Probability ( %)
connected speech, is wide
and ill-formed. The
2 second order distribution,
DFx2, using the same
1 recording, shows by its
height and shape that
there is a core of well-
0.5
structured voice of
potentially good quality.
0.2
50 100 200 500
Fx (Hz)
VRP2
SK cont.SPE
160
Lx Figure 7(c) VRP2
152
The standard first order
connected speech
144 phonetogram for this
136
speaker is very dispersed
in both frequency and
128 intensity. This second
Ax (dB)
order phonetogram,
120
however, which only
112 shows those pairs of
periods falling in the
104
same Ax/Fx bin,
96 indicates the existence of
a core of voice regularity
88 now in intensity as well
80
as larynx frequency.
50 100 200 500
Fx (Hz)5. Laryngograph data and voice quality in the speech of the deaf In a companion chapter, E Abberton gives an overview of work concerning the “Voice Quality of Deaf Speakers”. Her discussion covers a very wide range of important features and gives instances of the application of EGG/Lx type approaches not only in respect of analysis but also in regard to assessment, training and the design of special speech pattern element hearing aids. The quantitative methods discussed here for speech pathology are also, as she has mentioned, applicable to the analysis of the speech of the deaf. Even though the typical deaf speaker has no laryngeal pathology, the lack of appropriate auditory feedback control can give rise to abnormal voice and Lx information can be of basic assistance in its measurement, understanding and improvement via interactive training. Abberton refers to the work of Cowie, R., Douglas-Cowie, E. and Rahilly, J. (1988) who report on work in regard to “timing, intensity range, pitch height and change, and frication”; and also to Jones, C. (1967) who uses the descriptors “tense, flat, breathy, harsh, throaty, monotone, lack of rhythm, poor carrying power”. Lx factors can be of very great help in the investigation of many of these factors and in the following very brief discussion, the voices of two speakers are examined by applying methods which follow naturally once the Lx information is available. Both speakers are ten year old boys. A is normally hearing, B is congenitally profoundly deaf but has been educated in an intensively oral environment. Figure 8 shows particular examples of the voices of these two boys taken from recordings of their connected speech: (a) is for A and (b) is for the congenitally deaf boy B (it is important to note that A has read a standard text whilst B, who has poor reading ability has described a familiar set of pictures). In each plot the lower trace is of Fx, the period by period fundamental frequency modulated in width by the amplitude of the acoustic signal, and the upper part of each plot is the wide band spectrum of their fricatives (both voiced and unvoiced). It is not possible to generalise on the basis of such a meagre amount of data but the figures do give a striking indication of what really does happen when, as will be seen below, much longer samples are analysed. A has well defined intervals of frication and good control of Fx range and voicing durations. By comparison, B has a tendency to produce very brief intervals of both frication and voicing. Figure 9 shows the results of analyses of intervals of frication in long samples of connected speech for the two boys (>3minutes, two channel Sp & Lx). The striking differences between the plots of Figure 8 are now verified and it is evident that the hearing boy has frication segments which do tend to be of greater duration. Cowie et al’s reference to timing and frication effects and Jones’ comment on lack of rhythm are relevant here. In Figure 10 a similar comparison is possible between the distributions of voicing intervals in the same samples of connected speech. Once more there is a quite striking dissimilarity. A has much longer voicing durations than B and this is a quantitative reflection of many of the auditory descriptors given for voicing onset and intonation control in the speech of the deaf. In the two cases in fact the Fx ranges are very similar although the patterns of intonation control within the ranges are markedly different.
Figure 8(a)    Speaker A      Normally hearing boy – connected speech

Figure 8(b)    Speaker B      Congenitally deaf boy – connected speech

Note:
The upper half of each trace is for frication; the lower half for voiced sounds, two
octaves from 120Hz to 480Hz and 4s duration, these Fx traces are controlled in
width by the acoustic amplitude for each period.
50                                                                         50

                   20                                                                         20
Probability ( %)

                                                                  Probability ( %)
                   10                                                                         10

                    5               normally hearing                                                    5                  congenitally
                                                                                                                           profoundly deaf

                    2                                                                                   2

                    1                                                                                   1
                        0      50     100    150       milliseconds                                         0        50        100     150
                                               F i                                                                                       F i

      Figure 9                  Distribution of intervals of frication in long samples of connected speech
                                Speaker A on the left; Speaker B on the right

                   50                                                                                       50

                   20                                                                                       20

                                      normally hearing                                                                           congenitally profoundly
Probability ( %)

                                                                                     Probability ( %)

                   10                                                                                       10                   deaf

                    5                                                                                       5

                    2                                                                                       2

                    1                                                                                       1
                        0      50     100    150    200   250                                                    0        50     100     150
                                                   V i  I
                                                         milliseconds

                   Figure 10        Distribution of voicing intervals in long samples of connected speech
                                    Speaker A on the left; Speaker B on the right
SPB(4) Acott1.spe
100
Lx
90
80
70
60
Qx ( %)
50
40
30
20
10
0
100 200 500
Fx (Hz)
Figure 11(a) QxFx Distribution of vocal fold contact intervals
Speaker A – normally hearing boy
Greg1.spe
100
Lx
90
80
70
60
Qx ( %)
50
40
30
20
10
0
100 200 500
Fx (Hz)
Figure 11(b) QxFx Distribution of vocal fold contact intervals
Speaker B – congenitally profoundly deaf boy
Note the lower average value and greater irregularity and spread of Qx for
the deaf speechFinally, the important aspect of voice quality, QxFx, used for example in Figure 6(c) above for the examination of pathological speech, is measurable by analysing the distribution of contact phase intervals in the voicing segments of the two recordings. These Qx distributions, Figure 11(a) & (b), once more show that there are striking quantifiable differences between the voices of the two children. The voice of B has a tendency to considerably lower values of Qx – an indicator of breathy voice quality, and a smaller range of control across the span of larynx frequency. On the other hand speaker A is already producing a patterning of Qx control which tends (by its uniformity across Fx) to be like that of the adult male. 6. In Conclusion The main contributions to voice quality analysis which are presently made possible by Laryngograph type approaches come from the special physical properties of the equipment and the very close relation between the signal and the processes of voice generation and control. • Non-invasive sensing gives acceptable access to a wide range of speaker populations • Response primarily only to vocal fold contact provides an effectively unrivalled accurate basis for larynx frequency measurement. • Acoustic noise immunity is a special advantage for data gathering in many work environments (including the hospital voice clinic), and in the quiet this facility gives an extremely useful basis for frication detection. • The duration of vocal fold contact is represented in the laryngograph waveform with sufficient accuracy to give a basis for closed quotient comparison. The particular examples discussed above have tended to concentrate on the links which can be made between objective measurement using Lx type signals and the use of auditory dimensions of voice quality description. This is an increasingly important area of development. The measurement techniques described are able to provide one way of escaping from the current clinical bias towards the utilisation of data [sustained vowels for example] not so much because it is important in real life as because it is convenient in use for the investigator. The two-minute speech samples (of Sp & Lx) used are easy to obtain and representative of major speech factors such as onset, offset, register change and vocal tract/larynx interactions which are largely absent from sustained samples. Acknowledgements In addition to Mr Julian McGlashan and Beverly Towle and their colleagues at QMC Nottingham and Dr Elisabeth Fresnel of the Laboratoire de la Voix, Paris, it is a pleasure to acknowledge the laryngograph, stroboscopic and analytic resources which have been developed by Colin Bootle, Xinghui Hu and David Miller at Laryngograph Ltd. and used for the figures and discussions of this chapter.
7.       REFERENCES
Aronson, A. E. (1985) Clinical Voice Disorders. 2nd edition Thieme Inc. NY
Anastaplo, S. & Karnell, M.P. (1988) Synchronized videostroboscopic and
electroglottographic examination of glottal opening. J.A.S.A 83, 1883-1890
Baken, R. J., (1987) Clinical Measurement of Speech and Voice. Little, Brown &
Company, Mass USA.
Cowie, R., Douglas-Cowie, E. and Rahilly, J. (1988) The intonation of adults with
postlingually acquired deafness: anomalous frequency and distribution of elements. In
B. Ainsworth and J. Holmes (Eds) Proceedings SPEECH '88, 7th FASE Symposium,
Edinburgh, 2, 481-487.
Dejonckere, Ph., Remacle, M., Fresnel-Elbaz, E., Woisard, V., Crevier-Buchman, L.,
Millet, B. (1996) Differentiated perceptual evaluation of pathological voice quality:
reliability and correlations with acoustic measurements. Rev. Laryngol. (Bordeaux)
117, 219-224
Fabre,P., (1957) Un procédé électrique percutané d’inscription de l’accolement
glottique au cours de la phonation. Bull. Nat. Méd., 141, 66-99
Fourcin, A, & Norgate, M.(1965) Measurement of trans-glottal impedance. Progress
Report, Phonetics laboratory University College London, pp 34−40
Fourcin, A., Abberton, E. (1972) First applications of a new laryngograph Volta
Review, 69, 507-518 {reprinted from Med. & Biol. Illustration 21, (1971), 172-182}.
Fourcin, A.J., (1974) Laryngographic examination of vocal fold vibration. in B.Wyke
(ed.) Ventilatory and Phonatory Control Systems. OUP 1974, pp. 315-333
Fourcin, A.J.,(1981) Laryngographic Assessment of Phonatory Function ASHA Reports
#11 pp116−127
Gilbert, H.R., Potter, C.R., & Hoodin, R (1984), Laryngograph as a measure of vocal
fold contact area. J. Speech Hear Res., 27, 178-182
Hammarberg, B. & Gauffin, J., (1995) Perceptual and acoustic characteristics of quality
differences in pathological voices as related to physiological aspects,. in O. Fujimura &
M.Hirano (eds.) Vocal Fold Physiology pp. 283-303
Hirano, M., (1981) Clinical Examination of Voice. New York, Springer-Verlag
Jones, C. (1967) 'Deaf Voice' - a description derived from a survey of the literature.
Volta Review, 69, 507-8.
Kent, R.D., (1996) Hearing and Believing. Am. J. Sp-Lang Path., 5, 7-23
Laukkanen, A.-M., & Vilkman, E. Tremor in the Light of Sound Production with
Excised Human Larynges in P.H. Dejonckere, O.Hirano, J. Sunberg, (eds.) Vibrato
1995, Singular Publishing, pp. 93-110
Laver, J. (1991), The Gift of Speech Edinburgh Un. Press
Lecluse, F.L.E., (1977) Elektroglottografie. Drukerijelinkwijk B.V.
Maddieson, I., (1984) Patterns of Sounds, CUP Cambridge
Scherer, R.C., Druker, D.G. & Titze, I.R. Electroglottography and Direct Measurement
of Vocal Fold Contact Area. in O. Fujimura (ed.) vol.2, Vocal Fold Physiology, Raven
Press, pp. 279-291
Moore, G. P., (1971) Organic Voice Disorders. Englewood Cliffs, N.J., Prentice-Hall
Appendix The appendix contains nine figures which have been included in order to provide supplementary information relating to the relation between sustained vowel analyses and those, as in the main body of the text, based on connected speech. The first page of figures is for a normal man, VW. In these distributions the previously discussed analyses are here applied to this normal voice and show how very clearly defined are the basic pitch, regularity, loudness and closure ratio distributions. The second page gives the results of analyses of a sustained vowel produced by the previously discussed patient CW; whilst the third page summarises the analyses of her connected speech. Whilst the sustained vowel analyses were not very informative the connected speech analyses give a profoundly different overview − which is of value in many surgical and therapeutic aspects of management. The fourth page of analyses is again based on the use of a sustained vowel but this time for patient DC. Once more in comparison with the set of connected speech analyses shown on the following fifth page the sustained sound is seen to be a poor indicator of pathology. The sixth and seventh pages apply these same procedures to data from patient MF and the eighth and ninth pages are for patient SK − both previously presented in the main body of the text. These very brief comparisons of the two approaches − sustained vowel and connected speech − show how very powerful is the use of connected speech when appropriately analysed.
DFx1&2                                                            VRP1&2
                                   Arthur 1 normal.SPE                                               Arthur 1 normal.SPE
                    20                                                              100
                                                                Lx                                                                 Lx
                                First and second order                              92
                                                                                          First and second order
                    10
                                frequency histogram                                 84
                                                                                          connected speech
                     5                                                              76
                                                                                          phonetogram
Probability ( %)

                                                                                    68

                                                                     Ax (dB)
                     2                                                              60

                                                                                    52
                     1
                                                                                    44

                   0.5                                                              36

                                                                                    28

                   0.2                                                              20
                           50       100          200      500                                 50      100          200     500
                                           Fx (Hz)                                                           Fx (Hz)

                                                       Normal connected speech VW
                                           CFx                                                              QxFx1&2
                                   Arthur 1 normal.SPE                                               Arthur 1 normal.SPE
                                                                                    70
                                                                Lx                                                                 Lx
                                                                                    64
                   500   Frequency crossplot                                              First and second order distribution of
                         Irregularity 6.11%                                         58
                                                                                          contact quotient vs frequency
                                                                                    52

                                                                                    46
                   200
Fx2 (Hz)

                                                                          Qx ( %)
                                                                                    40

                                                                                    34
                   100

                                                                                    28

                                                                                    22
                   50

                                                                                    16

                                                                                    10
                           50       100          200      500                                 50      100          200     500
                                          Fx1 (Hz)                                                           Fx (Hz)
Sp Lx Fx CW – sustained vowel analysis
DFx1&2                                                      VRP1&2
                                      CW cont1.SPE                                                CW cont1.SPE
                    20                                                                120
                                                               Lx                                                         Lx
                                                                                      112
                    10
                                                                                      104

                     5                                                                96
Probability ( %)

                                                                                      88

                                                                        Ax (dB)
                     2                                                                80

                                                                                      72
                     1
                                                                                      64

                   0.5                                                                56

                                                                                      48

                   0.2                                                                40
                             50      100          200    500                                50   100          200   500
                                            Fx (Hz)                                                     Fx (Hz)

                                            CFx                                                        QxFx1&2
                                      CW cont1.SPE                                                CW cont1.SPE
                                                                                      80
                                                               Lx                                                         Lx
                                                                                      74
                   500
                                                                                      68

                                                                                      62

                                                                                      56
                   200
Fx2 (Hz)

                                                                            Qx ( %)
                                                                                      50

                                                                                      44
                   100

                                                                                      38

                                                                                      32
                   50
                         Irregularity 61.45%                                          26

                                                                                      20
                            50      100           200    500                                50   100          200   500
                                           Fx1 (Hz)                                                     Fx (Hz)

                                                        CW - connnected speech analysis
Sp Lx Fx DC – sustained vowel analysis
DFx1&2                                                                     VRP1&2
                              D:\collections\spedata\DC.spe                                               D:\collections\spedata\DC.spe
                   20                                                                          120
                                                                     Lx                                                                         Lx
                                                                                               112
                   10
                                               Discontinuity                                   104

                    5
                                               from 120Hz                                       96
Probability ( %)

                                                                                                88

                                                                               Ax (dB)
                    2                                                                           80

                                                                                                72
                    1
                                                                                                64

                   0.5                                                                          56

                                                                                                48

                   0.2                                                                          40
                         50         100          200           500                                   50        100          200           500
                                           Fx (Hz)                                                                    Fx (Hz)

                                           CFx                                                                       QxFx1&2
                              D:\collections\spedata\DC.spe                                               D:\collections\spedata\DC.spe
                                                                                                80
                                                                     Lx                                                                         Lx
                                                                                                74
                   500
                                                                                                68
                                  Irregularity 23%
                                                                                                62

                                                                                                56
                   200
Fx2 (Hz)

                                                                                     Qx ( %)
                                                                                                50

                                                                                                44
                   100

                                                                                                38

                                                                                                32
                   50

                                                                                                26

                                                                                                20
                         50         100          200           500                                   50        100          200           500
                                          Fx1 (Hz)                                                                    Fx (Hz)

                                                              DC – connected speech analysis
Sp
Lx
Fx
MF – sustained vowel analysisDFx1&2 VRP1&2
MF cont.SPE MF cont.SPE
20 160
Lx Lx
152
10
144
5 136
Probability ( %)
128
Ax (dB)
2 120
112
1
104
0.5 96
88
0.2 80
50 100 200 500 50 100 200 500
Fx (Hz) Fx (Hz)
CFx QxFx1&2
MF cont.SPE MF cont.SPE
80
Lx Lx
500
Irregularity 13.92% 74
68
62
56
200
Fx2 (Hz)
Qx ( %)
50
44
100
38
32
50
26
20
50 100 200 500 50 100 200 500
Fx1 (Hz) Fx (Hz)
MF – connected speech analysisSp
Lx
Fx
SK – sustained vowel analysisDFx1&2 VRP1&2
SK cont.SPE SK cont.SPE
20 160
Lx Lx
152
10
144
5 136
Probability ( %)
128
Ax (dB)
2 120
112
1
104
0.5 96
88
0.2 80
50 100 200 500 50 100 200 500
Fx (Hz) Fx (Hz)
CFx QxFx1&2
SK cont.SPE SK cont.SPE
80
Lx Lx
74
500
68
62
56
200
Fx2 (Hz)
Qx ( %)
50
44
100
38
32
50
Irregularity 24.69% 26
20
50 100 200 500 50 100 200 500
Fx1 (Hz) Fx (Hz)
SK – connected speech analysisYou can also read