The triangle-bisection illusion
←
→
Page content transcription
If your browser does not render page correctly, please read the page content below
Perception, 2009, volume 38, pages 321 ^ 332

doi:10.1068/p5866

The triangle-bisection illusion À

Stuart Anstis, Richard Gregoryô, Priscilla Heard½
Department of Psychology, University of California San Diego (UCSD), 9500 Gilman Drive, La Jolla,
CA 92093-0109, USA; e-mail: sanstis@ucsd.edu; ô Department of Psychology, University of Bristol,
8 Woodland Road, Bristol BS8 1TN, UK; e-mail: Richard.Gregory@bris.ac.uk; ½ Department of
Psychology, University of the West of England, Frenchay, Bristol BS16 1QY, UK;
e-mail: priscilla.heard@uwe.ac.uk
Received 9 July 2007, in revised form 29 July 2008; pulished online 2 March 2009

Abstract. In the triangle-bisection illusion, a dot is inscribed exactly halfway up the height of an
equilateral triangle, but it looks apparently far more than halfway up. The illusion is found
for second-order triangles defined by stereo depth and by equiluminous texture. It is strongest for
equilateral triangles, and even stronger for concave triangles with curved sides. We propose that
the observers are probably responding to the centre of area or centre of gravity of the triangle
rather than to its half-height.

1 Introduction
In the little-studied triangle-bisection illusion (Piaget and Pe©ne 1955; Robinson 1972/
1998; Seckel 2000, illusion 108), a dot is inscribed exactly halfway up the height of an
equilateral triangle, but it looks apparently far more than halfway upömuch closer to
the apex than the base of the triangle. In this paper we examine various properties of
this illusion and show that it is strongest for equilateral triangles with angles of 608.
It still occurs for triangles that are defined by stereo depth (Julesz 1971) or by equi-
luminous textures, and this rules out any explanation based upon simple spatial filtering
(Morgan 1996). It is isotropic, being equally strong along all three axes of an equilateral
triangle, so there is nothing special about vertical. It is much increased when the sides
of the triangle are curved inward to make a concave, bottom-heavy triangle, and
reduced when the sides are convex and bulge outwards. It is stronger when the bisec-
tion spot is replaced by a grey diamond (see figure 7). We conclude that observers are
responding, not to the half-height of the triangle as they were asked to do, but to the
centroid of the triangle (Morgan and Glennerster 1991) as defined by its centre of area
or centre of gravity.

2 Experiment 1: Measuring the effect
Observers were undergraduate students who received course credits for their participa-
tion. They viewed various forms of equilateral triangles on a computer monitor screen.
They adjusted the vertical position of a small spot inside the triangle, until it appeared
to be halfway up the triangle. Results were recorded.
2.1 Method
The programs we used were written in Macromedia Director 10.1 on a Macintosh
computer running Mac OS 10.4. The screen was viewed from a distance of 57 cm in a
dimly lit room. Five different background shapes were used: (i) an outline equilateral
triangle; (ii) a Kanizsa triangle defined by three pacmen, each with a bite taken out of it;
(iii) three small dots arranged in a triangle; (iv) a T-shaped region made by removing
parts of a solid equilateral triangle; and (v) an outline pentagon.

À We are happy to acknowledge that Ross Day has independently carried out studies similar to ours,
which will be published shortly.
322 S Anstis, R Gregory, P Heard
The stimuli are shown in figure 1. The height of each triangle was 6 deg of visual
angle. Each of these triangles or pentagons was presented upright on half the trials
and upside down on the other half, to reduce the effects of any top bias or bottom
bias. The five shapes and two orientations (upright or upside down) were presented in
random order. Fifteen settings were made in each condition by three observers (PH,
SA, and one naive observer). The observer could strike one of two keys, one to move
the dot up and the other to move it down, until it appeared to be exactly halfway
up the triangle (or pentagon). The observer then hit the space bar to record the setting,
which was recorded for later analysis offline.
46.6% 28.1% 26.8% 13.4% 18.6%
(a) (b) (c) (d) (e)
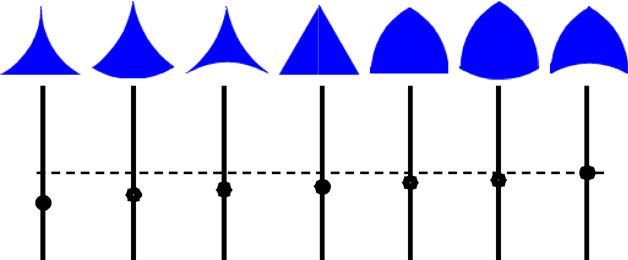
Figure 1. The top row shows various forms of equilateral triangle. Each vertical line represents
the full height of the triangle, and the solid circle shows the mean position selected as half-
way up the height (mean of three observers615 trials). The dashed horizontal line shows the
true halfway position. Numbers show the percentage size of the illusion, 1006[(upper segment)=
(lower segment) ÿ 1].
2.2 Results
As one would expect, a dot halfway up that looked `too high' in an upright triangle
consistently looked `too low' in an upside-down triangle. Accordingly, for the analysis
we inverted the results for upside-down shapes and pooled them with the results for
upright shapes.
The settings obtained (mean of three observers615 trials) are shown in figure 1.
Under each of the five stimuli is drawn a vertical line representing the height of the
triangle (or pentagon). The dashed horizontal line is actually halfway up the line, but
the black spot on each line shows the observers' mean settings, which generally lay
below the true halfway point. The downward displacement of each spot below the half-
way point represents the triangle-bisection illusion.
In all cases, the true setting looked `too high' and all observers set the position of
the triangle bisector below its correct position, so that the upper segment was phys-
ically longer than the lower. To calculate the size of these illusions, assume that the
triangle is 200 pixels high, so the veridical bisector position is at 100 pixels, but that
the observer selects a setting s lower than this (s 5 100 pixels). We express the
percentage illusion as 1006[(upper segment)/(lower segment) ÿ 1]. Thus a veridical
setting, where s 100 pixels, would yield zero illusion; and a setting s to (say) 90 pixels
would give 1006[110/90 ÿ 1] 22.2%; so in this example the two segments wouldThe triangle-bisection illusion 323
look perceptually the same when the upper segment was actually 22.2% longer than
the lower segment.
The percentage results obtained are shown below each stimulus. Thus, a hypoth-
etical spot set halfway up an outline equilateral triangle (figure 1a) and lying on the
dashed horizontal line looked `too high' and, to make it look subjectively halfway up,
it was set below the halfway point, with the upper segment 46.6% longer than the
lower. The illusion was also strong for a Kanizsa triangle (28.1%) and for three dots
arranged in a triangle (26.8%). However, the T-shape and the pentagon gave smaller
illusions (13.4% and 18.6%, respectively). The T-shape in figure 1d is a compromise
between the triangle bisection illusion and the bisected-T illusion (reviewed by Robinson
1972/1998).
3 Experiment 2: Aspect ratio of the triangle
We examined the effect of the aspect ratio of the triangle upon the illusion. Seven solid
black triangles were presented in random order against a white surround. All triangles
had equal areas, but their aspect ratios (height/width) formed an equally spaced
logarithmic series, namely 1 : 4, 1 : 2:52, 1 : 1:58, 1 : 1, 1:58 : 1, 2:52 : 1, and 4 : 1. This
meant that the apical angles were 1328, 1118, 858, 608, 408, 278, and 178. Miniature
versions are displayed as icons along the x-axis of figure 2. The widest triangle was
9.5 deg wide and 2.4 deg high, while the tallest triangle was 2.4 deg wide and 9.5 deg
high. The seven triangles were presented eight times each in random order, and they
were randomly made upright or upside down (base-down or base-up) on each trial.
The initial vertical positions of the triangle and of the adjustable spot were also
randomised on each trial.
The observer adjusted a small spot until it apparently lay halfway up the triangle,
and pressed the space bar after each setting. All settings were recorded for later analysis
offline.
Angle of apex=8
17 27 40 60 85 111 132
20
Mean error=%
10
0.25 0.4 0.65 1 1.58 2.52 4
0
Figure 2. Bisection illusion for equilateral triangles
of different aspect ratios.
Height/width ratio (log scale)
3.1 Results
Figure 2 (mean of three observers68 readings) shows that the triangle-bisection illu-
sion was strongest for an equilateral triangle with an apical angle of 608. We do not
know why this is so, but it is consistent with Piaget and Pe©ne (1955), who found a
maximum effect at an angle of 558. However, this angle was not really critical, and the
bisection illusion was found over the whole range of aspect ratios tested.324 S Anstis, R Gregory, P Heard
4 Experiment 3: Cyclopean triangle
The experiment was repeated with the same procedure but with a cyclopean triangle
(Julesz 1971). Each eye saw a random-dot field, presented side-by-side on the monitor
screen and fused binocularly by means of a mirror stereoscope. A triangular area of
random dots was presented in crossed disparity. When one eye was closed, no triangle
was visible, because the triangle did not exist within one eye's view, but was present
only as a correlation between the eyes. But when the stimulus was viewed stereoscop-
ically, the observer saw an equilateral triangle, 5 deg in height, floating in depth in
front of the background. A small red spot could be moved up and down the mid-line
of the triangle, as before, and the observer's task was again to set it apparently halfway
up the triangle. Results (mean of two observers610 readings): observers set the upper
segment to be 38.1% longer than the lower.
This shows that the illusion does not require that the triangle be a first-order shape
defined by luminanceöinstead, a second-order textured shape defined by binocular
disparity suffices. It also shows that the neural site of at least some components of the
triangle illusion, as for some other geometrical illusions (Coren and Porac 1984), comes
after the point of binocular fusion.
5 Experiment 4: Texture-defined triangles rule out simple spatial filtering
Some geometrical illusions, such as the Zo«llner and Fraser stimuli, can involve luminance-
filtering operations (Morgan and Casco 1990; Morgan et al 1990, 1995; Morgan 1996).
Thus, if the Mu«nsterberg and Cafë Wall illusions are filtered by difference-of-Gaussian
filters that resemble the receptive fields of retinal ganglion cells, the output contains a
series of tilted lines, alternately black and white, instead of the long horizontal line in
the original stimulus (Morgan and Moulden 1986). These tilts have the same orienta-
tion as the perceived illusions. Could the triangle-bisection illusion be the result of
such spatial filtering? Experiment 4 suggests that the answer is `no', because we were
still able to obtain a bisection illusion from second-order triangles that were defined
by equiluminant textures. Since these triangles had the same mean luminance as the
surround, any luminance filtering operations would be blind to these triangles.
We used two pairs of textures to define the equilateral triangles, which all had a
side of 6 deg. One pair consisted of left-oblique versus right-oblique hatchings. The
other pair consisted of a grey halftone dot texture versus a cross-hatching of tiny
diamonds made by superimposing left-oblique and right-oblique hatchings. Examples
are shown in figure 3. (These are not exact replicas; the actual hatchings were much
finer than the reproductions in figure 3.) On half the trials, the first texture of a pair
filled the triangle and the second texture filled the background. On the other half of
trials the reverse was the case. As a control condition we used white triangles with a
black surround. (We did not use black triangles on white because this would have
hidden the black cursor.) Each triangle was upright on half the trials and upside
down on the other half. Textures and triangle orientation were randomly selected
on different trials. Three observers made 6 trials in each of the ten conditions (2 orien-
tations64 textures black/white), placing the cursor onscreen at the perceived halfway
point and clicking the mouse to record their settings, using the same procedure as in
experiment 3.
Results (mean of three observers66 trials) are shown in figure 3: the black ^ white
triangle and the mean of the texture-defined triangles showed almost identical illusions,
in which observers set the upper segment of the subjective `bisection' to be respectively
1.47 times and 1.5 times the length of the lower segment. Thus, in both cases they set
the apparent bisection point three-fifths instead of one-half of the way down the height
of the triangle. Taken together, experiments 3 and 4 lead us to conclude that second-
order triangles, defined either by stereo disparity or by texture, gave the same illusionThe triangle-bisection illusion 325
Figure 3. Texture-defined triangles (right) gave the same bisection illusion, shown below as circles
on the black vertical lines, as luminance-defined triangles (left).
as first-order, luminance-defined triangles. Since spatial filtering would be sensitive
to luminance edges, but blind to edges of disparity or texture, we conclude that simple
luminance filtering is not involved in the bisection illusion. Admittedly, there might
still be a texture grabber (Werkhoven et al 1993) followed by some form of spatial
filtering, but this would be a higher-level filter, not a low-level luminance filter; and
we know of no independent evidence for the role of such hypothetical filters in geo-
metrical illusions.
6 Experiment 5: Three-way bisections
So far, all subjective halfway points selected lay along the vertical axis that bisects a
triangle. However, in experiment 5 we measured halfway points along all three axes
of an equilateral triangle. Each of these axes bisects an angle and its opposite side,
and the axes are oriented at the vertical, and 608 to left and right of vertical.
The stimulus was an outline equilateral triangle of 7 deg side. Initially all three
sides were dark blue. On each trial, however, a randomly selected side was made dark
red, and this signaled to the observer that the task was first to move the mouse cursor
(a small cross) to the corner opposite that edge, then move the cursor freely back and
forth between the corner and the red edge until a point was found where the cursor
appeared to bisect the distance between edge and corner. The observer then clicked
the mouse to indicate this subjective halfway point, and a new side was randomly
selected for the next trial. Six naive observers made five settings for each side.
Results are shown in figure 4. The small cross shows the centre of gravity of the
triangle; the triangle could balance on a pin placed here. It is also the centre of area,
since any straight line passing through this point would divide the triangle into two
regions of equal area. It is also where the bisectors of the three angles of the triangle
intersect, and it lies two-thirds of the way from a corner to its opposite side.326 S Anstis, R Gregory, P Heard
Figure 4. Results of experiment 5. The cross shows
the centre of gravity, which is also the centre of area.
Each filled circle shows the halfway point between
the nearest corner and its opposite side. Open circles
show the observers' settings of the apparent halfway
points along the triangle's three axes.
The three filled circles show the objective halfway points, whilst the open circles
indicate the settings of the subjective halfway points selected by the observers. Each
objective halfway point gives the illusion of looking subjectively `too near' to its corre-
sponding corner, whilst the subjective halfway points cluster closely around the centre
of gravity of the triangle. Results clearly support the notion that observers are judging
the centre of gravity (or centre of area; in fact, for an equilateral triangle these two
are the same).
The results also show that the illusion is isotropic, with no special emphasis upon
the vertical. Note that the term `centre of gravity' has no implications about the verti-
cal. The only difference is that for a centre of area all pixels in a shape are of equal
value, whereas to compute the centre of gravity each pixel is multiplied by its distance
from the fulcrum.
7 Experiment 6: Trapezia
We started with an equilateral triangle with a side of 12 cm. We then made a series
of trapezia of different widths, by splitting the triangle down its vertical midline and
inserting rectangles of various widths, namely 0, 2, 4, 6, 8, and 10 cm. Thus the top
sides of the trapezia were 2, 4, 6, 8, and 10 cm, while the bottom sides were 14, 16, 18,
20, and 22 cm. Observers were asked to bisect each trapezium by setting the cursor
to look halfway up its vertical midline, using the same procedure as in the previous
experiments. Our prediction, which we confirmed, was that the wider the trapezium,
the more it would dilute the bisection illusion.
Results are shown in figure 5. In this figure, the settings (mean of five naive observ-
ers610 trials) are shown as open circles, and veridical settings would be at y 50%.
50
45
y=%
40
y 60:3 ÿ 2:44x
R 2 0:922
Figure 5. Halfway judgments for triangles and trapezia
(mean of 5 subjects 6 10 trials). Subjective halfway
35 points (open circles) were a compromise between the
actual halfway points (top edge of graph, y 50%)
and the centres of area (crosses) of the shapes.
ShapeThe triangle-bisection illusion 327
Values of y between 40% and 50% show that the observer set the cursor `too low',
demonstrating the standard bisection illusion. The crosses in the figure show the calcu-
lated centres of area of each trapezium. In the limiting cases, the centre of area lies
33% of the way up an equilateral triangle and 50% of the way up a rectangle.
Figure 5 shows that the strongest illusion ( y ' 40%) occurred for an equilateral
triangle, with the illusion declining as the trapezium was made wider and saturating
when the width of the added rectangle was 6 cm or more. It also shows that for every
shape the observers' mean settings were displaced toward the centre of area.
8 Experiment 7: Triangles with curved sides
Experiment 7 was similar to experiment 1 except that the triangles were now distorted.
We reasoned that the bisection illusion should be reduced if the sides of the triangle
bulged outwards to make it closer to a circular disk, and it would be exaggerated if the
sides of the triangle were sucked inwards, making it more `bottom-heavy'. These predic-
tions are compatible with the centre-of-gravity theory proposed later in section 13.
Accordingly, we made seven new triangular shapes whose sides were composed of
straight lines, circular arcs, or a mixture of both. The radius of the circular arcs was
equal to the side of the equilateral triangle. Each was presented both upright and
upside down, eight times in random order. Results for upright and upside-down figures
were pooled for analysis. The stimuli we used are shown in figure 6.
102% 64.6% 45.7% 36.7% 23.5% 18.8% 12.8%
(a) (b) (c) (d) (e) (f) (g)
Figure 6. [In colour online, see http://dx.doi.org/10.1068/p5866] Bisection illusion for triangles with
curved sides was greatest for triangles with concave sides [(a), (b), (c)] and smallest for triangles
with convex sides [(e), (f ), (g)].
8.1 Results
The percentage illusions, calculated as before, are shown underneath each stimulus
in figure 6 (mean of three observers616 readings). The strongest illusion, in which
the upper segment was set almost exactly twice as long as the lower segment, was
obtained with a triangle with concave sides and a flat base. Note how strong this
illusion is: it is hard to believe that the spot on the vertical line in figure 6a was actually
perceived as halfway up the line when it was embedded in the concave triangle.
In fact, all triangles with concave sides gave large illusions; whilst triangles with three
straight sides gave a smaller illusion, of 36.7%, not too different from the 46.6% obtained
in experiment 1; and triangles with convex sides gave the smallest illusions.
9 Experiment 8: Bisecting a triangle with a diamond
We now repeated experiment 1a, replacing the adjustable spot with an adjustable grey
diamond. A white equilateral triangle of 6 deg in height, set in a black surround, was
exposed on the monitor screen. A grey diamond filled the upper part of the upright328 S Anstis, R Gregory, P Heard
Figure 7. Observers attempted to set the bottom tip
of the diamond to be halfway up the triangle. Small
circle shows the actual halfway point.
triangle (figure 7). The observer's task was to hit keys that moved the bottom of the
diamond up and down, until its bottom tip appeared to pass through the centre of
the upright triangle. (The top of the diamond always fitted snugly into the top of the
triangle.) To minimise top ^ bottom bias, the entire figure was randomly made upright
or upside down (base-down or base-up) on each trial.
Results for the upright and upside-down triangles were pooled and averaged.
Figure 7 shows the mean setting of the diamond, together with a spot that actually
lies halfway up the triangle. If the observers had been veridical then the diamond's tip
would have passed through this central point, and the upper segment defined as the
vertical height of the grey diamond would have been equal to the lower segment,
defined as the gap between the bottom of the diamond and the bottom of the triangle.
In fact, however, they set the diamond much lower than this, with the upper segment
81% longer than the lower segment (mean of five observers610 trials).
10 Experiment 9: Opposed triangles with curved sides
We now combined the curved sides of experiment 7a with the diamond arrangement
of experiment 8, and this gave the largest illusion of all. Figure 8 shows three
versions of this new display. In all three versions, the height of the diamond is EF
and the height of the triangle is EG. At the correct bisection point, which is shown
in figures 8a, 8b, and 8c, the distances DE EF FG, so that EF is one-third the
length of DG. However, a moment's inspection shows that in each case the diamond
EF looks far too short.
We measured the illusion of figure 8b, in which two triangles with curved sides
are superimposed, one being upside down. The observer struck two keys that moved
the triangles vertically in opposite directions, either closer together or further apart.
The task was to adjust the vertical separation between the two triangles until the
apex of each triangle lay at the halfway point of the other triangle. (The symmetrical
D D
E E
F F
G G
(a) (b) (c)
Figure 8. Illusions of bisection in concave triangles: (a) the bottom of the grey concave diamond
lies halfway down the triangle; (b) the apex of each triangle lies halfway down the other triangle
(a version of this illusion was measured in experiment 6); (c) the length of each diamond in
the star is equal to the gap between the diamond's tip and the side of the large square. In each
case, DE EF FG, but EF looks much shorter than FG.The triangle-bisection illusion 329
stimulus ensures that when the apex of the upper triangle bisects the lower triangle,
then the apex of the lower triangle also bisects the upper triangle.) In figure 8b, the
triangles do bisect each other and DE EF FG. However, to attain a subjective
bisection the observers made the triangles overlap much more, until the height of the
diamond EF was more than twice as long as DE and FG, with an illusion (mean of
nine observers65 trials) of 114%.
11 Experiment 10: Common fate and attention
The triangle-bisection illusion affects the perceived position of a spot within a triangle.
We now asked whether this shift was local to the triangle, altering only the criterion
of what is halfway up; or whether the shift was more global and applied to the posi-
tion of the whole triangle.
We superimposed two semitransparent outline triangles, an upright (base-down) red
triangle and an upside-down (base-up) blue triangle. The apex of each triangle lay on
the mid-point of the base of the other triangle (as in figure 9a). A central spot lay
halfway up one triangle, and therefore halfway down the other. Thus, if the observer
was able to attend to one triangle and ignore the other, the spot should appear to be
shifted apparently up, or down. We used `common fate' to control attention. Each tri-
angle jittered horizontally at random and independently, so that they shifted irregularly
back and forth across each other. The spot was at first red and synchronised with the
red triangle, moving horizontally in step with it. It then abruptly became blue and
was synchronised with the blue triangle; and this cycle continued indefinitely. Thus the
spot followed the motion regime first of one triangle, then of the other.
2
2
1 1
(a) (c)
2
1 2
1
(b) (d)
Figure 9. (a) Two equilateral triangles were superimposed with their upper and lower boundaries
lined up. This also aligned their halfway points. When flashed in alternation, motion was seen
upward from time 1 to time 2 (not shown); (b) when alternated side-by-side, motion was
seen obliquely upwards. (c) When centres of gravity coincided, in a Star of David configuration,
no net vertical motion was seen (not shown); (d) when then alternated side-by-side, the apparent
motion was horizontal with no vertical component. Note: For clarity, triangles at time 2 are drawn
with heavy lines. This was not so in the actual experiment.
11.1 Results
The qualitative result was that when the moving spot synchronised with the base-
down triangle, it appeared to be lower than halfway down, and when it synchronised
with the base-up triangle it appeared to be higher than halfway downörelative to
the triangle that moved with it. It did not appear to move vertically with respect to the
page or to the observer. So when the spot was perceptually grouped with one triangle
or the other, its position was judged relative to that triangle.
12 Experiment 11: Does the illusion shift the spot, or the triangle?
Since the spot in experiment 10 appeared to change its vertical position relative to the
triangles, but not its absolute vertical position, we argued that perhaps the illusion
shifted the perceived position not of the spot but of the triangles. We measured this
directly by superimposing two triangles, as in experiment 10, with the apex of each330 S Anstis, R Gregory, P Heard
triangle on the midpoint of the base of the other triangle (figure 9a). There was no spot. In
an apparent-motion design, we briefly flashed up first the upright, then the upside-down
triangle, and asked observers to report whether they saw any net motion up or down. All
observers reported net motion upwards. They were then invited to adjust the position of
the base-up triangle (downwards), until they saw no net motion upwards or downwards.
They then struck the space bar to record their setting, which was recorded for later
analysis offline. Each observer made five settings.
12.1 Results
The two triangles gave minimum net vertical motion, not when superimposed as in
figure 9a, in other words when their halfway points coincided, but instead when their
centres of gravity coincided, so that, if superimposed and stationary, they would
form a Star of David. Clearly the visual system assesses the position of the motion
tokens, not by their halfway points, but by their centres of gravity. This result for
apparent motion is consistent with the centre-of-gravity account of the triangle-
bisection illusion.
13 Discussion
Let us summarise our results. We found a strong triangle-bisection illusion, in which
the distance above the subjective halfway point was 46.6% or 36.7% greater than the
distance below it (experiment 1, figure 1a; and experiment 7, figure 6d). An equilateral
triangle gave the best illusion (experiment 2, figure 2), and a cyclopean triangle also
gave the effect, showing that the illusion occurs after the anatomical point of binocular
fusion. We found a novel, extremely strong version of the illusion (102%) when the
triangle had two concave sides, emphasising the triangle's `bottom-heavy' geometry.
Also an equilateral triangle gave a very strong illusion (81%) when the adjustable spot
was replaced by an adjustable grey diamond. Two opposed triangles with curved,
concave sides gave the biggest illusion (114%) in experiment 9. These findings suggest
that the observers were tending to equalise the areas above and below the subjective
halfway point.
We propose two theories to explain the triangle-bisection illusion: (1) inappropriate
constancy scaling; and (2) centre of gravity or area. These theories might compete or
overlap.
13.1 Inappropriate constancy scaling
Gregory (1968) has suggested that many geometrical illusions contain perspective cues
that trigger an inappropriate constancy scaling, which effectively increases the per-
ceived size of more distant objects. Thus an equilateral triangle might be perceived
as the flat picture of a road seen in perspective, with the top apex lying at infinity and
the bottom base as the nearest part of the road.
However, we do not believe that constancy scaling operates in the triangle-bisection
illusion because the perceived effects are in the wrong direction. Suppose, then, that the
triangle were a perspective photograph of a road, with the apex of the triangle represent-
ing the road's width dwindling to zero at the horizon. A spot halfway up the triangle
would bisect the photograph up ^ down, but it would not bisect the road near ^ far.
The region above the spot would correspond to a very long stretch of distant road, whilst
the region below the spot would represent a very short stretch of nearby road. Perceptual
size constancy would expand the (distant) region above the spot, so the spot would
look more than halfway down the triangle. In fact, however, it looks less than halfway
down (Humphrey and Morgan 1965). So constancy scaling predicts the wrong direction
for the triangle-bisection illusion.The triangle-bisection illusion 331
13.1.1 Ponzo illusion. The midline of the triangle in figure 10a has a gap exactly halfway
down, but this gap looks `too high'öin other words, the upper line segment looks
apparently shorter than the lower. A simple rotation (b) and expansion (c) turn this
into the familiar Ponzo illusion (Ponzo 1928), in which the upper line looks longer. The
Ponzo illusion has been attributed to inappropriate constancy scaling (Gregory 1968),
but it goes in the opposite direction to the triangle-bisection illusion.
(a) (b) (c)
Figure 10. (a) The triangle-bisection illusion. The gap in the midline is halfway up but looks
`too high', so the upper line segment looks shorter than the lower. (b) Each segment has been
rotated about its own centre through a right angle. Now the upper segment looks longer.
(c) Moving the oblique sides of the triangle further apart reveals the familiar Ponzo illusion, in
which the upper line also looks longer. If the illusions in (b) and (c) are caused by inappropriate
constancy scaling, then the triangle-bisection illusion in (a) cannot be.
In fact, we do not believe that Gregory's theory is applicable to the triangle-bisection
illusion, and we certainly do not regard this illusion as a test of his theory. Note that the
grey diamond in figure 7 greatly enhances the illusion, but there is no plausible perspec-
tive interpretation of the diamond. And the triangle with concave sides in figure 4a
gives a huge illusion, but any perspective theory would predict the opposite, since the
concave triangle would represent (if anything) a road that comes down a distant hill and
flattens out nearer toward the observer. On any perspective story, the steeper hill in
the distance would represent a smaller amount of physical road than a flat horizontal
road in the distance, so a perspective theory would predict a smaller bisection effect
for a concave triangle, not the larger effect found here.
13.2 Centre of gravity/centre of area
It may be that, although observers are asked to find the halfway point, which has
equal linear extents above and below it, they are actually finding the centre of area,
which has equal areas above and below it. They are applying a 2-D algorithm to a
1-D problem. The centre of area of an equilateral triangle lies well below its halfway
point, and there is evidence that observers make settings that are a compromise
between the two. In figure 1a, the long dashed horizontal line passes through the
half-height, and the short horizontal line just below it passes through the centre of area
( centre of gravity).
For triangles, although not for geometrical shapes in general, the centres of gravity
and of area coincide. At the least, we think it unlikely that observers simply misunder-
stood the instructions, so they were not doing the wrong task by misguidedly aiming
for the centre of area or mass instead of for the halfway point. A glance at figure 7
shows that the small circle that marks the physical halfway point looks subjectively
far above halfway, whilst the tip of the grey diamond looks about right for most observ-
ers, even though the distance above the grey tip is 81% longer than the distance below it.
In other words the illusion is genuinely visual and not merely a linguistic mistake.
What is true for triangles is also true for clusters of dots. There is evidence that
observers have a strong tendency to locate a cluster of dots at its centroid, even if
asked to locate it at a particular dot differing in colour from all the rest (Harris and
Morgan 1993; Morgan et al 1990). These authors argue that observers have an automatic
strategy of locating centroids because that is what the visual system is set up to do.332 S Anstis, R Gregory, P Heard
Observers are about as good at locating the centroid of a dot cluster as they are at
locating a single dot. This is not done by a blurring strategy, since thresholds are the
same when all the dots of the cluster have the same polarity as when half are black
and half are white on a grey background (Morgan and Glennerster 1991). We conclude
that our observers were unable to abstract the halfway point of a triangle, as they were
asked to do, but instead were locating the centroid of the triangles.
In sum, we conclude that observers are setting the spot, not to the halfway point
that has equal linear extents above and below it, but to somewhere near the centre of
area, which has equal areas above and below it. This is because the purpose of the visual
system is to locate objects and their centroids, rather than to locate abstract measures
such as the halfway point of objects.
Acknowledgments. SA is grateful to receive a grant from the UCSD Academic Senate, a Fellowship
from the Humboldt Foundation, and a Visiting Fellowship from Pembroke College, Oxford.
RLG is grateful to receive a grant from the Gatsby Foundation. Thanks to Brian Rogers for
helpful discussions, and to Caroline Crump, Olivia Ghaussy, Amanda Gorlick, Connor McCabe,
Lilian Loh, Lauren London, and Clara Robles, for assistance in collecting and analysing the
data. We would also like to thank referee, Michael Morgan, for his extremely helpful comments.
References
Coren S, Porac C, 1984 ``Structural and cognitive components in the Mu«ller-Lyer illusion assessed
via Cyclopean presentation'' Perception & Psychophysics 35 313 ^ 318
Gregory R L, 1968 ``Visual illusions'' Scientific American 219 66 ^ 76
Harris J, Morgan M J, 1993 ``Stereo and motion disparities interfere with positional averaging''
Vision Research 33 309 ^ 313
Humphrey N K, Morgan M J, 1965 ``Constancy and the geometric illusions'' Nature 208 744 ^ 745
Julesz B, 1971 Foundations of Cyclopean Perception (Chicago, IL: University of Chicago Press)
Morgan M J, 1996 ``Visual illusions'', in Unsolved Mysteries of the Mind Ed. V Bruce (Hove, Sussex:
Lawrence Erlbaum Associates)
Morgan M J, Casco C, 1990 ``Spatial filtering and spatial primitives in early vision: an explana-
tion of the Zo«llner-Judd class of geometrical illusion'' Proceedings of the Royal Society of
London, Series B 242 1 ^ 10
Morgan M J, Glennerster A, 1991 ``Efficiency of locating the centres of dot clusters by human
observers'' Vision Research 31 2075 ^ 2083
Morgan M J, Hole G J, Glennerster A, 1990 ``Biases and sensitivities in geometrical illusions''
Vision Research 30 1793 ^ 1810
Morgan M J, Medford A, Newsome P, 1995 ``The orthogonal orientation shift and spatial filtering''
Perception 24 513 ^ 524
Morgan M J, Moulden B, 1986 ``The Mu«nsterberg figure and twisted cords'' Vision Research 26
1793 ^ 1800
Piaget J, Pe©ne F, 1955 ``Essai sur l'illusion de la mëdiane des angles en tant que mesure de l'illusion
des angles'' Archives de Psychologie 35 77 ^ 92
Ponzo M, 1928 ``Urteilsta«uschungen u«ber Mengen'' Archiv fu«r die gesamte Psychologie 65 129 ^ 162
Robinson J O, 1972/1998 The Psychology of Visual Illusions (London: Hutchinson, 1972; reprinted
with corrections, New York: Dover, 1998)
Seckel A, 2000 The Art of Optical Illusions (London: Carlton Books)
Werkhoven P, Sperling G, Chubb C, 1993 ``The dimensionality of texture-defined motion: a single
channel theory'' Vision Research 33 463 ^ 485
ß 2009 a Pion publicationISSN 0301-0066 (print) ISSN 1468-4233 (electronic)
www.perceptionweb.com
Conditions of use. This article may be downloaded from the Perception website for personal research
by members of subscribing organisations. Authors are entitled to distribute their own article (in printed
form or by e-mail) to up to 50 people. This PDF may not be placed on any website (or other online
distribution system) without permission of the publisher.You can also read


