Stiffness of Human Hair Correlates with the Fractions of Cortical Cell Types - MDPI
←
→
Page content transcription
If your browser does not render page correctly, please read the page content below
cosmetics
Article
Stiffness of Human Hair Correlates with the Fractions
of Cortical Cell Types
Yusuke Ezawa 1 , Shinobu Nagase 1 , Akira Mamada 2 , Shigeto Inoue 3 , Kenzo Koike 1                and
Takashi Itou 1, *
 1   R&D—Hair Care Products Research, Kao Corporation, 2-1-3, Bunka, Sumida-ku, Tokyo 131-8501, Japan;
     ezawa.yuusuke@kao.com (Y.E.); nagase.shinobu@kao.com (S.N.); koike.kenzo@kao.com (K.K.)
 2   Product Quality Management, Kao Corporation, 2-1-3, Bunka, Sumida-ku, Tokyo 131-8501, Japan;
     mamada.akira@kao.com
 3   R&D—Analytical Science Research, Kao Corporation, 1334, Minato, Wakayama-shi,
     Wakayama 640-0112, Japan; inoue.shigeto@kao.com
 *   Correspondence: itou.takashi1@kao.com; Tel.: +81-3-5630-9972

 Received: 30 January 2019; Accepted: 21 March 2019; Published: 1 April 2019

 Abstract: (1) Background: The objective of this work was to elucidate the hair microstructure which
 correlates with the stiffness of human hair fibers. (2) Methods: Bending moduli of hair fibers were
 evaluated for the hair samples from 156 Japanese female subjects. Hair transverse sections were
 dual-stained with fluorescent dyes which can stain para- and ortho-like cortical cells separately,
 and observed under a fluorescence light microscope. Atomic force microscopy nanoindentation
 measurements were performed to examine the modulus inside macrofibrils. (3) Results: The
 difference in bending moduli between the maximum and the minimum values was more than double.
 The hair of high bending modulus was rich in para-like cortical cells and the bending modulus
 significantly correlated with the fraction of para-like cortical cells to the whole cortex. On the other
 hand, the elastic moduli inside macrofibrils were almost same for the para- and ortho-like cortical
 cells. (4) Conclusions: Hair bending modulus depends on the fractions of the constitutional cortical
 cell types. The contribution of the intermacrofibrillar materials, which differed in their morphologies
 and amounts of para- and ortho-like cortical cells, is plausible as a cause of the difference in the
 modulus of the cortical cell types.

 Keywords: AFM nanoindentation; bending modulus; cortical cell; human hair; fluorescence
 light microscopy

1. Introduction
     Human hair and wool, two kinds of keratin fibers, are covered with cuticle scales, and the
cores mostly consist of cortices. Cortical cells constituting the cortex are composed of rod-like
intermediate filaments (IFs) and keratin associated proteins (KAPs) existing around and supporting
the IFs. IFs are arranged in a cross-section of assemblies of likely 32 keratin molecules aligned
longitudinally [1,2]. In contrast, KAPs are amorphous cysteine-rich proteins and are known to have
many variations [3,4] Hair is a composite structure and its physicochemical properties are determined
by its main morphological components, the cuticle and the cortex, and, in turn, by the micro-structures
and the intra- and inter-molecular interactions of the constituent elements of them, such as IFs
and KAPs.
     It is known that different types of cortices exist in wool [5] and that wool fibers having a strong
curl shape such as Merino wool have a bilateral structure of paracortex and orthocortex existing in the
concave and the convex side of the curl, respectively [6]. The IF arrangements inside them are greatly

Cosmetics 2019, 6, 24; doi:10.3390/cosmetics6020024                            www.mdpi.com/journal/cosmetics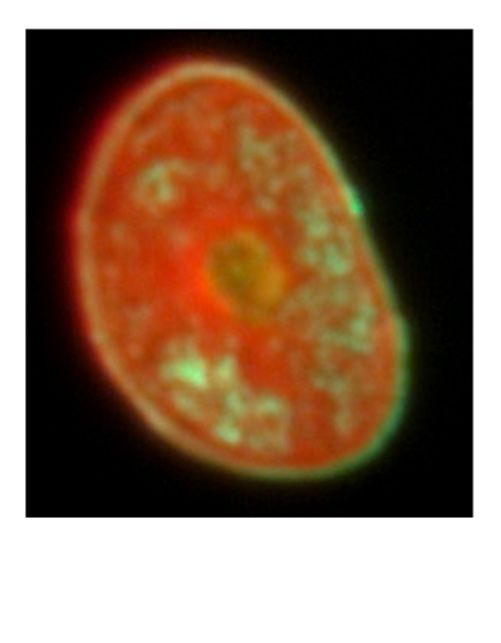
Cosmetics 2019, 6, 24                                                                                 2 of 11

different [7]. IFs align almost parallel with one another to the fiber axis in para- and meso-cortical
cells and, as a result, a dot patterns are observed in cross section by transmission electron microscope
(TEM). Meso-cortical cells further show a pattern of regular hexagonal close packing alignment. On the
contrary, whorl patterns are observed by TEM in ortho-cortical cells, and through three-dimensional
TEM measurements, it has been confirmed that IFs align helically in ortho-cortical cells of wool [8].
      It has been shown for human hairs that para-like, meso-like, and ortho-like cortical cells also
exist [9,10] and the IFs helically arrange in the ortho-like cortical cells as well as the orthocortex of
wool [9]. Para-like cortical cells locate in the concave side and ortho-like cortical cells in the convex
side of the curl for human curly hairs [11]. Bryson et al. [12] have shown in detail the difference in
cell distribution between curly hairs and straight hairs by fluorescence light microscopy (FLM) and
two- and three-dimensional TEM, and proposed a mechanism for curliness based on the cell type
distribution. Through small angle X-ray scattering measurement on Merino wool and human curly
hairs using a synchrotron radiation micro beam X-ray of about 5 µm diameter, Kajiura et al. [13,14]
have shown that the tilt angle of IFs against the fiber axis is small in the cortex at the concave side
of the curl and, conversely, rather large at the convex side of the curl. According to their findings,
the curl strength of human hair and wool depends on the degree of the inhomogeneity of the internal
nanostructure, regardless of ethnic origins [14]. These facts indicate that the macroscopic hair shape
relates to the microscopic distribution of the different cortical cell types.
      There have, however, been no reports about the relation between microscopic properties and hair
stiffness, one of the recognizable physical properties. The hair stiffness depends simply on its diameter.
It also relates to the elasticity of the cuticle and cortex and, to be more specific, it should depend on the
structure and fraction of their constituents. It has been shown that the bending elastic moduli of hairs
from Japanese and Caucasian females are almost constant but, for senior donors who were conscious
of the decrease in hair volume or bounce with aging, the moduli of their hairs are relatively lower [15].
It is unclear to which structure the difference in the elastic modulus is attributed, and knowing this
would be important to understand practical characters that concern aged persons.
      This study focuses on the hair stiffness to understand the structure relating to the bending
modulus from a microscopic point of view. Through evaluations of bending elasticity and FLM, it has
been found that the bending modulus depends on the fraction of the para-like cortex to the whole
cortex. The possible reason for the modulus difference between the para- and ortho-like cortices will
be discussed based on the difference in their subcomponents and constitutional molecules.

2. Materials and Methods

2.1. Hair Samples
      About 80 hair fibers from each of 156 Japanese female subjects between 10–70 years old were
cut very close to the scalp by a trained beautician. All the subjects had not had a perm within the
last six months. The hairs were cut randomly from the top part of the head. Segments of the hairs
3 cm in length from the root end were used for the experiments in order to avoid property changes
due to daily hair damage. African-American hair with a very strong curl shape was used since it was
expected to show a clear separation of ortho-like and para-like cortical cells. Hair fibers donated by an
African-American male subject were used. The hairs were again cut randomly very close to the scalp
and had no history of perm, relaxer, or hair dye treatments.

2.2. Hair Diameter
      Hair samples were left in a room controlled at 20 ◦ C and 65% relative humidity (RH) overnight,
and then used for the diameter and bending stress measurements in the same room.
      Hair diameters were measured for 30 hair fibers selected randomly from each subject with a
rotating fiber diameter system equipped with a laser (Kato Tech Co. Ltd., Kyoto, Japan) on segments
1.0 to 1.4 cm from the root end for each sample. The orthogonal projection of the hair was measured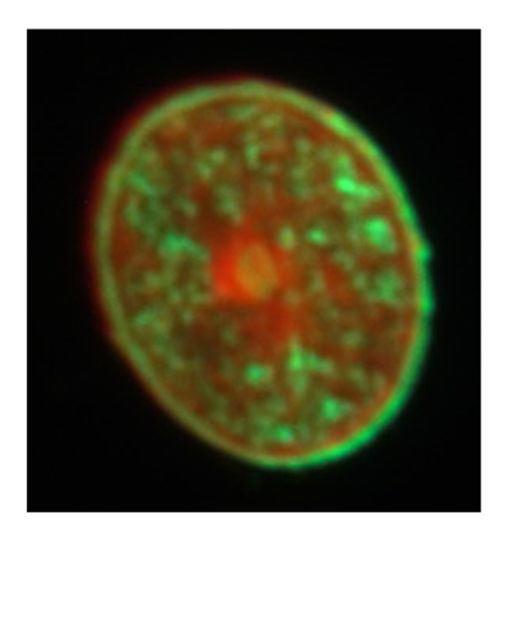
Cosmetics 2019, 6, 24                                                                               3 of 11

while it rotated at intervals of 30 degrees. The minimum value was taken as the minor axis and the
maximum as the major axis at the measured position. Each fiber was measured at five positions at
intervals of 1 mm along the fiber, and the mean values of the minor and major axes were taken as the
diameter of the minor axis (a) and that of the major axis (b) of the sample, respectively. The ellipticity
calculated from the mean minor and major axes for each subject was 1.23 ± 0.08 on average and had
no age dependence, similar to the previous results [16].

2.3. Bending Elasticity
     Hair bending stress was measured with a bending testing machine (KES-FB-2, Kato Tech Ltd.,
Kyoto, Japan) at 20 ◦ C and under 65% RH, according to the method by Mamada and Nakamura [15]
except that 30 hair samples were used for each measurement in this study. In brief, thirty hair fibers
were perpendicularly affixed between the two pieces of cross-section papers (length: 32 mm, width:
15 mm), at 1 mm interval, with double-sided adhesive tape. The measured part of the samples was
in the position range of 1 to 2 cm from the root ends. A bending angle of 2.5 radians was chosen.
Bending stress was measured as a function of curvature and, the bending elasticity per fiber, B,
was determined from the slope of a stress-strain curve in the curvature range of 1 to 2 cm−1 .
     From B and the moment of inertia (I) calculated from the averaged radii of the minor axis ()
and major axis () for the used 30 hair samples, bending modulus (E) was determined according to
Equations (1) and (2).
                                              B=E×I                                                (1)

                                            I = π 3 /4                                           (2)

2.4. Fluorescence Light Microscopy (FLM) of Cortical Cell Types
     Hair samples were immersed in ethanol for one minute to clean their surface and dry, then put
in embedding molds. Hair samples embedded in Spurr’s resin (Polysciences, Inc., Warrington, PA,
USA) were cut into round slices of 5 µm in thickness with a microtome (Leichert Ultracut N; Leica
Microsystems, Wetzlar, Germany) and then the slices were put on a slide glass. Double staining with
fluorescein sodium (FS) and sulforhodamine 101 (SR) were performed [12]. The colors of FS and
SR are green and red, respectively. The slices were immersed in a few drops of phosphate-buffered
0.002% FS solution, left for 18 h under conditions of dark and high humidity so as not to dry, rinsed
by deionized water 6 times, and dried naturally for 20 min. Then, the slices were immersed in a few
drops of phosphate-buffered 0.005% SR solution, left for 1.5 h under the same condition above, rinsed
by deionized water 6 times, and naturally dried. A fluorescence stereoscopic microscope (AxioVision
4.3; Zeiss, Oberkochen, Germany) with a fluorescein filter set (BP450-490, FT510, LP520) was used.
The images were digitally recorded and analyzed with analytical software ImageJ [17].

2.5. Atomic Force Microscopy (AFM)
      Hair samples and a standard fiber were embedded between two pieces of celluloid plate (Sump
plate; SUMP Laboratory, Tokyo, Japan) with ethyl acetate. The embedded hair samples and standard
fiber were cut by a microtome (EM UC7i, Leica Microsystems, Wetzlar, Germany) with a SYM knife
(SYNTEC Co., Ltd., Yokohama, Japan) to obtain smooth fiber cross-sections for AFM. For a standard
fiber, we used a fishing line made by fluorocarbon (Seaguar Keigoku No. 2, Kureha Gohsen Co., Ltd.,
Mibu, Japan) of which Young’s modulus had been examined to be 2.9 ± 0.2 GPa by a tensile tester
(NMB TG-500N; MinebeaMitsumi Inc., Tokyo, Japan) with a speed of 20 mm/min in the condition of
20 ◦ C and 65%RH.
      MFP-3D (Asylum Research, Santa Barbara, CA, USA) equipped with a closed cell to control
humidity condition and cantilevers of HQ300-Au (Oxford Instruments plc, Abingdon, UK) were
used. The spring constant used in this study was determined to be 25.2 N/m by the thermal noise
method. Humidity was controlled to be 65.5 ± 0.5% RH through use of a saturated solution of sodium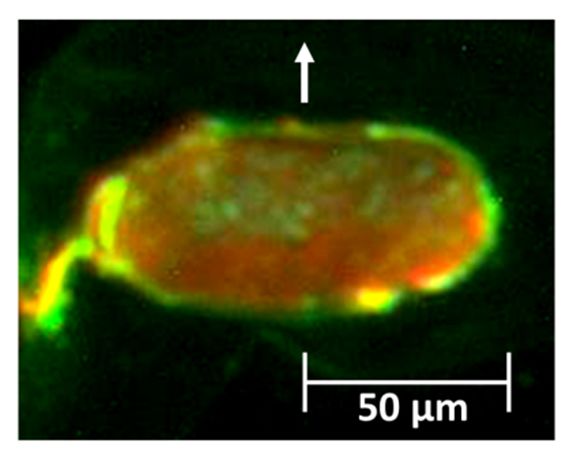
Cosmetics 2019, 6, 24 4 of 11
Cosmetics 2019, 6, x FOR PEER REVIEW 4 of 11
sodium hydrogen sulphite monohydrate. Samples were left for at least one hour to equilibrate prior
hydrogen sulphite monohydrate. Samples were left for at least one hour to equilibrate prior to starting
to starting measurements. AFM experiments were carried out at 27.1 ± 0.2 °C.
measurements. AFM experiments were carried out at 27.1 ± 0.2 ◦ C.
Firstly, an image of a cross section was obtained in AC mode on a 5 × 5 μm area to determine
Firstly, an image of a cross section was obtained in AC mode on a 5 × 5 µm area to determine the
the positions where the following nanoindentation measurements were performed. Secondly, the
positions where the following nanoindentation measurements were performed. Secondly, the AFM
AFM was operated in the contact mode and force curves at about the center of macrofibrils were
was operated in the contact mode and force curves at about the center of macrofibrils were acquired.
acquired. The loading rate was 1 nm/s, and the maximum force and the maximum indent depth
The loading rate was 1 nm/s, and the maximum force and the maximum indent depth were less than
were less than 300 nN and 8 nm, respectively. More than 100 force curves were obtained for each
300 nN and 8 nm, respectively. More than 100 force curves were obtained for each cortical cell type
cortical cell type in the same condition. For the standard fiber, the center part of the fiber was
in the same condition. For the standard fiber, the center part of the fiber was examined for the force
examined for the force curve measurements.
curve measurements.
Force curves were analyzed using the Hertz model for a punch indenter by fitting the
Force curves were analyzed using the Hertz model for a punch indenter by fitting the straight-line
straight-line portion of Force-Indentation curve in the range of 20%–80% of indentation (ca. 2.5–6 nm
portion of Force-Indentation curve in the range of 20%–80% of indentation (ca. 2.5–6 nm in depth).
in depth). Firstly, the force curves of the embedded standard fiber were analyzed. The cantilever
Firstly, the force curves of the embedded standard fiber were analyzed. The cantilever radius was
radius was determined so that the modulus might correspond to the value of Young’s modulus (2.9
determined so that the modulus might correspond to the value of Young’s modulus (2.9 GPa). In the
GPa). In the calculation, a value of 0.5 for the Poisson’s ratio was assumed. The radius of the
calculation, a value of 0.5 for the Poisson’s ratio was assumed. The radius of the cantilever was
cantilever was determined to be ca. 6 nm, which is reasonable from the geometry of the cantilever.
determined to be ca. 6 nm, which is reasonable from the geometry of the cantilever. The cantilever
The cantilever radius values thus determined were used to calculate the elastic moduli of the hair
radius values thus determined were used to calculate the elastic moduli of the hair fibers. Again, a value
fibers. Again, a value of 0.5 for the Poisson’s ratio was assumed for hair [18].
of 0.5 for the Poisson’s ratio was assumed for hair [18].
3. Results
3. Results
3.1. Bending
3.1. Bending Elasticity
Elasticity
Figure 1 illustrates the
Figure the bending
bending modulus
modulusEEplotted
plottedagainst
againstthe
theage
ageofofthe
thesubjects. There
subjects. is no
There is
significant
no ageage
significant dependence
dependence andand
E values havehave
E values some variation
some as previously
variation as previouslyreported [15]. [15].
reported The
difference
The between
difference the maximum
between the maximumand the
andminimum
the minimumvaluesvalues
is moreis than
moredouble. Since ESince
than double. is a mean
E is
avalue
meanof randomly
value selected
of randomly 30 hair
selected 30 fibers, the large
hair fibers, difference
the large in in
difference EE is ismeaningful
meaningfuleven
evenifif Figure 11
shows some
shows some scatter.
scatter. This
Thissuggests
suggestsaa non-uniformity
non-uniformity within
within the
the constituents
constituents of of hair
hair and
and that
that bending
bending
stressis,
stress is,therefore,
therefore,not
notdetermined
determinedsolely
solelybybythe
thehair
hairdiameter.
diameter.
Figure 1.1. Hair
Figure Hair bending
bending modulus
modulus vs.
vs. age
age of
of subjects. Each data
subjects. Each data point
point is
is aa mean
mean value
value of
of randomly
randomly
selected 30 hair fibers from Japanese females.
selected 30 hair fibers from Japanese females.
3.2. Observation of Cortical Cell Types in Hairs of Various Elastic Moduli
3.2. Observation of Cortical Cell Types in Hairs of Various Elastic Moduli
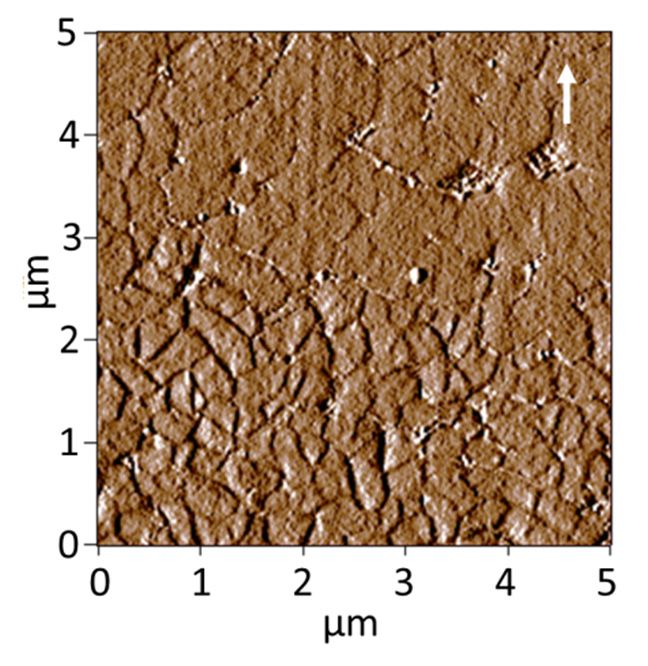
The cross sections of the hair samples having different bending moduli were observed by FLM
The cross sections of the hair samples having different bending moduli were observed by FLM
following a dual fluorescence staining procedure. Figure 2a shows a sample of high bending modulus
following a dual fluorescence staining procedure. Figure 2a shows a sample of high bending
(E = 6.5 GPa) with most of the cortical parts in the hair cross section are stained by FS (green). On the
modulus (E = 6.5 GPa) with most of the cortical parts in the hair cross section are stained by FS
other hand, Figure 2b shows a sample of low bending modulus (E = 4.7 GPa), which was mostly
(green). On the other hand, Figure 2b shows a sample of low bending modulus (E = 4.7 GPa), which
stained by SR (red). In addition, Figure 2c shows a sample with bending modulus close to the average
was mostly stained by SR (red). In addition, Figure 2c shows a sample with bending modulus close
to the average (E = 5.7 GPa) with sections stained by both FS and SR, which was the most frequent
case for the hair samples observed by FLM.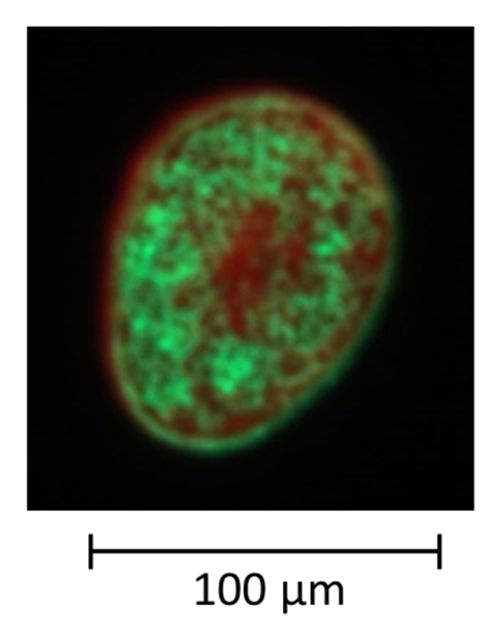
Cosmetics 2019, 6, 24 5 of 11
Cosmetics 2019, 6, x FOR PEER REVIEW 5 of 11
Cosmetics 2019, 6, x FOR PEER REVIEW 5 of 11
(E = 5.7
FromGPa) with
FLM onsections
Japanese stained by both
hairs and FS comparison
by the and SR, which was
with the observation
TEM most frequent casethe
using for adjacent
the hair
From
samples FLM onby
observed Japanese
FLM. hairs and by the comparison with TEM observation using the adjacent
fiber section, Bryson et al. [12] determined that the parts stained by FS are where para-like cortical
fiber section,
cells From FLM Bryson
are located on
and etthose
al. [12]
Japanese determined
hairs
stained and
by by
SRthe that
are the parts
comparison
where stained
with TEM
ortho-like by observation
FS are
cortical where
cells para-like
are using cortical
theApplying
located. adjacent
cells
fiber are located and those stained by SR are where ortho-like cortical cells are located. Applying
thesesection, Bryson
results to et al. [12]
the present determined
study, it suggests that thepara-like
that parts stained bycells
cortical FS arearewhere
rich inpara-like
the hair cortical
of high
these
cells results
are to the
located and present
those study,by
stained it suggests
SR are that ortho-like
where para-like cortical
cortical cells are
cells are located.
rich in the hair of these
Applying high
bending modulus and, conversely, ortho-like cortical cells are rich in the hair of low bending
bending
results modulus and, conversely, ortho-like cortical cells are rich in the hair of low
to the present study, it suggests that para-like cortical cells are rich in the hair of high bending bending
modulus.
modulus.
modulus and, conversely, ortho-like cortical cells are rich in the hair of low bending modulus.
(a) (b) (c)
(a) (b) (c)
Figure 2. Fluorescently stained sections of three typical hairs having different bending modulus. (a)
Figure
A section Fluorescently
2. Fluorescently stained
of the hair ofstained sectionsmodulus
sections
high bending ofthree
of threetypical
typical hairs(b)
hairs
(6.5 GPa); having
having different
different
a section bending
bending
of the modulus.
modulus.
hair of (a)(a)
low bending A
A section
section of of the
the hairhair
of of high
high bending
bending modulus
modulus (6.5 (6.5 (b)
GPa); GPa);
a (b) a section
section of the of the
hair of hairbending
low of low modulus
bending
modulus (4.7 GPa); (c) a section of the hair of which bending modulus is in the middle (5.7 GPa).
modulus
(4.7 GPa);(4.7
(c) aGPa); (c) of
section a section
the hairofofthe hair bending
which of whichmodulus
bending ismodulus is in the
in the middle middle
(5.7 GPa). (5.7 GPa).
3.3. Relationship
3.3. Relationship between
between thethe Bending
Bending Modulus
Modulus andand the
the Fraction of of Para-Like andand Ortho-Like Cortices
Cortices
3.3. Relationship between the Bending Modulus and the Fraction
Fraction of Para-Like
Para-Like and Ortho-Like
Ortho-Like Cortices
To elucidate
To elucidate the
the relationship betweenbetween thethe bending modulus
modulus and and thethe fraction
fraction of of para-like and and
To
ortho-like elucidate
cortices,theitrelationship
relationship
was necessarybetween
to the bending
quantifybending
the modulus
fraction of and
the the
two fraction
cortex of para-like
para-like
types. FLM and
was
ortho-like cortices,
ortho-like cortices,it itwaswasnecessary
necessary to quantify the fraction
to quantify of the two
the fraction cortex
of the two types.
cortexFLM was performed
types. FLM was
performed on the hair fibers of 27 subjects with different bending modulus (totally 69 hair fibers),
performed on the hair fibers of 27 subjects with different bending modulus (totally 69 hair fraction
on the hair fibers of 27 subjects with different bending modulus (totally 69 hair fibers), and the fibers),
and
of the fraction cortex
the of the para-like cortex to theΦwhole cortex Φp was The determined. The area ofcortex
the whole
and thepara-like to the whole
fraction of the para-like cortexcortex p wascortex
to the whole determined. area of the
Φp was determined. Thewhole
area of the whole was
cortex
determinedwas determined
by subtracting by subtracting
the cuticle andthe cuticle
medulla and
areas medulla
from the areas
wholefromcrossthe whole
sectional cross
area. sectional
The area
cortex was determined by subtracting the cuticle and medulla areas from the whole cross sectional
area.
of The area
para-like of para-like
cortex cortex was
was determined throughdetermined through
binarization binarization
of thebinarization
image. The of of the image.
results The results
of Φp plotted againstof
area. The area of para-like cortex was determined through the image. The results of
Φ
E p plotted against E are shown in Figure 3. There is a wide scatter in the results due to the variability
Φpare shownagainst
plotted in Figure
E are3. shown
There isina Figure
wide scatter in the
3. There is a results due tointhe
wide scatter thevariability
results due of individual fibers,
to the variability
of individual
but they follow fibers,
a but they
significantly followtrend
positive a significantly
(p = 6.7 × positive
10 trend (pproduct-moment
−4 by Pearson’s = 6.7 × 10⁻⁴ bycorrelation
Pearson’s
of individual fibers,
product-moment but theytest
correlation follow a significantly
calculated positiveExcel),
with Microsoft trend which
(p = 6.7 × 10⁻⁴ that
suggests by Pearson’s
the more
product-moment correlation test calculated with Microsoft Excel), which suggests thathigher
test calculated with Microsoft Excel), which suggests that the more para-like cortices, the the more the
para-like
bending cortices,
modulus. the higher the bending modulus.
para-like cortices, the higher the bending modulus.
Figure 3. Fraction of the para-like cortex to the whole cortex (Φp ) vs. macroscopic bending modulus
Figure 3. Fraction of the para-like cortex to the whole cortex (Φp) vs. macroscopic bending modulus
E. Circles
Figure with an of
3. Fraction error
the para-like ± standard
bar, meancortex deviation
to the whole (SD)
cortex (Φpof each
) vs. subject; Solid
macroscopic line, modulus
bending result of
E. Circles with an error bar, mean ± standard 2 deviation (SD) of each subject; Solid line, result of
linearization.
E. Circles withTheancoefficient
error bar,ofmean
determination
± standardR deviation
is 0.38. (SD) of each subject; Solid line, result of
linearization. The coefficient of determination R2 is 0.38.
linearization. The coefficient of determination R is 0.38.
2Cosmetics 2019, 6, x FOR PEER REVIEW 6 of 11
Cosmetics 2019, 6, 24 6 of 11
3.4. Modulus Inside Macrofibrils
3.4. Modulus Inside Macrofibrils
Figure 4a shows the result of FLM on an African-American hair with a very strong curl shape.
In theFigure
figure,4athe arrow
shows themeans
resultthe direction
of FLM on anfrom the convex to the
African-American hairconcave side of
with a very the curl.
strong curl It can
shape.
clearly be seenthe
In the figure, that the concave
arrow means thesidedirection
of the hair is mostly
from stained
the convex by FS
to the and the
concave convex
side of theside
curl.mostly
It can
by SR, indicating
clearly be seen that that
thepara-like and ortho-like
concave side of the hair cortices
is mostlyare distributed
stained bilaterally
by FS and in the
the convex very
side strong
mostly by
curly hair. Figure
SR, indicating 4b shows
that para-like anortho-like
and amplitude imageareatdistributed
cortices a center part of thein cross
bilaterally the very section
strongofcurly
an
African-American
hair. Figure 4b shows hair.anAmplitude
amplitudeimage
image can
at a display the of
center part shape of thesection
the cross sampleofsurface. Fine textures
an African-American
of macrofibrils
hair. Amplitude areimage
seen incanthe lower the
display halfshape
side ofofthe
theimage
sample (convex
surface.side),
Finewhereas
textures fused macrofibrils
of macrofibrils are
are
seenseen in the
in the lowerupper
half half
sideside ofimage
of the it (concave side).
(convex They
side), correspond
whereas to the patterns
fused macrofibrils areof ortho-like
seen and
in the upper
para-like cortical
half side of cells, side).
it (concave respectively, as was shown
They correspond in TEM of
to the patterns study by Bryson
ortho-like et al. [12].
and para-like Sincecells,
cortical the
morphology
respectively, of macrofibril
as was shown in wasTEMapparently
study bydifferent,
Bryson et we couldSince
al. [12]. understand which cortical
the morphology cell is
of macrofibril
para-like or ortho-like.
was apparently different, we could understand which cortical cell is para-like or ortho-like.
(a) (b)
Figure
Figure 4.
4. Observations
Observationsof of transverse
transversecross
cross sections
sections of
of African-American
African-Americanhairs.hairs.(a)
(a)An
Anexample
exampleof ofaa
fluorescence
fluorescencelight
lightmicroscope
microscopeimage
imageofofaasection
sectionstained
stainedwith
withtwo
twofluorescent
fluorescentdyes;
dyes;(b)
(b)ananamplitude
amplitude
image
image(5(5××5 5μm)
µm)from
froman
anatomic
atomicforce
forcemicroscope
microscope(AFM)
(AFM)atatthe
thecenter
centerpart
partofofaahair.
hair.InInboth
bothpictures,
pictures,
the
thearrows
arrowsindicate
indicatethe
thecurvature
curvature directions
directions from
from the
the convex
convex toto the concave side.
Figure5a
Figure 5ashows
showsthe the histograms
histograms of elastic
of elastic modulus
modulus (Emf)(Einside
mf ) inside macrofibrils
macrofibrils determined
determined by AFM by
AFM nanoindentations
nanoindentations for para-like
for para-like and ortho-like
and ortho-like corticalcortical cells
cells for thefor the sample
sample same same as Figure
as Figure 4b. The4b.
The averaged
averaged elasticelastic
modulusmodulus
was 4.0was ± 0.6 ± 0.6for
4.0 GPa GPathefor the para-like
para-like corticalcortical
cells andcells
4.0and
± 0.5 ± 0.5
4.0GPa for GPa
the
for the ortho-like
ortho-like cortical
cortical cells. cells.5bFigure
Figure is the 5b is the
result forresult
a hairfor
of aJapanese
hair of Japanese
female aged female aged
57. In the57. In the
hair, the
hair, the distribution of two cortical cell types was not clearly separated bilaterally,
distribution of two cortical cell types was not clearly separated bilaterally, but we could distinguish but we could
distinguish
them them
from their from theirimages.
amplitude amplitude images. The
The averaged averaged
elastic modulus elastic
wasmodulus
3.8 ± 0.5 was for ±
GPa 3.8 the0.5 GPa for
para-like
the para-like
cortical cortical
cells and 3.7 ±cells
0.5 and
GPa3.7for±the 0.5ortho-like
GPa for the ortho-like
cortical cells.cortical cells.cases
In the two In the two casesabove,
described described
the
above, the values for para- and ortho-like cortical cells were almost same
values for para- and ortho-like cortical cells were almost same and there was no significant and there was no significant
difference to
difference to explain
explain the
the large
large difference
difference in macroscopic bending modulus.Cosmetics 2019, 6, 24 7 of 11
Cosmetics 2019, 6, x FOR PEER REVIEW 7 of 11
(a) (b)
Figure5. Histograms
Figure 5. Histograms of modulus
of elastic elastic modulus inside (E
inside macrofibrils macrofibrils
mf ) evaluated(Eby mf)AFM
evaluated by AFM
nanoindentations
about 27 ◦ C and at
atnanoindentations about
65% RH. 27
(a) °C
an and 65% RH. (a) an
African-American African-American
hair; (b) a Japanese hair.hair;Black
(b) abars,
Japanese hair.
para-like
cortical cells; shaded
Black bars, bars,
para-like ortho-like
cortical cells;cortical
shaded cells. Theortho-like
bars, total indentation
corticalnumbers
cells. Theweretotal
134 and 119 for
indentation
para-like
numbersand were ortho-like
134 and cortical cells in (a),
119 for para-like andrespectively,
ortho-like and 119 cells
cortical and 105 forrespectively,
in (a), para-like andand ortho-like
119 and
cortical
105 for cells in (b),and
para-like respectively.
ortho-like Thecortical cells inE(b),
averaged mf values of para-like
respectively. and ortho-like
The averaged cortical
Emf values cells for
of para-like
the
andAfrican-American
ortho-like corticalhair were
cells same (4.0 GPa) andhair
for the African-American those for the
were the same
Japanese
(4.0 hair
GPa)were
and 3.8 GPa
those forand
the
3.7 GPa, respectively.
Japanese hair were 3.8 GPa and 3.7 GPa, respectively.
4. Discussion
4. Discussion
Macroscopic physical properties such as hair shape or stiffness should be reflected in microscopic
Macroscopic physical properties such as hair shape or stiffness should be reflected in
properties such as the cells composing the hair fiber and, furthermore, those of the cell components
microscopic properties such as the cells composing the hair fiber and, furthermore, those of the cell
such as proteins and their assemblies. It has previously been determined that the internal distribution
components such as proteins and their assemblies. It has previously been determined that the
of cortical cell types is attributed to the macroscopic hair shape [12] and the increase in curliness
internal distribution of cortical cell types is attributed to the macroscopic hair shape [12] and the
with aging relates to the increase in inhomogeneity of the cortical cell distribution [16]. In this study,
increase in curliness with aging relates to the increase in inhomogeneity of the cortical cell
we propose a relationship between macroscopic bending modulus and microscopic internal structure.
distribution [16]. In this study, we propose a relationship between macroscopic bending modulus
andThe
4.1. microscopic internal structure.
Effect of Cuticle
Sogabe
4.1. The et al.
Effect [19] reported that the modulus of the hair cuticle was four times higher than that of the
of Cuticle
cortex and the cuticle contribution to the elasticity of a whole fiber was up to 60%. However, in previous
Sogabe et al. [19] reported that the modulus of the hair cuticle was four times higher than that
work with large numbers of hair fibers having had their cuticle scales physically removed, the bending
of the cortex and the cuticle contribution to the elasticity of a whole fiber was up to 60%. However,
modulus of the cuticle was found to be similar to that of the cortex [20]. Caldwell and Bryson [18] also
in previous work with large numbers of hair fibers having had their cuticle scales physically
revealed that the elastic modulus of the cuticle was similar to that of the cortex for wool fibers, using
removed, the bending modulus of the cuticle was found to be similar to that of the cortex [20].
the AFM nanoindentation method. Since the cuticle component exists at the outermost region of the
Caldwell and Bryson [18] also revealed that the elastic modulus of the cuticle was similar to that of
hair, there is no doubt that the contribution of the cuticle on bending elasticity is higher than would
the cortex for wool fibers, using the AFM nanoindentation method. Since the cuticle component
be expected if the whole fiber were homogeneous. Swift [21] predicted the contribution of cuticle
exists at the outermost region of the hair, there is no doubt that the contribution of the cuticle on
(thickness 5 µm) to hair bending stiffness to be 30%–80% with a simple model. The contribution varies
bending elasticity is higher than would be expected if the whole fiber were homogeneous. Swift [21]
according to the cuticle thickness and hair major and minor diameters. In the present study, since the
predicted the contribution of cuticle (thickness 5 μm) to hair bending stiffness to be 30%–80% with a
thickness and ratio of the cuticle for each sample was not evaluated, it is impossible to estimate the
simple model. The contribution varies according to the cuticle thickness and hair major and minor
contribution of the cuticle accurately. One of the reasons why the correlation in Figure 3 is not so high
diameters. In the present study, since the thickness and ratio of the cuticle for each sample was not
could be due to the difference in the contribution of the cuticle.
evaluated, it is impossible to estimate the contribution of the cuticle accurately. One of the reasons
why
4.2. the
The correlation
Effect in Cell
of Cortical Figure
Type3 Distribution
is not so high could be due to the difference in the contribution of
the cuticle.
For naturally curly hair like an African-American hair, in which ortho-like and para-like cortices
are
4.2.clearly separated
The Effect (Figure
of Cortical 4a), Distribution
Cell Type the inhomogeneous distribution would be expected to affect the
bending direction and thus the hair bending modulus cannot only be expressed by the fraction of the
For cortical
different naturally cellcurly
typeshair like inanthe
present African-American
hair, as indicated hair, in which
in Figure 3. By ortho-like and Japanese
contrast, most para-like
cortices
hairs haveare clearly
less separated
curly shapes and(Figure
smaller4a), the inhomogeneous
internal inhomogeneitiesdistribution would be expected
than African-American to
hairs [14].
affect the bending direction and thus the hair bending modulus cannot only be expressed by the
fraction of the different cortical cell types present in the hair, as indicated in Figure 3. By contrast,Cosmetics 2019, 6, 24 8 of 11
As a result, with little contribution of differences in the cell distribution, the bending modulus of
Japanese hair showed the simple trend that the more the para-like cortex, the higher the modulus of
macroscopic properties (Figure 3).
4.3. The Reason Why the Para-Like Cortex Is Stiffer Than the Ortho-Like Cortex
With the force volume AFM technique on wool fiber cross sections, it was reported that the mean
elastic modulus of the paracortex was 3.7 GPa and that of the orthocortex 3.3 GPa [18]. These elastic
modulus values are close to the values for human hair obtained in this study. Breakspear et al. [20]
examined the AFM nanoindentation study on Japanese female hairs, and reported that the elastic
modulus of the cortex part varied from 3.6 GPa to 0.7 GPa according to the RH, and was 1.9 GPa at
27 ◦ C and 65.5% RH. The cortex type is not known but this result is smaller than the values of the
present study. This difference could be due to a combination of the individual differences in hair
properties being considerable and the determination of modulus is being appreciably affected by the
experimental conditions such as the cantilever type used, etc. Despite such variation of elastic modulus
determined by AFM nanoindentation under different conditions, it is reasonable to expect that, if the
measurements are performed on the same hair cross section under the same conditions, it should be
possible to directly compare the elastic modulus values from the two parts without influence from
inter-fiber differences or experimental condition variations. With a similar consideration, it is also
suggested that there is no significant difference between the two cortical cell types in elastic modulus
inside macrofibrils composed of IFs and KAPs.
This may seem inconsistent with the result that the bending modulus significantly correlated with
the fraction of para-like cortical cells to the whole cortex. Three possible reasons are proposed as to
why the para-like cortex is stiffer than the ortho-like cortex. The first possibility is the difference in the
volume fraction of IFs and matrix. In wool fiber, the volume fraction of matrix in the paracortical cell
is more than that in the orthocortical cell [22,23]. As for human hair, it has been found by small angle
microbeam X-ray scattering measurements that the volume fraction of the matrix existing between
IF–IF is richer in the para-like than that in the ortho-like cortical cells [13,14]. KAPs, constituents of the
matrix, are amorphous cysteine-rich proteins and are, therefore, supposed to contain a large number of
intra- and inter-molecular cross linkages [24]. By amino acid analyses of human curly hairs, it has been
found that the concave side of the curl has higher cysteine content than the convex side, meaning that
cysteine is richer in para-like cortical cells [11]. Furthermore, in the case of wool, it has been shown that
cysteine rich KAP1, 2, and 3 families are expressed in both cell types but the KAP4 family, ultra-high
sulfur proteins, is only expressed in the paracortical cell, while high glycine tyrosine proteins are more
abundant in the orthocortical cell [3]. These facts suggest that the degree of cross linkages is higher in
the para-like cortical cell and this may make the para-like cortex stiffer.
The second possibility is the difference in IF arrangement in the cortical cells. In the para-like
cortical cell, IFs mostly align in parallel to the fiber axis, and hence, it may be necessary to extend IF
molecules that consist of α-helices in order to extend a para-like cortical cell longitudinally. In the
ortho-like cortical cell, on the other hand, the IFs align helically, therefore, longitudinal deformation
can occur by rearranging the IF’s tilt angle. That is, in the ortho-like cortical cell, the IF molecule itself
does not have to be deformed and, instead, the deformation stress is absorbed just by the changing tilt
angle. As a result, the resistance against the deformation is less and, consequently, the elastic modulus
becomes smaller for the ortho-like cortices than those for the para-like ones.
The third possibility is the difference in morphology of macrofibrils. In the ortho-like cortical cell,
macrofibrils are separated from one another and each is surrounded by intermacrofibrillar materials
(IMM) [12]. In the para-like cortical cell, on the other hand, the macrofibrils seem to be fused and less
IMM is observed. The components of IMM are thought to be residues from cytoplasm and nuclear
remnants [3] (p. 88). Kitano et al. [25] showed that IMM is softer than macrofibrils in air at 25 ◦ C and
37% RH by the force modulation method of AFM. Since IMM has no regular structure and is easily
deformable, the ortho-like cortical cell has lower elastic modulus than the para-like cortical cell.Cosmetics 2019, 6, 24 9 of 11
The size of the AFM cantilever tip is larger than the diameter of IFs, while smaller than that of
macrofibrils. The results by AFM nanoindentation should mainly reflect the elasticity of macrofibrils
composed of IFs and KAPs and do not directly reflect that of cortical cells, the assemblies of macrofibrils.
The first and second possibilities described above relate to the properties of macrofibrils and may affect
the AFM nanoindentation result. However, since the differences in modulus by AFM nanoindentation
were quite small between the para-like and ortho-like cortical cells, the first and second possibilities
are not feasible due to the reason of the larger difference in macroscopic bending modulus. In contrast,
the third possibility, which reflects the properties of the assemblies of macrofibrils, cortical cells, is the
most reasonable. In order to elucidate the mechanism, it would be necessary to measure the modulus
of cortical cells and so determine the contribution of IMM. However, there are no currently available
methods to do this.
4.4. The Decrease in Hair Volume with Aging and a Potential Approach to Solve It
Hair thinning is a critical issue for aged persons. In male hair thinning, the hair miniaturization
occurs at the front or the crown of the head and it is caused by the shortening of the hair growing
period [26]. On the other hand, in female hair thinning, the diffuse reduction in hair density occurs
over the top of the head [27,28]. Although most cases do not reach the diagnosis of hair thinning or
hair loss, many Japanese women in over their 50s are conscious of the hair volume reduction. The main
causes for this could be the decreases in hair fiber thickness [29] and in fiber numbers [28]. From the
data obtained in this study, E was independent of age (Figure 1). However, even if the value of E has
no correlation with the decrease in hair volume by aging, in view of the phenomenon of there being a
twofold difference in bending modulus, increasing the fraction of the para-like cortical cell would be a
possible approach to improving hair volume for them.
The fractions and the distribution of the para-like and ortho-like cortical cells are likely to be
controlled by gene expression in hair follicles. Li et al. [30] suggested that wool fibers of the felting
luster mutation found in Merino sheep consisted of only paracortical cells. The mutant wool is shiny
and lacks crimp. These changes seem to be attributed to the decrease in inhomogeneous distributions
of cortical cell types due to the lack of the orthocortex. As for elastic modulus of the mutant fibers,
however, no data were shown. In the case of the mutant wool comprising only paracortex, extreme
down regulation of three genes, encoding high glycine/tyrosine proteins that are rich in orthocortex,
was found [30]. In the case of human hairs, if the difference in gene expressions in hair follicles between
the hair rich in the para-like cortex and the hair rich in the ortho-like cortex is elucidated, it will be an
important finding for the technology to control the hair stiffness and hair volume from the living part
of the hair.
5. Conclusions
Hair bending modulus depends on the fractions of the constitutional cortical cell types. The hair
of a higher fraction of para-like cortical cells has higher bending modulus. The contribution of the
intermacrofibrillar material is plausible as a cause of the difference in the modulus of the cortical cell
types. Further investigation, however, is required to completely understand the macroscopic modulus
from a microscopic point of view.
Author Contributions: Conceptualzation, S.N. and T.I.; methodology, S.N.; investigation, Y.E., A.M., S.I. and T.I.;
writing; T.I.; supervision, K.K.
Funding: This research received no external funding.
Acknowledgments: The authors express their gratitude to Warren G. Bryson, formerly of Canesis Network
Limited, and Jolon Dyer of AgResearch Limited for useful discussions. We thank Steven Breakspear of Kao
Germany GmbH for useful discussions and his kind editing of English for this publication.
Conflicts of Interest: The authors declare no conflict of interest.Cosmetics 2019, 6, 24 10 of 11
References
1. Parry, D.A.D.; Steinert, P.M. Intermediate filaments: Molecular architecture, assembly, dynamics and
polymorphism. Q. Rev. Biophys. 1999, 32, 99–187. [CrossRef] [PubMed]
2. Robbins, C.R. Chemical and Physical Behavior of Human Hair, 5th ed.; Springer: Berlin/Heidelberg, Germany,
2012; pp. 53–63. ISBN 978-3-642-25611-0.
3. Powell, B.C.; Rogers, G.E. The role of keratin proteins and their genes in the growth, structure and properties
of hair. In Formation and Structure of Human Hair; Jollès, P., Zahn, H., Höcker, H., Eds.; Birkhäuser Verlag:
Basel, Switzerland, 1997; pp. 59–148. ISBN 3-7643-5119-5.
4. Rogers, M.A.; Langbein, L.; Praetzel-Wunder, S.; Hermelita, W.; Schweizer, J. Human Hair Keratin-Associated
Proteins (KAPs). Int. Rev. Cytol. 2006, 251, 209–263. [CrossRef] [PubMed]
5. Mercer, E.H. The heterogeneity of the keratin fibers. Text. Res. J. 1953, 23, 388–397. [CrossRef]
6. Horio, M.; Kondo, T. Crimping of wool fibers. Text. Res. J. 1953, 23, 373–386. [CrossRef]
7. Rogers, G.E. Electron Microscopy of Wool. J. Ultrastruct. Res. 1959, 2, 309–330. [CrossRef]
8. Bryson, W.G.; Mastronarde, D.N.; Caldwell, J.P.; Nelson, W.G.; Woods, J.L. High voltage microscopical
imaging of macrofibril ultrastructure reveals the three-dimensional spatial arrangement of intermediate
filaments in Romney wool cortical cells–A causative factor in fibre curvature. In Proceedings of the 10th
International Wool Textile Research Conference, Aachen, Germany, 26 November–1 December 2000.
9. Swift, J.A. Morphology and histochemistry of human hair. In Formation and Structure of Human Hair; Jollès, P.,
Zahn, H., Höcker, H., Eds.; Birkhäuser Verlag: Basel, Switzerland, 1997; pp. 149–175. ISBN 3-7643-5119-5.
10. Thibaut, S.; Barbarat, P.; Leroy, F.; Bernard, B.A. Human hair keratin network and curvature. Int. J. Dermatol.
2007, 46 (Suppl. 1), 7–10. [CrossRef]
11. Nagase, S.; Tsuchiya, M.; Matsui, T.; Shibuichi, S.; Tsujimura, H.; Masukawa, Y.; Satoh, N.; Itou, T.; Koike, K.;
Tsujii, K. Characterization of curved hair of Japanese women with reference to internal structures and amino
acid composition. J. Cosmet. Sci. 2008, 59, 317–332.
12. Bryson, W.G.; Harland, D.P.; Caldwell, J.P.; Vernon, J.A.; Walls, R.J.; Woods, J.L.; Nagase, S.; Itou, T.; Koike, K.
Cortical cell types and intermediate filament arrangements correlate with fiber curvature in Japanese human
hair. J. Struct. Biol. 2009, 166, 46–58. [CrossRef]
13. Kajiura, Y.; Watanabe, S.; Itou, T.; Iida, A.; Shinohara, Y.; Amemiya, Y. Structural analysis of single wool fibre
by scanning microbeam SAXS. J. Appl. Cryst. 2005, 38, 420–425. [CrossRef]
14. Kajiura, Y.; Watanabe, S.; Itou, T.; Nakamura, K.; Iida, A.; Inoue, K.; Yagi, N.; Shinohara, Y.; Amemiya, Y.
Structural analysis of human hair single fibres by scanning microbeam SAXS. J. Struct. Biol. 2006, 155,
438–444. [CrossRef]
15. Mamada, A.; Nakamura, K. A study of the volume and bounce decrease in hair with aging using bending
elasticity measurements. J. Cosmet. Sci. 2007, 58, 485–494.
16. Nagase, S.; Kajiura, Y.; Mamada, A.; Abe, H.; Shibuichi, S.; Satoh, N.; Itou, T.; Shinohara, Y.; Amemiya, Y.
Changes in structure and geometric properties of human hair by aging. J. Cosmet. Sci. 2009, 60, 637–648.
[CrossRef] [PubMed]
17. ImageJ. Available online: https://imagej.nih.gov/ij/ (accessed on 4 August 2006).
18. Caldwell, J.P.; Bryson, W.G. Elastic modulus mapping of the wool fibre cellular structure by atomic
force microscopy. In Proceedings of the 11th International Wool Textile Research Conference, Leeds, UK,
4–9 September 2005.
19. Sogabe, A.; Yasuda, M.; Noda, A. Physical properties of human hair. 1. Evaluation of bending stress by
measuring the major and the minor axis of human hair. J. Soc. Cosmet. Chem. Jpn. 2002, 36, 207–216.
[CrossRef]
20. Breakspear, S.; Mamada, A.; Itou, T.; Noecker, B. Contribution of the cuticle to the stiffness of human hair:
Significant or minor? IFSCC Mag. 2015, 18, 25–34.
21. Swift, J.A. Some simple theoretical considerations on the bending stiffness of human hair. Int. J. Cosmet. Sci.
1995, 17, 245–253. [CrossRef]
22. Rogers, G.E. Electron microscope studies of hair and wool. Ann. N. Y. Acad. Sci. 1959, 83, 378–399. [CrossRef]
[PubMed]
23. Dobb, M.G. Electron-diffraction studies of keratin cells. J. Text. Inst. 1970, 61, 232–234. [CrossRef]Cosmetics 2019, 6, 24 11 of 11
24. Fraser, R.D.B.; MacRae, T.P.; Sparrow, L.G.; Parry, D.A.D. Disulphide bonding in α-keratin. Int. J.
Biol. Macromol. 1988, 10, 106–112. [CrossRef]
25. Kitano, H.; Yamamoto, A.; Niwa, M.; Fujinami, S.; Nakajima, K.; Nishi, T.; Naito, S. Young’s modulus
mapping on hair cross-section by atomic force microscopy. Compos. Interfaces 2009, 16, 1–12. [CrossRef]
26. Hamilton, J.B. Patterned loss of hair in man: Types and incidence. Ann. N. Y. Acad. Sci. 1951, 53, 708–728.
[CrossRef]
27. Ludwig, E. Classification of the types of androgenetic alopecia (common baldness) occurring in the female
sex. Br. J. Dermatol. 1977, 97, 247–254. [CrossRef] [PubMed]
28. Birch, M.P.; Messenger, J.F.; Messenger, A.G. Hair density, hair diameter and the prevalence of female pattern
hair loss. Br. J. Dermatol. 2001, 144, 297–304. [CrossRef] [PubMed]
29. Ootsuka, H.; Nemoto, T. Study on Japanese hair. Koshokaishi 1988, 12, 192–197.
30. Li, S.W.; Ouyang, H.S.; Rogers, G.E.; Bawden, C.S. Characterization of the structural and molecular defects in
fibres and follicles of the merino felting lustre mutant. Exp. Dermatol. 2008, 18, 134–142. [CrossRef] [PubMed]
© 2019 by the authors. Licensee MDPI, Basel, Switzerland. This article is an open access
article distributed under the terms and conditions of the Creative Commons Attribution
(CC BY) license (http://creativecommons.org/licenses/by/4.0/).You can also read