IN-STORE BAKERY EXPERIENCE - CANADA, NOVEMBER 2018 - Mintel
←
→
Page content transcription
If your browser does not render page correctly, please read the page content below

IN-STORE BAKERY EXPERIENCE
CANADA, NOVEMBER 2018
NEXT 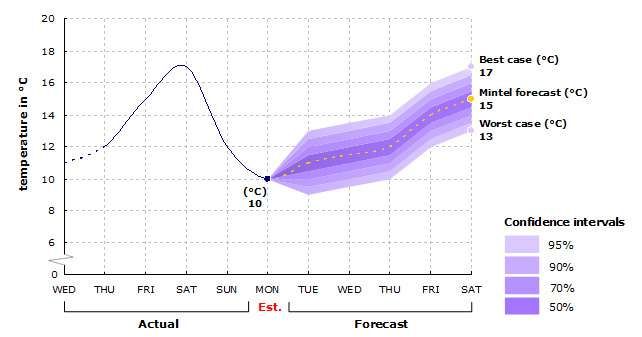
IN-STORE BAKERY EXPERIENCE - CANADA - NOVEMBER 2018 2
OVERVIEW
What you need to know Other areas where baked goods are purchased at retail
Canada’s grocery retail landscape is changing. While much of the • Bread from a supermarket aisle (eg Wonder Bread)
chatter revolves around online shopping, the fact remains that
most grocery “trips” happen on site. That said, the evolving divide • Dessert mix from a supermarket aisle (eg brownie mix, cake mix)
between online and bricks and mortar means that to maintain an
advantage, retailers are increasingly pressured to offer experiences • Boxed pastry from supermarket aisle (eg toaster pastries, Pop-
that are relevant. In-store bakeries are a part of this equation. While Tarts)
freshness is of core value for in-store bakeries, it’s not the only
point of differentiation. Aside from assortment, retailers can look to • Boxed sweet baked goods from supermarket aisle (eg cookies,
model their bakeries to meet the variety of demands that today’s brownies)
consumers have. This extends beyond indulgent desserts, but also
to snacks that can prove healthier for earlier parts of the day when • Frozen pie or cake from supermarket freezer case (eg McCain
consumers are more likely to consider factors related to health, Deep n’ Delicious, Sara Lee)
energy and portability. In-store bakeries that work in concert with
other in-store departments executing as part of a broader strategy Retail Sales:
to provide contemporary day-to-day meal and snack solutions stand
to be more relevant. • Bread and bread products: this market covers packaged white
and non-white bread, savoury specialty breads and savoury
Definition pastries & pies. Market size comprises sales through all retail
channels including direct to consumer. This market covers
For the purposes of this Report, Mintel has used the following packaged white and non-white bread, specialty breads and
definitions for in-store bakeries and for where baked goods are savoury pastries & pies. Market size comprises sales through
purchased more broadly. Bakery items purchased from foodservice all retail channels including direct to consumer. It includes sales
(eg restaurants) are not included when looking at in-store bakeries through in-store bakeries unless stated otherwise.
on the whole.
• Sweet bakery: this market covers wrapped ambient and chilled
Consumer data: cakes, pies, tarts and other sweet bakery products. It excludes
frozen products. Market size comprises sales through all retail
In-store bakery channels including direct to consumer.
• Bread from an in-store bakery (eg bakery in a grocery store)
• Sweet baked goods from an in-store bakery (eg bakery in a
grocery store)
Stand-alone bakery shop
• Bread from a stand-alone bakery shop
• Sweet baked goods from a stand-alone bakery shop
PREVIOUS © Mintel Group Ltd. All rights reserved. NEXT IN-STORE BAKERY EXPERIENCE - CANADA - NOVEMBER 2018 3
REPORT CONTENT
OVERVIEW
What you need to know
Definition
EXECUTIVE SUMMARY
The issues
Stand-alone bakeries represent an area of competition
Figure 1: Opinions on in-store vs stand-alone bakery, August 2018
Longer-term stagnation in baked good sales
Figure 2: Retail market volume consumption per capita of bread and bread products and sweet bakery, 2013-2017
Younger consumers are less likely to make purchases from in-store bakeries
Figure 3: Purchase at in-store bakeries, by age, August 2018
The opportunities
Fresh-focus is at heart of in-store bakery’s appeal
Figure 4: Important factors when choosing a product from an in-store bakery, August 2018
Cross-daypart opportunities helps drive more frequent product usage
Figure 5: Correspondence Analysis – Snacking occasions, July 2016
New flavours and less-familiar formats represent an opportunity to differentiate
Figure 6: Interest in flavour and format innovation from in-store bakeries, August 2018
What it means
THE MARKET
WHAT YOU NEED TO KNOW
Bread and sweet bakery sales are soft
Canadians strive to eat healthy most of the time
Immigration fuelling Canada’s population growth
MARKET SIZE AND FORECAST
Bread sales to remain relatively flat
Figure 7: Canada retail value sales and fan chart forecast of bread & bread products, at current prices, 2012-23
Figure 8: Canada retail value sales forecast of bread & bread products, at current prices, 2012-23
Modest growth forecast for sweet bakery
Figure 9: Canada retail value sales and fan chart forecast of sweet bakery, at current prices, 2012-23
Figure 10: Canada retail value sales and fan chart forecast of sweet bakery, at current prices, 2012-23
MARKET FACTORS
Canadians are more time-pressed
Most Canadians live in urban areas
Figure 11: Share of Canadians that live in urban and rural areas, 1851-2016
Mobile technology enabling unprecedented opportunity to interact
Figure 12: Mobile and smartphone penetration, by age group, May 2017
Immigration fuelling Canada’s population growth
Figure 13: Top 10 countries of birth of recent immigrants, 2011-16
Canada’s population is aging
Figure 14: Population aged 65 years and over in Canada, historical and projected (% of total), 1971-2061
Canadians strive to eat healthy most of the time…
Figure 15: Healthy eating, November 2016
...but flexibility may be contributing to the high obesity rates
Figure 16: Body mass index, self-reported rate of being overweight or obese among Canadian adults, by gender, 2010-14
PREVIOUS © Mintel Group Ltd. All rights reserved. NEXT IN-STORE BAKERY EXPERIENCE - CANADA - NOVEMBER 2018 4
KEY PLAYERS
WHAT YOU NEED TO KNOW
Carb-consciousness diets represent a potential challenge to growth
Snackable baked goods are an opportunity
Baked goods for specific diet to become more prominent
WHAT’S WORKING?
Demand for better experiences a potential growth-booster
CHALLENGES
Carb-consciousness diets represent a potential challenge to growth
Figure 17: Mojo Me Chocolate Brownies (South Africa), July 2018
Figure 18: Julian Bakery Pegan Ginger Snack Cookie Protein Bar (US), March 2017
Figure 19: Julian Bakery Paleo Wraps (US), August 2018
Figure 20: Growfit Ultra Low Carb Flower (India), June 2018
WHAT’S NEXT?
Snackable baked goods are an opportunity
Figure 21: Correspondence analysis – snacking occasions - July 2016
Baked goods for specific diet to become more prominent
Figure 22: Strawberries & Cream Artisan Raw Cake (UK), July 2018
Figure 23: Lazy Day Foods Free From Tiffin Bites (UK), March 2018
Figure 24: Vega Divas Baked Goods & Desserts Banana Chocolate Cupcakes-to-Go (USA), January 2018
Figure 25: Vegan Cocoa & Goji Berry Muffins (South Africa), July 2018
Figure 26: Probios Go Vegan! Organic Vegan Wheat Croissant with Chocolate Cream (UK), March 2018
Figure 27: The Free From Bakehouse Bakery Banana &Date Flapjack (UK), July 2018
Figure 28: Ozery Bakery Organic Morning Rounds Cranberry Orange Flavoured Toastable Fruit and Grain Buns (UK), November 2017
THE CONSUMER
WHAT YOU NEED TO KNOW
In-store bakery’s importance reflect Canada’s retail evolution
Demand for freshness reflects core appeal of in-store bakery
Opportunity to bring theatre to the bakery
Looking abroad can be an inspiration for innovation at home
Foodservice focus can help focus innovation for growth
IN-STORE BAKERY USAGE
In-store bakery’s importance reflect Canada’s retail evolution
Figure 29: Locations where baked are purchased, August 2018
Over half of consumers made a recent in-store bakery purchase
Figure 30: When and where baked goods are purchased, August 2018
Young women key to growing bread at in-store bakery
Figure 31: When bread from an in-store bakery was purchased, women 18-34 vs overall, August 2018
Foodservice focus can help focus innovation for growth
Figure 32: Correspondence Analysis – Principal map – Purchase location, August 2018
Figure 33: Where bread and desserts are purchased, by age group, August 2018
CHOICE FACTORS
Demand for freshness reflects core appeal of in-store bakery
Figure 34: Important factors when choosing a product from an in-store bakery, August 2018
Canadians are looking for natural baked goods
Figure 35: Importance of all-natural ingredients when choosing a product from an in-store bakery, by age, August 2018
Added nutrition is a purchase driver
Figure 36: Importance of nutrition-related considerations when choosing a product from an in-store bakery, by age, August 2018
New flavours reflects opportunity to differentiate
Figure 37: Importance of flavour combinations when choosing a product from an in-store bakery, by age, August 2018
PREVIOUS © Mintel Group Ltd. All rights reserved. NEXT IN-STORE BAKERY EXPERIENCE - CANADA - NOVEMBER 2018 5
It’s important to remember value’s importance to younger consumers
Figure 38: Importance of price vs “baked on same day”, by age group, August 2018
OPPORTUNITIES FOR INNOVATION
Opportunity to bring theatre to the bakery
Provenance can be the basis for story
Figure 39: Areas of interest from in-store bakeries, August 2018
Looking abroad can be an inspiration for innovation at home
Figure 40: Interest in internationally-inspired options from in-store bakeries, Chinese Canadians vs overall, August 2018
Canadians fall for seasonal flavours
Figure 41: Interest in seasonally-inspired options from in-store bakeries, 18-34s with household incomes of $70K or more vs overall, August 2018
Demand for health innovation at in-store bakeries requires context
Figure 42: Interest in health-related considerations from in-store bakeries, 18-44s vs over-45s, August 2018
CONSUMER SEGMENTS
Success with women key to in-store bakery’s success
Figure 43: Purchase of sweet baked goods from in-store bakeries, by gender, age and parental status, August 2018
Figure 44: Purchase of sweet baked goods from in-store bakeries, by gender, August 2018
Flavour and format exploration key to winning over Chinese Canadians
Figure 45: Purchase of sweet baked goods from in-store bakeries, Chinese Canadians vs overall, August 2018
Figure 46: Interest in select options from in-store bakeries, Chinese Canadians vs overall population, August 2018
APPENDIX
DATA SOURCES AND ABBREVIATIONS
Data sources
Sales Data
Consumer survey data
Correspondence analysis
Abbreviations and terms
Abbreviations
PREVIOUS © Mintel Group Ltd. All rights reserved. NEXT IN-STORE BAKERY EXPERIENCE - CANADA - NOVEMBER 2018 6
DATABOOK CONTENT
Standard demographics vyou can expect to see tracked in our Databooks:
• Gender
• Age
• Gender/age combined
• Generation
• Race/Hispanic origin
• Geographic region
• Geographic area (urban, suburban, rural)
• Household income
• Age/income combined
• Employment status
• Education level
• Presence and number of children in the household
• Household size
• Marital status
• Home ownership status
• Social media usage
• Mobile device ownership
Consumer Research
Q1 Which of the following items have you purchased in the past 3 months? Please select all that apply.
Q1 Which of the following items have you purchased in the past 3 months? Please select all that apply., by demographics
Q2 When did you last purchase each of the following items?
Q2 When did you last purchase each of the following items?, by demographics
Q3 When did you last purchase each of the following items?
Q3 When did you last purchase each of the following items?, by demographics
Q4 Which of the following are important to you when choosing a product from an in-store bakery? Please select all that apply.
Q4 Which of the following are important to you when choosing a product from an in-store bakery? Please select all that apply., by
demographics
Q5 Which of the following baked good options would interest you from in-store bakeries? Please select all that apply.
Q5 Which of the following baked good options would interest you from in-store bakeries? Please select all that apply., by demographics
Q6 Where would you typically go to purchase the following items? Please select all that apply.
Q6 Where would you typically go to purchase the following items? Please select all that apply., by demographics
Q7 Where would you typically go to purchase the following items? Please select all that apply.
Q7 Where would you typically go to purchase the following items? Please select all that apply., by demographics
Q8 Where would you typically go to purchase the following items? - NET
Q8 Where would you typically go to purchase the following items? - NET, by demographics
Q9 Where would you typically go to purchase the following items? Please select all that apply.
Q9 Where would you typically go to purchase the following items? Please select all that apply., by demographics
Q10 Which of the following statements about bakery items do you agree with? Please select all that apply.
Q10 Which of the following statements about bakery items do you agree with? Please select all that apply., by demographics
Demographics By Demographics
Demographics by demographics
PREVIOUS © Mintel Group Ltd. All rights reserved. NEXT REPORT, US - YEAR MONTH 7 RESEARCH METHODOLOGY PREVIOUS NEXT
CANADA RESEARCH METHODOLOGY 8
Canada Research Methodology
Mintel is an independent market analysis
research has been conducted using a Female, 18-24 6.9 139
company that prides itself on supplying
device agnostic platform for online surveys
objective information on a whole range of Female, 25-34 8.8 177
(ie respondents can now take surveys from
markets and marketing issues. Female, 35-44 9.4 188
a smartphone in addition to a computer or
There are six main sources of research that tablet). This methodology change may result Female, 45-54 8.7 174
are used in the compilation of Mintel reports: in data differences from previous years; any
Female, 55-64 8.6 172
trending should be done with caution.
• Consumer research Female, 65+ 8.5 170
Sampling
• Social media research Total 100 2,000
Online Surveys
• Desk research
Lightspeed
• Trade research Region % N
Founded in 1996, Lightspeed's double Ontario 40.2 804
• Statistical forecasting opt-in U.S. online consumer panel contains Quebec 22.1 443
approximately 1.27 million U.S. consumers. British Columbia 13.3 265
Mintel reports are written and managed by Lightspeed recruits its panelists through
Alberta 10.7 214
analysts with experience in the relevant many different sources including web
Saskatchewan 3.0 61
markets. advertising, permission-based databases
and partner-recruited panels. Note: Manitoba 4.8 95
Consumer research Lightspeed GMI was re-branded as Atlantic Provinces
Lightspeed in September 2016. (New Brunswick,
Newfoundland/
Exclusive and original quantitative 5.9 118
Labrador, Nova
consumer research is commissioned Mintel sets quotas on age and gender,
Scotia, Prince
for almost all Mintel reports. In addition, region, and household income. Specific Edward Island)
qualitative research is also undertaken for quotas for a sample of 2,000 adults aged
a large proportion of reports in the form of 18+ are shown below. Total* 100 2,000
online discussion groups. Mintel invests a
considerable sum each year in consumer Please note: these quotas are only *Mintel does not include rural regions such as the Yukon
research, and the purchaser of a Mintel representative of a standard General or the Northwest Territories (including Nunavut) in its
report benefits, as the price of an individual Population survey sample of 2,000 internet research. Thus the consumer research data does not
report is less than the cost of the original users aged 18+. Sample size, targets, and reflect opinions and behaviours of the population living in
research alone. The research brings an quotas may vary per report. Please see the those areas.
up-to-date and unique insight into topical Report Appendix for further details.
issues of importance. Household income % N
Age groups by Less than $25,000 14.0 281
Consumer research is conducted among a % N
gender $25,000 - $49,999 20.8 416
nationally representative sample of internet
$50,000 - $69,999 15.0 300
users in Canada and is carried out by Male, 18-24 7.9 158
$70,000 - $99,999 17.8 356
Lightspeed. The results are only available in Male, 25-34 9.1 181 $100,000 and over 32.4 647
Mintel reports. Note that Mintel’s exclusive
research is conducted online in both English Male, 35-44 10.4 207
and French. Male, 45-54 8.1 163 Total 100 2,000
Male, 55-64 6.1 123
Starting in July 2017, Mintel’s consumer Secondary Data Analysis
Male, 65+ 7.4 148
PREVIOUS © Mintel Group Ltd. All rights reserved. NEXT CANADA RESEARCH METHODOLOGY 9
In addition to exclusively commissioned This is a statistical visualisation method for TURF (Total Unduplicated Reach &
surveys, Mintel gathers syndicated data picturing the associations between rows Frequency) analysis identifies the mix
from the most respected consumer (image, attitudes) and columns (brands, of features, attributes, or messages that
research firms. This allows Mintel analysts products, segments, etc.) of a two-way will attract the largest number of unique
to form objective and cohesive analyses contingency table. It allows us to display respondents. It is typically used when the
of consumer attitudes and behaviour. brand images (and/or consumer attitudes number of features or attributes must be
Qualitative Research towards brands) related to each brand or should be limited, but the goal is still to
covered in this survey in a joint space that reach the widest possible audience. By
Revelation by FocusVision is easy to understand. The significance of identifying the Total Unduplicated Reach,
the relationship between a brand and its it is possible to maximize the number
FocusVision provides Mintel with qualitative associated image is measured using the of people who find one or more of their
bulletin board software. This allows the Chi-square test. If two brands have similar preferred features or attributes in the
creation of Internet-based, ‘virtual’ venues response patterns regarding their perceived product line. The resulting output from
where participants recruited from Mintel’s images, they are assigned similar scores TURF is additive, with each additional
online surveys gather and engage in on underlying dimensions and will then feature increasing total reach. The chart
interactive, text-based discussions led by be displayed close to each other in the is read from left to right, with each arrow
Mintel moderators. perceptual map. indicating the incremental change in total
reach when adding a new feature. The final
Further Analysis CHAID analysis bar represents the maximum reach of the
total population when all shown features are
Mintel employs numerous quantitative data CHAID (Chi-squared Automatic Interaction offered.
analysis techniques to enhance the value Detection), a type of decision tree analysis,
of our consumer research. The techniques is used to highlight key target groups in a Social Media Research
used vary form one report to another. Below sample by identifying which sub-groups
describes some of the more commonly used are more likely to show a particular To complement its exclusive consumer
techniques. characteristic. This analysis subdivides the research, Mintel tracks and analyses social
sample into a series of subgroups that share media data for inclusion in selected reports.
Repertoire Analysis similar characteristics towards a specific Using Infegy’s Atlas software, Mintel ‘listens
response variable and allows us to identify in’ on online conversations across a range
This is used to create consumer groups which combinations have the highest of social platforms including Facebook,
based on reported behaviour or attitudes. response rates for the target variable. It is Twitter, consumer forums and the wider
Consumer responses of the same value commonly used to understand and visualise web.
(or list of values) across a list of survey the relationship between a variable of
items are tallied into a single variable. interest such as “interest in trying a new Atlas provides rich consumer insight via
The repertoire variable summarises the product” and other characteristics of the the analysis of commentary posted publicly
number of occurrences in which the value sample, such as demographic composition. on the internet. The system performs
or values appear among a list of survey comprehensive and broad collection of
items. For example, a repertoire of brand Key Driver Analysis data from millions of internet sources,
purchasing might produce groups of those working to ensure a faithful and extensive
that purchase 1-2 brands, 3-4 brands and 5 Key driver analysis can be a useful tool in sampling of feedback from the widest
or more brands. Each subgroup should be helping to prioritise focus between different range of individuals. The dataset contains
large enough (ie N=75+) to analyse. factors which may impact key performance commentary posted in real time, as well as
indicators (eg satisfaction, likelihood to a substantial archive dating back through
Cluster Analysis switch providers, likelihood to recommend 2007.
a brand, etc). Using correlations analysis
This technique assigns a set of individual or regression analysis we can get an Trade research
people in to groups called clusters on the understanding of which factors or attributes
basis of one or more question responses, of a market have the strongest association Informal
so that respondents within the same cluster or “link” with a positive performance on
are in some sense closer or more similar to key performance indicators (KPIs). Hence, Trade research is undertaken for all reports.
one another than to respondents that were we are able to identify which factors or This involves contacting relevant players
grouped into a different cluster. attributes are relatively more critical in a in the trade, not only to gain information
market category compared to others and concerning their own operations, but also
Correspondence Analysis ensures that often limited resources can be to obtain explanations and views of the
allocated to focusing on the main market strategic issues pertinent to the market
drivers. being researched. Such is Mintel’s concern
with accuracy that draft copies of reports are
TURF Analysis sent to industry representatives, to get their
PREVIOUS © Mintel Group Ltd. All rights reserved. NEXT CANADA RESEARCH METHODOLOGY 10
feedback and avoid any misrepresentation as Statistics Canada and the Canadian forecast are collated in Mintel’s own market
of the market. These comments are Grocer. Other information is also gathered size database and supplemented by macro-
incorporated into reports prior to final from store and exhibition visits across and socio-economic data sourced from
publication. Canada, as well as using other databases organisations such as Statistics Canada,
within the Mintel Group, such as the Global The Bank of Canada, The Conference
Formal New Product Database (GNPD), which Board of Canada and the Economist
Internally, Mintel’s analysts undertake monitors FMCG sales promotions. Intelligence Unit.
extensive trade interviews with selected
key experts in the field for the majority of All analysts have access to Mintel’s Market Within the forecasting process, the model
reports. The purpose of these interviews Size and Macroeconomic Databases – searches for, and analyses relationships
is to assess key issues in the market a database containing many areas of between, actual market sizes and a
place in order to ensure that any research consumer spending and retail sales as well selection of key economic and demographic
undertaken takes these into account. as macroeconomic and demographic factors factors (independent variables) in order to
which impinge on consumer spending identify those predictors having the most
In addition, using experienced external patterns.. influence on the market.
researchers, trade research is undertaken
for some reports. This takes the form of The database is used in conjunction with Factors used in a forecast are stated in
full trade interview questionnaires and an SPSS forecasting program which uses the relevant report section alongside an
direct quotes are included in the report and weighted historical correlations of market interpretation of their role in explaining the
analysed by experts in the field. This gives a dynamics, with independent variables, to development in demand for the product or
valuable insight into a range of trade views produce future spending scenarios. market in question.
of topical issues.
Statistical Forecasting Qualitative insight
Desk research
Statistical modelling At Mintel we understand that historic data is
Mintel has an internal team of market limited in its capacity to act as the only force
analysts who monitor: government statistics, For the majority of reports, Mintel produces behind the future state of markets. Thus,
consumer and trade association statistics, five-year forecasts based on an advanced rich qualitative insights from industry experts
manufacturer sponsored reports, annual statistical technique known as ‘multivariate regarding past and future events that may
company reports and accounts, directories, time series auto-regression’ using the impact the market play a crucial role in our
press articles from around the world and statistical software package SPSS. post statistical modeling evaluation process.
online databases. The latter are extracted
from hundreds of publications and websites, Historical market size data feeding into each
both Canada and overseas. All information
is cross-referenced for immediate access.
Data from other published sources are the
latest available at the time of writing the
report.
This information is supplemented by
an extensive library of Mintel’s reports
produced since 1972 globally and added
to each year by the 500+ reports which are
produced annually.
In addition to in-house sources, researchers
also occasionally use outside libraries such
PREVIOUS © Mintel Group Ltd. All rights reserved. NEXT CANADA RESEARCH METHODOLOGY 11
As a result, the Mintel forecast allows for fall within these outer limits, which we call Weather analogy
additional factors or market conditions the best and worst case forecasts. These,
outside of the capacity of the data analysis based on the statistically driven forecast, To illustrate uncertainty in forecasting in
to impact the market forecast model, using are the highest (best case) and lowest an everyday example, let us assume the
a rigorous statistical process complemented (worst case) market sizes the market is following weather forecast was produced
by in-depth market knowledge and expected to achieve. based on the meteorologists’ current
expertise. knowledge of the previous weather condition
Over the next five years, the widening during the last few days, atmospheric
The Mintel fan chart bands successively show the developments observations, incoming weather fronts etc.
that occur within 95%, 90%, 70% and 50%
Forecasts of future economic outcomes probability intervals. Statistical processes Now, how accurate is this forecast and how
are always subject to uncertainty. In order predict the central forecast to fall within the certain can we be that the temperature on
to raise awareness amongst our clients darker shaded area which illustrates 50% Saturday will indeed be 15°C?
and to illustrate this uncertainty, Mintel has probability, i.e. a 5 in 10 chance.
introduced a new way of displaying market To state that the temperature in central
size forecasts in the form of a fan-chart. A general conclusion: Based on our current London on Saturday will rise to exactly 15°C
knowledge of given historic market size data is possible but one can’t be 100% certain
Next to historical market sizes and a current as well as projections for key macro- and about that fact.
year estimate, the fan chart illustrates the socio-economic measures that were used to
probability of various outcomes for the create the forecast, we can assume that in To say the temperature on Saturday will
market value/volume over the next five 95% of the time the actual market size will be between 13°C and 17°C is a broader
years. fall within the purple shaded fan. In 5% of all statement and much more probable.
cases this model might not be correct due
At a 95% confidence interval, we are saying to random errors and the actual market size In general, we can say that based on the
that 95 out of 100 times the forecast will will fall out of these boundaries. existing statistical model, one can be 95%
certain that the temperature on Saturday
will be between 13°C and 17°C, and
respectively 50% certain it will be between
about 14.5°C and 15.5°C. Again, only in
5% of all cases this model might not be
correct due to random errors and the actual
temperature on Saturday will fall out of
these boundaries and thus will be below
13°C or above 17°C.
(To learn more about uncertainty in weather
forecasts visit: http://research.metoffice.gov.
uk/research/nwp/ensemble/uncertainty.html)
PREVIOUS © Mintel Group Ltd. All rights reserved. NEXT Disclaimer Terms and Conditions of use Any use and/or copying of this document is subject to Mintel‘s standard terms and conditions, which are available at http://www.mintel.com/legal If you have any questions regarding usage of this document please contact your account manager or call your local helpdesk. Published by Mintel Group Ltd www.mintel.com email: info@mintel.com Help desk UK +44 (0)20 7778 7155 US +1 (312) 932 0600 Australia +61 (0)2 8284 8100 Japan +81 (3) 5456 5605 China +86 (21) 6386 6609 Singapore +65 (0) 6653 3600 © 2018 Mintel Group Ltd. All rights reserved. Confidential to Mintel. PREVIOUS
You can also read