Accounting for seasonal populations in bushfire evacuation modelling and planning: A Surf Coast Shire case study - AFAC
←
→
Page content transcription
If your browser does not render page correctly, please read the page content below
Accounting for seasonal populations in bushfire
evacuation modelling and planning: A Surf Coast
Shire case study
01 July 2021
Joel Robertson1, Dhirendra Singh2 3 4, Leorey Marquez3, Vincent Lemiale3, Peter Ashton5, Trevor Dess6,
Justin Halliday7, Pawan Gamage2 , Mahesh Prakash3

1                   Introduction
The Royal Commission into National Natural Disaster Arrangements (2020) recognises the importance of
accounting for seasonal populations when planning for evacuations (Ch12). This need is well understood by
emergency management personnel in the high bushfire-risk region of Surf Coast Shire (SCS) with its
touristic Great Ocean Road. Here, during summer, the day population in the townships along the coast can
regularly swell to several fold the resident census population.
Emergency managers considering planned movement of people to a safer place (evacuation) will amongst
other things consider:
• What community is likely to be impacted by the emergency, whole or part?
• What is the current and expected threat to the community, what are the trigger points and what is the
  time to impact?
• Is there time for an evacuation to be planned/implemented?
• Is there an adequate location(s) for the community to evacuate to?
• Is there a safe route for evacuation?
For rapid on-set incidents, analysis of the inter-play between the threat (incident), agents (communities,
individuals), and the evacuation route(s) (road network) can be complex, challenging the emergency
manager’s ability to understand the context, develop options, evaluate trade-offs, and decide in a time-
constrained environment.
Over the past few years, emergency stakeholders and researchers have been working towards a data-
driven Decision Support System (DSS) to inform evacuation decisions. The workflow implemented in the
DSS captures the typical workflow of a risk fire analyst or an incident controller user. The DSS is intended as
an aid to (i) carry out a preliminary analysis of the potential impact of a predicted hazard on a road
network; (ii) design potential evacuation scenarios to be simulated; (iii) run these evacuations scenarios;

1   School of Science, RMIT University, Melbourne VIC, Australia
2   School of Computing Technologies, RMIT University, Melbourne VIC, Australia
3   CSIRO Data61, Clayton VIC, Australia
4   Corresponding author: Dhirendra Singh
5   Surf Coast Shire Council, Torquay VIC, Australia
6   Department of Environment, Land, Water and Planning, Anglesea VIC, Australia
7
    Department of Premier and Cabinet, Melbourne VIC, Australia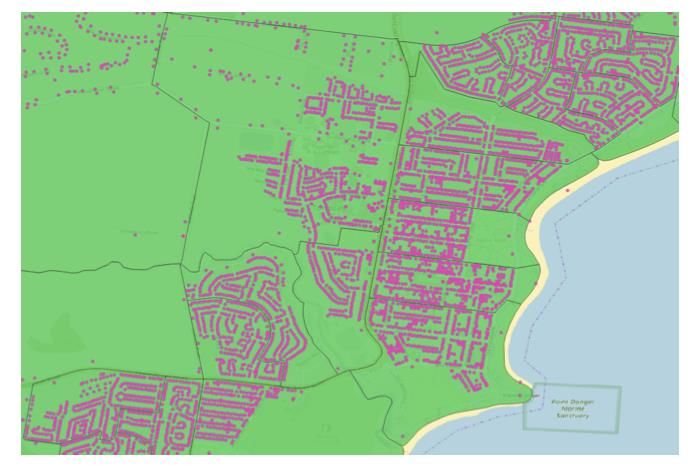
and (iv) visualize the outcome of the simulated evacuation and produce summary results to determine the
relative efficiency of the proposed emergency plans (Figure 1).

  Figure 1: Screenshots of the web interface of the DSS. The interactive frontend allows users to setup and run
  simulations, then inspect outputs relating to fire spread and population whereabouts, both spatially (GIS layers
  on a map) and temporally (over the simulated day).

The DSS uses a transport simulation software called MATSim to simulate the evacuation scenario combined
with a behavioural model called BDI (Belief-Desire-Intention) to provide the agents with a certain degree of
“intelligence” intended to capture, in an idealised way, the complexity of human behaviour in an
emergency. MATSim is a microsimulation software, meaning that the model tracks individual vehicle
movements on the road network, represented by agents in the simulation. The DSS simulates a
population’s response against a progressing fire and can give valuable insights into the efficacy of proposed
evacuation plans as well as likely traffic congestion hotspots.
Before a model can be run, a synthetic distribution of agents must be created to represent the local
population to be simulated. In locations where important seasonal population variations occur these
changes must be reflected by generating a different synthetic population appropriate for each season of
interest.
A key challenge is how to model the people, their whereabouts, what they do, and what they will do.
Typical data-driven approaches for modelling a synthetic population using census and travel survey data
are not suitable since transient populations are not sufficiently represented in such datasets. On the other
hand, local emergency personnel hold vital understanding about the expected seasonal population from
their lived experience.
In this paper, through the SCS case study, we describe a transferable process that allows expert knowledge
to easily be elicited and input into an algorithm to produce synthetic populations that are consistent with
the expert view. These populations can then be used as input into simulations to understand the potential
impact of seasonal populations on evacuation plans.
This is joint work between Emergency Management Victoria, Department of Premier and Cabinet Victoria,
SCS Council, Department of Environment, Land, Water and Planning, CSIRO's Data61, and RMIT University.

2               Seasonal populations in Surf Coast Shire (SCS)
SCS is in south-western Victoria, 1.5 hours from Melbourne’s CBD and 20 minutes south of Geelong’s CBD.
Its beaches, natural attractions, major events, and outdoor activities make it a renowned tourism region in
Victoria. The SCS is the eastern gateway to the Great Ocean Road. For this study, the daily population
within the SCS was distributed into five categories (Table 1).

Robertson et. al 2021   Accounting for seasonal populations in bushfire evacuation modelling and planning: A Surf Coast Shire case study | 1
No single data source was available that accurately quantified the daily population and their trips within
the SCS. For example, over one quarter of the visitors to the Great Ocean Road are from interstate and
international origins that are not captured by Census or VISTA data. Additionally, VISTA data, particularly
for regional areas, is based on relatively small sample sizes, suitable for understanding complex travel
interactions and for informing transport and land-use planning decisions, but insufficiently comprehensive
and detailed for evacuation planning.

Table 1: SCS daily population categories and data source relevance

Category                                                                       Census Data        VISTA Data         Industry Data
Permanent Residents                                                            Yes                Yes
Semi-permanent Residents                                                       Yes                Yes
Regular Visitor (Trades people, school drop-offs, etc.)                        No                 Yes
Day visitors                                                                   No                 Partial8           Yes
Overnight visitors                                                             No                 Partial8           Yes

3                  Population generation algorithm
To accurately represent the population’s response to an evacuation, we require a model describing where
people are when they become aware of the threat. For this, the range of activities and locations that
people move between in the context of the region should be considered. This is particularly important for
SCS, where the make-up of the population and the activities that they will be engaged in will vary
significantly depending on the season, the prevalent weather conditions, and even the day of the week.
The output of our population generation algorithm provides every individual a sequence of activities for the
day, each with its location coordinates and an end time9. The possible activities are dictated by three input
parameters: the subgroup of the population that an individual belongs to, the activity distributions
associated with that subgroup, and the locations available (per activity) to a subgroup.

3.1                Input data preparation
For the population to be generated, several area specific (SCS) inputs had to be developed. These included
building a base population for the nominated day type. The test population configuration was based on a
warm summer day, mid-week, but during the school holidays. Population was broken into five subgroups as
per Table 1. Data was gathered from within reports the Council had commissioned to understand visitation.
The permanent population was developed from the census data. Estimations were made for Regular
visitors, with some input from VISTA transport data. Using these inputs, activity distribution patterns across
the day, for the population subgroups, were constructed as simple tables (Figure 2).

8Over one quarter of visitors to the Great Ocean Road are from Interstate and international locations (Great Ocean Road Regional Tourism Strategic
Business Plan 2019-2022) that are not accounted for in either Census or VISTA data.
9
    This follows the population.xml input format that the MATSim simulation requires.

Robertson et. al 2021           Accounting for seasonal populations in bushfire evacuation modelling and planning: A Surf Coast Shire case study | 2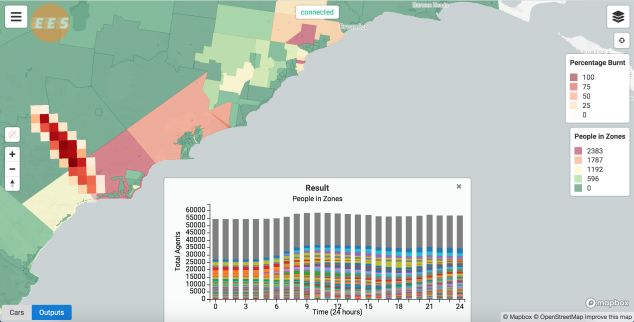
Figure 2: Example activity distribution tables (shown visually) for two different subgroups describing
residents and daytime visitors in SCS. Note that visitors do not have any work activity allocation in the
region. As well, home locations for visitors are assigned to locations outside the region, capturing daily influx
of visitors from major centers such as Geelong and Melbourne.
Location data was developed to match each of the activities derived as part of the algorithm. This
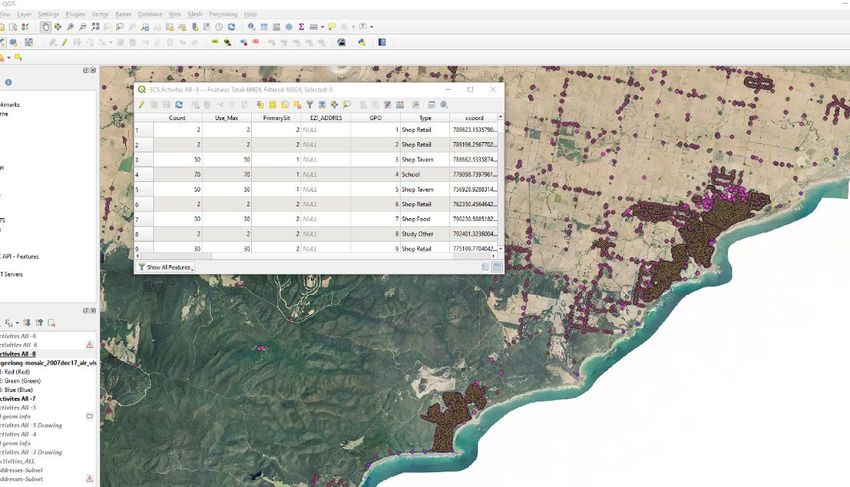
development was facilitated using QGIS software (Figure 3). Home locations were allocated from the State
address point database10. Recreation sites such as beaches were inputted manually as points, and other
recreation and work sites were derived and simplified from available internal shire spatial data11.
Figure 3: Development of the locations databased was facilitated by QGIS software and supplied by SCS Council.
3.2 Subgroups
The total population in the region is made up of a mixture of residents and visitors. On summer days,
tourist and short-term visitor numbers are typically much larger than the permanent population in
townships along the SCS coastline. Visitors have different activity priorities to locals and are less
knowledgeable about the region, both in terms of activity destinations and routes to them. Therefore,
visitors tend to be concentrated in certain areas.
Five distinct population subgroups were identified for the SCS:
10 https://discover.data.vic.gov.au/dataset/address-vicmap-address
11
Not publicly available
Robertson et. al 2021 Accounting for seasonal populations in bushfire evacuation modelling and planning: A Surf Coast Shire case study | 3• Residents: those who live in the region, have local knowledge of roads and places of congregation. They are connected closely with other people and businesses in the community. • Part-time residents: those who own property in the region but may only live there for several months of the year. Are familiar with the area, but do not have a large community network. • Regular visitors: those who have visited the region on several occasions and may have a holiday home there. Will know the area but are unlikely to have relatives or friends in the community. • Overnight visitors: those who are unfamiliar with the area and living in short term accommodation. Activities will tend to be more focused on specific visitor destinations. • Daytime visitors: those who are mostly unfamiliar with local roads and places of congregation. Activities will tend to be more focused on specific visitor destinations. 3.3 Activity assignment It is difficult to capture the full range of activities that people will engage in during a day, and invariably any model will be a simplification of these choices and behaviours. From an operational standpoint, it is useful to keep the set of possible activities broad and consistent across all subgroups and limit options to those most likely to influence the movement of people under the given scenario. For the SCS, activities were chosen to be home, work, shops, beach and other. Users of the tool then provided input activity patterns for every subgroup in tables describing the expected proportion of each subgroup engaging in each activity in 2-hour blocks of the day (Figure 2). Note that these input activity distributions do not explicitly describe when individuals should start (or end) an activity. The algorithm recursively converts the proportions at each interval into cumulative start-time probabilities using an expected duration for each activity. Iterating through the intervals for each individual, a sequence of activities is drawn randomly from these cumulative start-times, and each interval represents a decision point where an individual can change activities or continue in their current activity during that 2- hour window. Over the subgroup population these decisions should see the proportion of that subgroup engaged in each activity collapse back into the expected proportions provided in the input distributions. Figure 4 compares the derived distributions from the generated algorithm to the desired distributions of Figure 2. A higher error is evident for the long-duration work activity that is overrepresented (resulting in associated underrepresentation elsewhere) because perfect scheduling to achieve the desired distribution is not always mathematically possible. Across other activities that are much smaller in duration and easier to schedule, the achieved distributions are typically within 1% of those desired. Figure 4: Accuracy of the generated population against the desired distributions of Figure 2. Robertson et. al 2021 Accounting for seasonal populations in bushfire evacuation modelling and planning: A Surf Coast Shire case study | 4
3.4 Location assignment
Once an activity sequence is established, the locations where they will occur need to be determined. An
additional constraint on activity assignment is that every individual’s sequence begins and ends at their
home location12. Importantly, the user can assign each subgroup separate location sets associated with the
activities. This means that whilst home for a resident would come from the set of residential addresses in
the region, a visitor’s home can be assigned to caravan parks, hotels, and holiday rental locations. As
another example, the beach activity can be manipulated so that visitors will attend popular spots whilst
locals have a wider range of options. The other activity provides flexibility for the user here, allowing
scenario specific locations to be included at each subgroup level.
Figure 5: Localities within the region define the likelihood of an eligible location being chosen for an activity.
Locations (pink points) are partitioned into localities (green polygons). Within the locality of the current activity,
eligible locations for the next activity are weighted purely based on their expected allocation. Moving into another
locality occurs with probability inverse to the distance between locality centroids and is also weighted by the travel
factor for that individual’s subgroup.
Beginning at the home co-ordinates, the location of the next activity in the sequence is decided using a
locality-based metric ( Figure 5). This factors in the propensity for each subgroup to travel outside of their
current locality and allows for suboptimal intra-locality trips that a purely distance-based metric would
ignore. An additional parameter that governs location selection is an allocation provided for each location
which reflects both the capacity and expected popularity of the location. This is particularly useful if
hotspots (such as a festival site or a particularly popular beach) are required under the given scenario.
3.5 Synthetic population generation for evacuation planning
Using the SCS data prepared by users (Section 3.1) we ran the population synthesis algorithm to generate
an example population for a typical mid-week day in January. In this scenario the total population of the
region was made up of ~17k residents, ~11k part-time residents, 5k regular visitors, ~21k overnight visitors
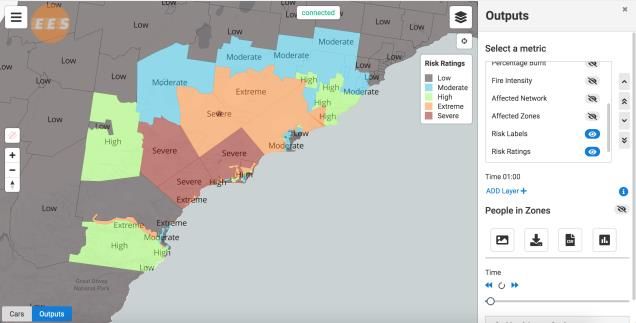
and ~5k daytime visitors. Figure 6 shows a snapshot of the generated population at 11am in the MATSim
traffic simulator. Different colours represent the different activities that are taking place in the region with
12
This is a requirement for the underlying traffic simulator MATSim that is used for simulation.
Robertson et. al 2021 Accounting for seasonal populations in bushfire evacuation modelling and planning: A Surf Coast Shire case study | 5moving vehicles shown as triangles and stationary ones as circles. The intensity of activity along the Great Ocean Road and its coastal townships is clearly visible. Figure 6: Visualisation of the generated synthetic population for SCS for a typical mid-week day in January. The algorithm produces a daily travel plan for every individual in the population, that taken together conform to the input distributions (Figure 2). Through the testing phase in SCS, several improvements are being considered. These include (i) increasing the number of activities; (ii) including a new subgroup for through traffic; (iii) nominating a breakdown by subgroup, and by activities, for each locality. It is believed that these improvements will give users a higher level of flexibility to manipulate populations when testing different scenarios and matching actual traffic movements. As well traffic count data from Department of Transport and SCS will be used to validate the accuracy of the generated synthetic population. In the DSS, a simulated fire (Phoenix Rapidfire output) can be introduced in this scenario at any ignition point in the landscape at any time of the day. As the simulated fire front progresses, the population will start to become aware of the threat, and agents will (using the intelligent BDI reasoning engine) begin to diverge from their planned activities by considering the dynamically unfolding situation and their individual circumstance. 4 Related Works The literature has identified five general approaches to creating synthetic populations for activity-based and agent-based simulations, and for years Iterative Proportional Fitting (IPF) has been the standard against which all other methods are compared (Ramadan and Sisiopiku, 2019). First introduced by Deming and Stephan (1940), IPF is an iterative process used to fit joint distribution cells in an n-dimensional contingency table when the marginal totals are known. Beckman et al. (1996) was the first to use IPF for disaggregated travel demand modelling with their development of a methodology for creating a synthetic baseline population of individuals and households for microscopic activity-based Robertson et. al 2021 Accounting for seasonal populations in bushfire evacuation modelling and planning: A Surf Coast Shire case study | 6
models. Guo and Bhat (2007) addressed the two main drawbacks of IPF approach, namely, the zero-cell
problem and the inability to control for statistical distributions of both household- and individual-level
attributes, by proposing a generic algorithm for merging any two contingency tables with common
variables.
The Iterative Proportional Updating (IPU) approach (Ye et al., 2009) was also developed to address the
drawbacks of the IPF approach. The IPU algorithm re-weights households in a microdata sample using
separate population weights for persons and households until both household- and individual-level
attributes are matched (Fournier et al, 2021).
On the other hand, the Combinatorial Optimization (CO) approach (Openshaw and Rao 1995; Voas and
Williamson 2000; Abraham et al. 2012) treats population synthesis as an optimization problem, where the
number of representatives in the joint sample is optimized to match the marginal totals. While CO is
generally simpler and more direct than IPF, it can set unrealistic weights (e.g., zero) resulting in over-fitting
or loss of heterogeneity (Pritchard and Miller 2012).
Where IPF, IPU, and CO rely on cloning the population to reproduce attributes captured in the microdata,
Markov Chain Monte Carlo (MCMC) offers an approach that truly synthesizes populations instead of cloning
them. If a true population exists in a given spatial region at any point in time, the MCMC approach can
synthesize that population by sampling the individual attributes from their joint distribution using the
available partial views while ensuring that the empirical distribution in the synthetic population is as close
as possible to the actual distribution (Ramadan and Sisiopiku, 2019). The first notable application of MCMC
was reported by Farooq et al. (2013) who used a Gibbs sampler to draw from the Swiss census data and
obtained a synthetic population that outperformed that obtained using the conventional IPF approach.
Other emerging methods have been proposed to replace the IPF approach or to overcome one or more of
its drawbacks. These emerging approaches include Bayesian network (Sun and Erath, 2015), machine
learning techniques (Borysov et al., 2019), simulated annealing (Kim and Lee, 2015), linear programming
(Vovsha et al., 2015), copula-based methods (Kao et al., 2018), and entropy maximization approaches (Paul
et al., 2018).

5                Discussion and Conclusion
Bushfire prone areas around the world seldom have common characteristics. They have significant
transient and seasonal populations, commonly tourists. Prime examples are the Great Ocean Road in
Australia and the Californian coastline in the US. An evacuation modelling approach for these regions needs
to be scalable and repeatable despite the prevalence of such a transient population. Developing data-
driven approaches to evacuation as presented here, and better quantifying a community’s ability to
evacuate in the event of a hazard, especially bushfires, has been identified as a key national priority in
various recent relevant publications.13 14 15 Understanding and quantifying evacuation and the ability to
evacuate are important for planning (adaptation), preparedness (risk mitigation) and response during an

13Office of the Chief Scientist Australia report Bushfire Research and Technology: Mapping Australia's Capability (June 2020, Pg. 37).
https://www.chiefscientist.gov.au/sites/default/files/2020-08/Office of Chief Scientist Bushfire Research and Technology Capability Map June
2020.pdf
14CSIRO Report on Climate and Disaster Resilience (Jul 2020, Pg. 184). https://www.csiro.au/en/Research/Environment/Extreme-
Events/Bushfire/frontline-support/report-climate-disaste-resilience
15Royal Commission into National Natural Disaster Arrangements (Ch. 12). https://naturaldisaster.royalcommission.gov.au/publications/html-
report/table-of-contents.

Robertson et. al 2021         Accounting for seasonal populations in bushfire evacuation modelling and planning: A Surf Coast Shire case study | 7
event. It also has a direct relevance to estimating the resilience of populations. The approach that has been
developed here could also be relatively easily translated to other relevant hazards such as floods and
potentially storms.
The DSS project represents a collaboration between state and local government, CSIRO’s DATA 61 and
RMIT University. Within the Victorian State Government, the project involves the Department of Land,
Water and Planning, the Department of Justice and Community Safety’s Emergency Management Victoria,
and the Department of Premier and Cabinet. These state government representatives provide funding for
the development of the DSS and champion the project within government, and guide alignment of the
project with emergency and environmental management activities. The DSS project also involves
representatives from local government, including SCS and Mount Alexander Shire. They represent the DSS’s
end users-- fire risk analysts, incident controllers, and Council emergency management staff--and provide
crucial on-the-ground expertise. Their guidance ensures the DSS simulates realistic expected behaviours
during bushfire evacuations and generates outputs that help plan and prepare for such emergencies. The
work of developing the DSS’s underlying technology falls to the research bodies, being CSIRO’s Data61 and
RMIT University. Research staff contribute specialist knowledge and capability, such as simulating agent
behaviours, generating synthetic populations, developing behavioural archetypes, and combining these
into a usable and useful product. Together, the organisations determine the DSS’s overall design direction
and development roadmap.
The evacuation modelling project stakeholders recognise that development of successful software products
is not just about the calculations and the simulation. It is essential that the software interface, language,
and presentation makes sense to end users and generates outputs that directly assist them in building safer
communities.

References
Abraham, J.E., Stefan, K.J., Hunt, J.D. (2012) Population synthesis using combinatorial optimization at
     multiple levels. In: Papers Presented at the 91st Annual Meeting of Transportation Research Board,
     Washington DC (2012). https://trid.trb.org/view/1130260
Beckman RJ, Baggerly KA, McKay MD (1996). Creating synthetic baseline populations. Transportation
     Research Part A: Policy and Practice. 30(6):415-429
Borysov, S.S., Rich, J., Pereira, F.C. (2019) How to generate micro-agents? A deep generative modeling
      approach to population synthesis. Transport Research Part C Emerging Technologies 106, 73–97.
Deming WE, Stephan FF (1940) On a least squares adjustment of a sampled frequency table when the
     expected marginal totals are known. The Annals of Mathematical Statistics. 1940;11(4):427-444
Farooq B, Bierlaire M, Hurtubia R, Flötteröd G. (2013) Simulation based population synthesis.
     Transportation Research Part B: Methodological. 58:243-263
Fournier, N., Christofa, E., Akkinepally, A.P. Azevedo, C. (2021) Integrated population synthesis and
      workplace assignment using an efficient optimization-based person-household matching method.
      Transportation 48, 1061–1087. https://doi.org/10.1007/s11116-020-10090-3
Guo JY, Bhat CR. (2007) Population synthesis for microsimulating travel behavior. Transportation Research
      Record 2014:92-101
Kao S-C, Kim HK, Liu C, Cui X, Bhaduri BL. (2018) Dependence-preserving approach to synthesizing
      household characteristics. Transportation Research Record. 2302:192-200.

Robertson et. al 2021   Accounting for seasonal populations in bushfire evacuation modelling and planning: A Surf Coast Shire case study | 8
Kim J, Lee S. (2015) A simulated annealing algorithm for the creation of synthetic population in activity-
based travel demand model. KSCE Journal of Civil Engineering. 20(6):2513-2523.
Openshaw, S., Rao, L.(1995) Algorithms for reengineering 1991 Census geography. Environ. Plan. A 27(3),
425–446.
Paul BM, Doyle J, Stabler B, Freedman J, Bettinardi A, editors (2018). Multi-level population synthesis using
entropy maximization-based simultaneous list balancing. In: Transportation Research Board 97th
Annual Meeting. Washington, DC: Transportation Research Board.
Pritchard, D.R., Miller, E.J. (2012) Advances in population synthesis: fitting many attributes per agent and
fitting to household and person margins simultaneously. Transportation 39(3), 685–704.
Ramadan, O. and Sisiopiku, V. (2019). A Critical Review on Population Synthesis for Activity- and Agent-
Based Transportation Models, Transportation Systems Analysis and Assessment, Stefano De Luca,
Roberta Di Pace and Boban Djordjevic, IntechOpen, May 16th, 2019. DOI:
10.5772/intechopen.86307.
Sun L, Erath A. (2015) A Bayesian network approach for population synthesis. Transportation Research Part
C: Emerging Technologies. 61:49-62
Voas, D., Williamson, P. (2000) An evaluation of the combinatorial optimisation approach to the creation of
synthetic microdata. International Journal of Population Geography, 6(5),
6(5), 349–366.
Vovsha P, Hicks JE, Paul BM, Livshits V, Maneva P, Jeon K, editors. (2015). New features of population
synthesis. In: Transportation Research Board 94th Annual Meeting. Washington, DC; 2015
Ye X, Konduri KC, Pendyala RM, Sana B, Waddell P, editors (2009). Methodology to match distributions of
both household and person attributes in generation of synthetic populations. In: Transportation
Research Board 88th Annual Meeting. Washington, DC: Transportation Research Board.
Robertson et. al 2021 Accounting for seasonal populations in bushfire evacuation modelling and planning: A Surf Coast Shire case study | 9You can also read