UShaka Sea World Education Grade 11 Life Sciences - Populations Study researchgate.net - SAAMBR
←
→
Page content transcription
If your browser does not render page correctly, please read the page content below
uShaka Sea World Education
Grade 11
Life Sciences

                    researchgate.net

     Populations Study

                                       1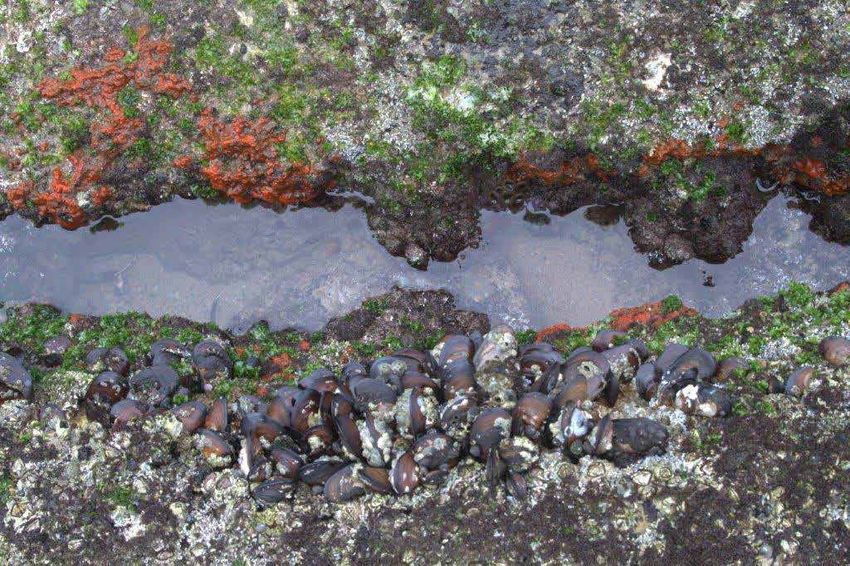
Populations Study
In this study you will be looking at the population of mussels found at the Umhlanga/
Umdloti mussel beds. Your study will deal with the following:
•      Determining the size of population by quadrat sampling.
•      Do a simulated mark/recapture exercise.
•      Record and Interpret your data.
•      Calculate/estimate population size and make inferences from your results.

Curriculum link
GRADE 11 STRAND 3: ENVIRONMENTAL STUDIES

Population Ecology

Organisms interact with other organisms and with the environments in which they
live. Learners are encouraged to look for, and suggest solutions to local environmen-
tal problems.  The intention is that the behaviour of the learners will be modified to
become more sensitive to environmental issues.

Population size
- Immigration, emigration, mortality, births, fluctuations.
- Limiting factors, carrying capacity.

Interactions in the Environment
- Competition and Predation
- Interspecific: for light, space, water, shelter, food.
- Intraspecific: for food, access to mates, water, space, shelter. Survival determined by
  access to the above ecological niches.
- Specialisation; Competitive exclusion and resource partitioning; One example of
  co-existence in animals.
- Parasitism, Mutualism, Commensalism.

                                                                                            2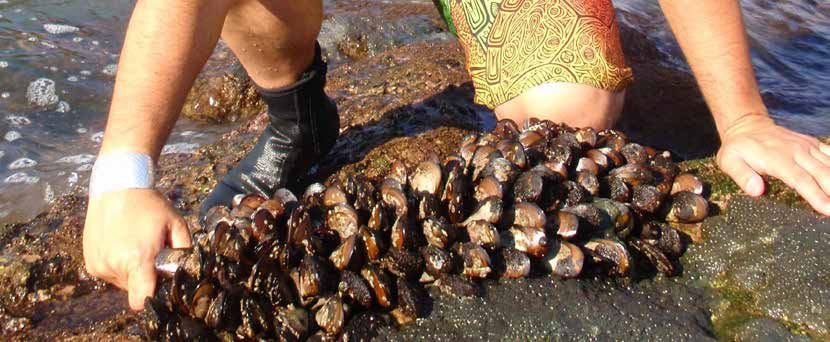
READING

   What are mussels?

   The word “mussel” is frequently used to mean the bivalves of the marine
   family Mytilidae, most of which live on exposed shores in the intertidal
   zone, attached by means of their strong byssal threads (“beard”) to a firm
   substrate. In most marine mussels the shell is longer than it is wide, being
   wedge-shaped or asymmetrical. The external colour of the shell is often
   dark blue, blackish, or brown, while the interior is silvery. The mussel’s

                                                                                                                      m
   external shell is composed of two hinged halves or “valves”. The valves are                                      al

                                                                                                                   .co
   joined together on the outside by a ligament and are closed when necessary                                    ent
                                                                                                               cd
   by strong internal muscles (anterior and posterior adductor muscles). Mussel                           prote
   shells carry out a variety of functions, including support for soft tissues, protection
   from predators and protection against desiccation (drying out). Like most bivalves, mussels have an organ
   called a foot. In marine mussels, the foot is tongue-like in shape, with a groove on the ventral surface which
   is continuous with the byssus pit. In this pit, a viscous secretion is exuded, entering the groove and hardening
   gradually upon contact with sea water. This forms extremely tough, strong, elastic, byssal threads that secure
   the mussel to its substrate allowing it to remain sessile in areas of high wave action. The byssal thread is also
   sometimes used by mussels as a defensive measure, to tether predatory molluscs, such as dog whelks, that
   invade mussel beds, immobilising them and thus starving them to death.

   Feeding
  Mussels are filter feeders and they feed on plankton and other
  microscopic sea creatures which are free-floating in seawater. A mussel
  draws water   into the branchial chamber by the actions of the cilia
  located on the gills. The waste-water is removed using an exhalant
  water current. The particles are carried along the bottom of the gill to
  the palps and the palps finally funnel the food into the mouth, where
  digestion begins.

  Marine mussels are usually found clumping together on wave-washed
  rocks, each attached to the rock by its byssus. The clumping habit helps
  hold the mussels firm against the force of the waves. At low tide mussels
  in the middle of a clump will undergo less water loss because of water
  capture by the other mussels.
                                                                                 Researchgate.net

                                                                                                               3
theguardian.com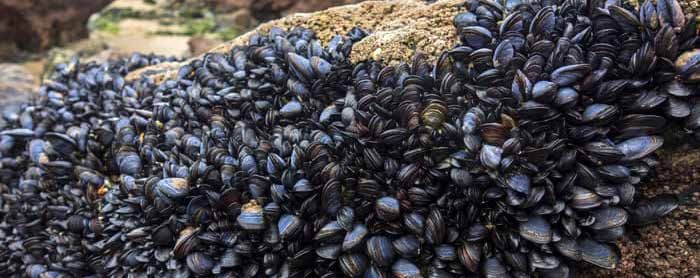
Reproduction
Mussels are gonochoristic, with separate male and female individuals. In marine mussels, fertilization occurs
outside the body, with a larval stage that drifts for three weeks to six months, before settling on a hard
surface as a young mussel. There, it is capable of moving slowly by means of attaching and detaching byssal
threads to attain a better life position. Larval mussels usually settle within an existing mussel bed where
without the hard sheltered structure they will not survive.
Freshwater mussels
reproduce sexually.
Sperm is released by
the male directly
into the water and
enters the female
via the incurrent
molluskconservation.org
siphon. After
m
fertilization, the eggs nature.co
develop into a larval stage
called a glochidium (plural glochidia), which
temporarily parasitizes fish, attaching themselves
to the fish’s fins or gills. Prior to their release,
the glochidia grow in the gills of the female
mussel where they are constantly flushed with
oxygen-rich water. In some species, release occurs
when a fish attempts to attack the mussel’s minnow or other mantle flaps shaped like prey, an example of
aggressive mimicry. Glochidia are generally species-specific and will only live if they find the correct fish
host. Once the larval mussels attach to the fish, the fish body reacts to cover them with cells forming a cyst,
where the glochidia remain for two to five weeks (depending on temperature). They grow, break free from
the host, and drop to the bottom of the water to begin
an independent life.
Predators
Marine mussels are eaten by humans, starfish,
seabirds, and by numerous species of predatory
marine gastropods and fish such as the dog whelk
and black musselcracker.
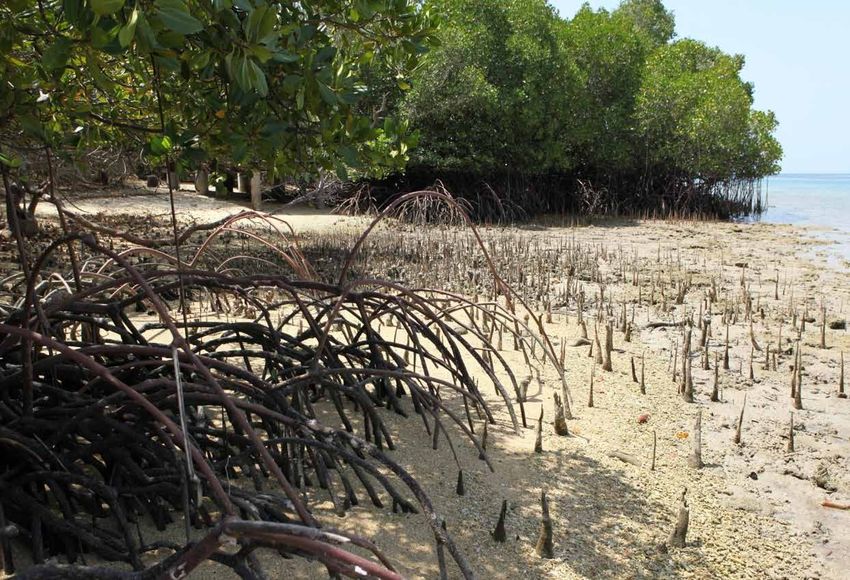
Distribution and habitat
Marine mussels are abundant in the low and mid intertidal zone in temperate seas globally.
Other species of marine mussel live in tropical intertidal areas, but not in the same huge numbers as in
temperate zones. Certain species of marine mussels prefer salt marshes or quiet bays, while others thrive in
pounding surf, completely covering wave-washed rocks. Some species have colonized abyssal depths near
hydrothermal vents. The South African white mussel Donax serra exceptionally does not bind itself to rocks
but burrows into sandy beaches extending two tubes above the sand surface for the ingestion of food and
water and exhausting wastes, while the brown mussel Perna perna attaches itself onto the rocks in the
intertidal zone.
Barnacles are also found on the rocky shores and often attach themselves onto the shells of mussels. The
barnacles on shells of living mussels are shown to grow significantly faster than those on empty mussel shells,
4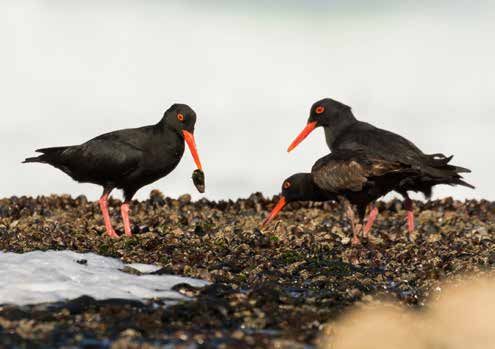
however the presence of barnacles has no effect on the growth of mussels. The two-species association is a
demonstration of commensalism.

Subtidal mussel beds offer protection to grazers, particularly juvenile sea urchins. These small urchins and
the larger adults forage on top of the mussel beds keeping the mussel beds clear of macroalgae. Although
mussels and urchins can exist without each other, this interaction can be considered a ‘facultative mutualism’
whereby the mussels offer the juvenile urchins refuge from predation and the urchins enhance the survival
probability of the mussels by preventing excessive algal growth on the mussel shells which would inhibit
feeding ability.

Mussel beds therefore affect a community structure in a number of ways. Firstly, they increase physical
structure and provide numerous microhabitat types which can support species adapted to those conditions.
Secondly, they provide refugia from predation and physical stress, favouring mobile species which can find
prey within or adjacent to the beds. Thirdly, because mussel beds are subject to exfoliation during storms,
their particular biology and mode of attachment provides for a successional cycle in the mid-intertidal zone
whereby patches are cleared, occupied by algae, barnacles and other groups for several years, then gradually
develop into full mussel beds again.

Invasive mussel
In South Africa the Mediterranean mussel (Mytilus galloprovincialus) is
found occupying the mid to high rocky shore. This large, smooth-shelled
black to blue mussel typically grows to 50 mm but can reach up to 120
mm long. The two shells are equal in size and nearly quadrangular (four-
sided) in shape. In South Africa it is now abundantly distributed along
the entire west coast, while on the south coast they form mixed beds
with the indigenous Brown mussel (Perna perna). One of the challenges
with this invasive mussel is that it forms dense, multi-layered beds that knysnabasinproject.co.za
dominate the intertidal rocks. They displace indigenous mussels, large limpets and other species, creating a
monoculture along the intertidal zone.  In South Africa, the whelk Nucella cingulata has become a predator
of the Mediterranean mussel. As such, these whelks have been found to increase in density where these
mussels have established populations. Also, in South Africa, the endangered African Black Oystercatcher has
been observed to switch from feeding on indigenous mussels to the invasive Mediterranean mussel. This is
potentially due to the invasive mussel having taken over the habitat typically used by the indigenous mussels,
or because they grow larger in size and provide more energy per individual. As a result, it has been reported
that these birds’ reproductive potential has increased following the Mediterranean mussel establishment.

Environmental applications
Mussels are widely used as bio-indicators to monitor the health of aquatic environments in both fresh water
and the marine environments. They are particularly useful since they are distributed world-wide and they
are sessile. These characteristics ensure that they are representative of the environment where they are
sampled or placed. Their population status or structure, physiology, behaviour or the level of contamination
with elements or compounds can indicate the status of the ecosystem. For example, mussels can be sampled
for heavy metal concentrations to determine the pollution levels within a particular area. As the mussels are
             filter feeders all sorts of things are absorbed during feeding.

             Mussels filtering water         https://www.youtube.com/watch?v=iOc0AuHAtDM

References     : https://en.wikipedia.org/wiki/Mussel accessed on the 17 June 2020 at 11:20
               : https://www.sanbi.org/animal-of-the-week/mediterranean-mussel/ accessed on
                 the 23 June 2020 at 15h22
               : S.S. Bell, Earl D. McCoy, H.R. Mushinsky . 2012. Habitat Structure: The physical
                 arrangement of objects in space.
                                                                                                        5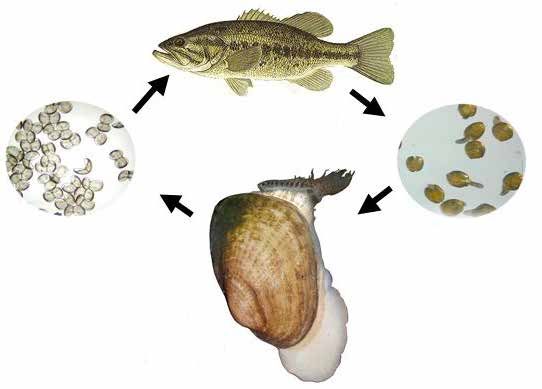
?   QUESTIONS

    1. With which species does the mussel have a mutualistic relationship? Describe how.

    _______________________________________________________________________________________

    _______________________________________________________________________________________

    _______________________________________________________________________________________

    _______________________________________________________________________________________

    _______________________________________________________________________________________

    2. Fresh water mussels have a stage in their life cycle that is parasitic. Which stage of the life cycle is this,
        and who is their host?

    _______________________________________________________________________________________

    _______________________________________________________________________________________

    _______________________________________________________________________________________

    3. With which species does the mussel have a commensal relationship ? Explain the dynamics of the
        relationship.

    _______________________________________________________________________________________

    _______________________________________________________________________________________

    _______________________________________________________________________________________

    _______________________________________________________________________________________

    _______________________________________________________________________________________

    4. Name three predators of mussels.

    _______________________________________________________________________________________

    5. Mussels have developed a defense mechanism with one of their predators. Which predator is it? How do
        the mussels defend themselves against this predator?

    _______________________________________________________________________________________

    _______________________________________________________________________________________

    _______________________________________________________________________________________

    _______________________________________________________________________________________

                                                                                                                                                             6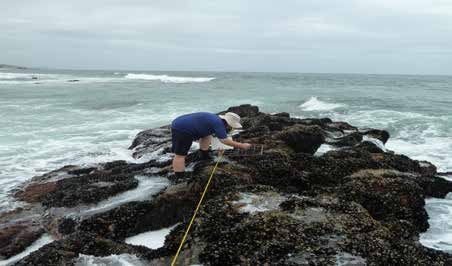
6. With which species do mussels co-exist ?

_______________________________________________________________________________________

7. Name one factor that a species of mussels have to compete for with each other (Intraspecific competition)
    and one factor that they have to compete for with other species (Interspecific competition)?

_______________________________________________________________________________________

_______________________________________________________________________________________

_______________________________________________________________________________________

_______________________________________________________________________________________

8. Which mussel is the cause of competitive exclusion for the brown mussel? What negative and positive
    effect does this have on the surrounding environment?

_______________________________________________________________________________________

_______________________________________________________________________________________

_______________________________________________________________________________________

_______________________________________________________________________________________

_______________________________________________________________________________________

______________________________________________________________________________________

9. Why can mussels be used as bio-indicators in the natural environment?

_______________________________________________________________________________________

_______________________________________________________________________________________

_______________________________________________________________________________________

                                                                                                                7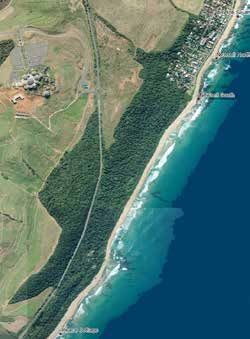
READING

CASE STUDY: Based on the Long-term monitoring of Umhlanga / Umdloti
mussel beds by the Oceanographic Research Institute (ORI) at SAAMBR.
Data and Information on mussels provided by Erika Steyn

Mussel populations in the Umdloti / Umhlanga region were subjected to intense recreational harvesting in
the 1990s and became severely depleted. Due to concerns of Umdloti residents, reefs at Selection Beach,
the southernmost beach at Umdloti, were closed to mussel collection in 1998. A number of fishers have
recently questioned the necessity of this ban on mussel harvesting and the Oceanographic Research Institute
(ORI) was commissioned by the eThekwini Metro’s Natural Resources Department to assess the effectiveness
of the Umdloti mussel management area. As part of this study,  ORI had been monitoring mussel beds at
Umdloti (Newsell North) and one mussel bed at Umhlanga (Peace Cottage) since 1993. Mussel density, size
and recruitment data obtained from this long-term monitoring study were used to investigate the effect of
the mussel harvesting ban at Umdloti. Voluntary catch returns by permit holders as well as mail, telephone
and internet surveys conducted by  ORI were analysed to investigate the long-term effects of recreational
mussel collecting at Umdloti and Peace Cottage. Numerous factors such as storms and mussel recruitment
can explain variability observed during the study in mussel density and mean size, but recreational harvesting
clearly had the greatest impact on the mussel community structure. The Peace Cottage monitoring site,
north of the Umhlanga Lagoon, is remote and was subject to low levels of recreational mussel collection in
the 1990s, however a sanding event in 1996, followed by high levels of mussel collection, virtually depleted
the mussel bed. Continued harvesting, although at a lower intensity, has slowed the recovery of this site.
Both sites experienced another sanding event in May 2013 affecting all the reefs’ population numbers.
In contrast, Umdloti was a popular mussel collection area in the 1990s. Newsell North was close to a public
parking area and was heavily harvested. Intense harvesting in the 1990s caused a severe reduction in the
mussel density at Umdloti Newsell North. The reef was closed on a voluntary basis to mussel collection
in 1995 and 1997. Mussel catches and harvesting effort at Umdloti were then significantly reduced after
the official closure in 1998. There was an immediate reduction of >70% in recreational mussel collection at
Umdloti, followed by further reductions in mussel catches and harvesting effort.
It is very likely that the Umdloti mussel beds would have disappeared had these reefs not been closed to
harvesting in 1998. The continued
closure of this reef to mussel collection
is thus recommended.
These are the only protected intertidal
reefs on the Kwa-Zulu Natal north coast
outside of the iSimangaliso Wetland Park
and thus function as important nursery
reefs that can replenish exploited
mussel beds. These mussel beds also
comprise an important reference site
that have yielded a long-term data set
which can be used to determine the
status of exploited mussel beds and,
possibly, the effects of climate change
on KwaZulu-Natal mussel beds and
mussel harvesting.

                                                                                                                 8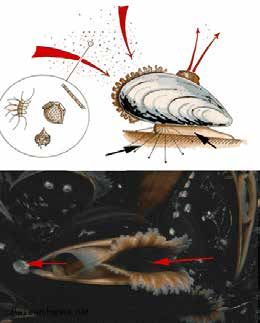
Data Collection

The Study sites

The position of the two study reefs is shown in Figure 1. Umdloti
Newsell North is located on intertidal rocky reefs and is very flat.
Parking is limited close to the southern beaches of Umdloti.
Historically, the Newsell North site was subject to high recreational
mussel harvesting and is now within the designated mussel
management area .
Peace Cottage is a small, extremely flat reef north of Umhlanga
Lagoon and approximately 2.4km south of the Umdloti sites. This
area is remote with no safe parking, apart from the Natal Estate
Angling Club which has parking for its members at its clubhouse
close to this site. This site has been subject to low recreational
harvesting in the past.

                                                                         Long-term mussel monitoring

                                                                         Monitoring began at the two
                                                                         mussel sites in 1993 as part
                                                                         of a collaborative project to
                                                                         investigate mussel recruitment
                                                                         along the entire South African
                                                                         coastline. A fixed 20m transect
                                                                         was established at each site,
                                                                         horizontal to the shoreline,
                                                                         within the middle of the
                                                                         mussel bed to monitor the
                                                                         percentage of mussel cover.
                                                                         The two ends of each transect
                                                                         was demarcated by markers
                                                                         and a weighted 20m rope
                                                                         was laid between the markers
                                                                         when collecting data. Starting
                                                                         at the southern end of the
                                                                         transect, mussel cover in a 50
cm x 50 cm quadrat (0.25m2 ) was estimated at one metre intervals on the seaward side of the transect
line; mussel cover was thus estimated in 20 quadrats at each site. Percentage cover is not an adequate
measure of mussel density as the number of mussels covering an area depends on their size, and a mussel
bed is layered, with small mussels attached to the shells of larger mussels. Three mussel samples were
thus collected on each sampling occasion at each site to estimate mussel mean size and mussel density.
All mussels were removed and measured in three 15 x 15cm quadrats placed randomly on dense adult
mussel patches within 1 metre of the seaward side of the horizontal transect.

                                                                                                   9
?    QUESTIONS
    Data Sets - Average % cover and sample 1-3 within each area for each site visit

    Sample / AREA Site visit 1                          Site visit 2              Site visit 3              Site visit 4
    			 March 2013		                                    September 2013		          May 2014		                September 2014

    Average % cover                   51,4                       28,8                      22,4                                      16,7
    1       NEWSELLN                      92                     237                           62                                    233
    2       NEWSELLN                    118                      152                           48                                    481
    3       NEWSELLN                    122                      195                         112                                       56

    Average % cover                   78,6                       70,8                      68,4                                     68,8
    1       PEACES                        72                        65                       110                                       91
    2       PEACES                      101                       123                          93                                    115
    3       PEACES                        90                         61                        77                                    101

    1. Assessing the mussel populations in each area for each site visit

    You are going to use some of the data from the study above to work out an estimation of the population
    size of mussels within two different areas.

    You need to estimate their population via the Quadrat method and then compare the numbers of the two
    sites and make inferences by answering the questions.

    Remember
    Population size is the number of individuals in the population of a species. In natural communities,
    population size may vary, but remains overall constant.
    Population size can be measured either by Direct or Indirect methods. A Direct method is like a
    census, where each individual is counted. An indirect method is through sampling, where only a
    selection of the population is counted. You will be working with the indirect method as it is virtually
    impossible to count every single mussel.

    THE QUADRAT METHOD

    This method is used for sessile animals and uses the following formula:

     Estimate population = AVERAGE Total number of individuals COUNTED in the quadrat x total area of the sample site

                                              Total area of the quadrat

    METHOD:
    •     Work out the size of the whole habitat (note that you will be using the area of the estimate mussel
          mean size and mussel density, not the mussel % cover)
    •     Work out the size of the quadrat (note that you will be using the quadrat size of the estimate mussel
          mean size and mussel density, not the mussel % cover)
    •     Count the individuals in three quadrats (provided in the table)
    •     Calculate the average number of individuals per quadrat (This is the number in the sample)
    •     Use the above formula to calculate the size of the particular population (N)
    •     Repeat for each site visit

    Remember these precautions would have been taken for reliable results:
    The size, area and shape of the quadrats must be known
    The quadrats must be randomly selected
    The exact number of organisms found in each quadrat must be counted.

                                                                                                                                            10
QUADRAT FORMULA SHEET FOR PEACES
AREA OF THE SAMPLE SITE = LENGTH _____________X BREADTH ____________ = ____________ m2
AREA OF THE QUADRAT = LENGTH ____________ X BREADTH ____________ = ____________ m2
*Remember to convert from cm to m
Site Visit 1:
(a) __________
Using the formula, calculate the
(b) __________ estimated population size for site
visit 1.
(c) __________ __________
Average = _____________
Site Visit 2:
(d) __________
Using the formula, calculate the
(e) __________ estimated population size for site
visit 2.
(f) __________ __________
Average = _____________
Site Visit 3:
(g) __________
Using the formula, calculate the
(h) __________ estimated population size for site
visit 3.
(i) __________ __________
Average = _____________
Site Visit 4:
(j) __________
Using the formula, calculate the
(k) __________ estimated population size for site
visit 4.
(l) __________ __________
Average = _____________
Estimate population = AVERAGE Total number of individuals COUNTED in the quadrat x total area of the sample site
Total area of the quadrat
11QUADRAT FORMULA SHEET FOR NEWSELLN
AREA OF THE SAMPLE SITE = LENGTH _____________X BREADTH ____________ = ____________ m2
AREA OF THE QUADRAT = LENGTH ____________ X BREADTH ____________ = ____________ m2
*Remember to convert from cm to m
Site Visit 1:
(a) __________
(b) __________ Using the formula, calculate the
estimated population size for site
(c) __________ visit 1.
__________
Average = _____________
Site Visit 2:
(d) __________
Using the formula, calculate the
(e) __________ estimated population size for site
visit 2.
(f) __________ __________
Average = _____________
Site Visit 3:
(g) __________
Using the formula, calculate the
(h) __________ estimated population size for site
visit 3.
(i) __________ __________
Average = _____________
Site Visit 4:
(j) __________
Using the formula, calculate the
(k) __________ estimated population size for site
visit 4.
(l) __________ __________
Average = _____________
Estimate population = AVERAGE Total number of individuals COUNTED in the quadrat x total area of the sample site
Total area of the quadrat
12Based on your calculations answer the following questions
a) Use your estimated population numbers to draw a bar graph for each site visit. Use two different colours
to show the two different areas on the same graph.
Population estimation for each site visit for each area
Estimation Population numbers
250 000
200 000
150 000
100 000
50 000
0
Site Visit 1 Site Visit 2 Site Visit 3 Site Visit 4
Two areas per site visit
Peaces NewsellN (fill your chosen colours into the blocks)
b) Which area had higher population numbers overall?
_______________________________________________________________________________________
c) What is an explanation for this?
_______________________________________________________________________________________
_______________________________________________________________________________________
_______________________________________________________________________________________
d) Comparing the two areas, do you think that the law enforcement agency had made a good decision
regarding the management of the population of mussels? Explain your answer.
_______________________________________________________________________________________
_______________________________________________________________________________________
_______________________________________________________________________________________
e) From the case study, why did site visit 3 show such low numbers for both areas?
_______________________________________________________________________________________
132. Assessing the estimated numbers of predators at Peaces
You will be doing an estimation of the number of Dog Whelks in this area. As
you have read previously, Dog Whelks are a natural predator of mussels. You
need to estimate their population using the mark recapture method and then
compare their numbers to those of the estimated mussel populations in the
same area and make inferences by answering the questions. alc
hetr
on.com
MARK-RECAPTURE METHOD
This method is useful for determining population density, and for tracking movements of individuals.
METHOD:
• Mark out a well-defined area (this will be the same as you had for the mussel population estimation)
• Capture as many individuals as possible and mark them (tag )
• Release the marked individuals back into the environment
• Allow them sufficient time to mix thoroughly with the unmarked individuals of the species.
• Recapture as many of the individuals as possible
• Count the total number and count the number of those which have been marked.
• Calculate the total population size by using the formula:
P = Estimated population
P = M x C M = Total number marked animals
R C = Total number of animals caught in 2nd sample
R = Total number of marked animals caught in 2nd sample Wik
ipedia.com
pointreyesscience.worldpress.com
Assumptions: The accuracy of this mark-recapture method rests on a number of assumptions being met.
Assumption 1. During the interval between the preliminary marking period and the subsequent recapture period,
nothing has happened to upset the proportions of marked to unmarked animals (that is, no new individuals were
born or immigrated into the population, and none died or emigrated). Another way to state this assumption is that
the population is assumed to be “closed”. An exception is when there are equal proportions of deaths or emigrants
for marked and unmarked individuals during the sampling period. If deaths occur in this manner the proportions of
marked to unmarked will not change and thus we can still estimate the population. Notice the same cannot hold true
for births since a proportionate number of individuals will not be born with marks on them. Births can still occur and an
accurate estimate can still be made only if an equal number of unmarked individuals leave (or die) and are born. This
means that no marked individuals can leave, which would be highly unlikely. Notice that inherent in this assumption
is that the marking of the individuals has no effect on their survival. This is often the most difficult assumption to
meet since the mark may make the individual more noticeable to predators or may slow them down, such that more
marked individuals die than unmarked between the sampling periods. You should also be aware that the length of the
sampling period is very important. The shorter the time interval between marking and recapturing individuals reduces
the likelihood that this assumption will be violated. The longer the time interval the greater the chance that some
individuals will die, emigrate, immigrate or even be born and hence become an “open” population.
Assumption 2. The chances for each individual in the population to be caught are equal and constant for both the initial
marking period and the recapture period. That is, marked individuals must not become either easier or more difficult
to catch. Marking an individual does not make them more or less likely to be recaptured relative to unmarked
individuals. Furthermore, there cannot be something unique about those animals that were initially marked that make
14them more conspicuous. If only males are captured in the traps because females are busy incubating eggs or feeding,
then males may be more likely to be recaptured. Hence the population estimate would only be appropriate for those
animals with that unique behavior that make them easier to capture (i.e. males).Another problem deals with ‘trap
shy’ or ‘trap happy’ individuals. Some techniques for capturing and marking animals can have a dramatic effect on the
animal. ‘Trap shy’ animals quickly learn to avoid those traps or that area where the capture occurred making them
less like to be recaptured. The opposite can also occur, especially if the trapping method uses bait. A ‘trap happy’
individual is lured into a trap with food and is then marked. Later during the recapture period the animal may recall that
these traps had rewards (food) and that other than a little decoration (the mark) it made out pretty good. Therefore
it becomes ‘trap happy’ and is more likely to be captured in the trap compared to unmarked individuals who have not
experienced the rewards. Also notice that there cannot be any changes in behavior among individuals that may affect
capture probabilities. For example, in some species there are different times of peak activity for different classes in the
population. Adult males may be most active in the morning. Juvenile males and females may be most active midday,
and adult female may be most active in the afternoon. If you mark individuals in the morning you will capture and mark
mostly males. But if you perform your recapture sample at midday or the afternoon, you will capture mostly unmarked
juveniles or females, respectively. Again, you should realize that the length of time between the sampling periods plays
an important role in whether this assumption is violated.
Assumption 3. Sufficient time must be allowed between the initial marking period and the recapture period for all
marked individuals to be randomly dispersed throughout the population (so that assumption 2 above holds). However,
the time period must not be so long that Assumption 1 breaks down. If marked animals failed to disperse from the
sampling area, or if they tend to aggregate in groups, there is a higher probability that they will be recaptured relative
to unmarked individuals (or not depending on where they aggregate).
Assumption 4. Animals do not lose their marks. This is an important factor for animals that shed or moult as they grow
or as they respond to seasonal factors.
All these assumptions must be considered very carefully and play a strong role in the techniques used to perform the
study. A certain method of trapping may violate one assumption while another trapping method may violate another
assumption. Having too short of a time interval between sampling may lead to the violations of one assumption (which
one(s)?) while an interval that is too long will violate others (which one(s)?).
Reference for assumptions https://www.radford.edu/Biology 103
15Data set
There has been concern about the possible increase of Dog Whelks at the Peaces area site and you have been
asked to do a sample on the population to work out an estimation of their numbers during September 2020.
Month Sep-19 Mar-20 Sep-20
Population Estimate 268 351 ?
a) Using the data in this table work out the Estimate population for September 2020. You can use the
formula sheet to calculate your answers.
Number of marked Dog whelks at the start of the study 150
Sample 1 Sample 2 Sample 3 Sample 4 Sample 5
Total number of dog whelks
collected in a sample 220 185 193 244 207
Number of marked dog whelks
in sample 25 85 60 72 33
b) Has the population of Dog whelk increased or decreased during September 2020?
_______________________________________________________________________________________
c) Do you think your population estimation should be a concern regarding the population of mussels?
_______________________________________________________________________________________
_______________________________________________________________________________________
d) What would happen if you have overestimated the population number for September 2020?
_______________________________________________________________________________________
_______________________________________________________________________________________
e) What would happen if you have underestimated the population numbers for September 2020?
_______________________________________________________________________________________
_______________________________________________________________________________________
f) Can you describe any anomalies in your data set that may account for such a change in your population
numbers?
_______________________________________________________________________________________
_______________________________________________________________________________________
16g) Do you have any ideas on how this could be avoided?
_______________________________________________________________________________________
_______________________________________________________________________________________
MARK RE-CAPTURE FORMULA SHEET FOR PEACES Total number of marked animals = ___________
SAMPLE 1:
Estimate population = Total number of tagged individuals (M) x total number in 2nd sample
Total number of tagged individuals in second sample
= ________________ x ______________
___________________
= ______________ (a)
SAMPLE 2:
Estimate population = Total number of tagged individuals (M) x total number in 3rd sample
Total number of tagged individuals in third sample
= ________________ x ______________
___________________
= ______________ (b)
SAMPLE 3:
Estimate population = Total number of tagged individuals (M) x total number in 4th sample
Total number of tagged individuals in fourth sample
= ________________ x ______________
___________________
= ______________ (c)
SAMPLE 4:
Estimate population = Total number of tagged individuals (M) x total number in 5th sample
Total number of tagged individuals in fifth sample
= ________________ x ______________
___________________
= ______________ (d)
SAMPLE 5:
Estimate population = Total number of tagged individuals (M) x total number in 6th sample
Total number of tagged individuals in last sample
= ________________ x ______________
___________________
= ______________ (e)
Average = ((a) _____ + (b) _____ + (c) ______ + (d) ______ + (e) ______) / 5 = _______
17You can also read