Presentation of full year results to 30 September 2019 - November 2019 - Urban ...
←
→
Page content transcription
If your browser does not render page correctly, please read the page content below
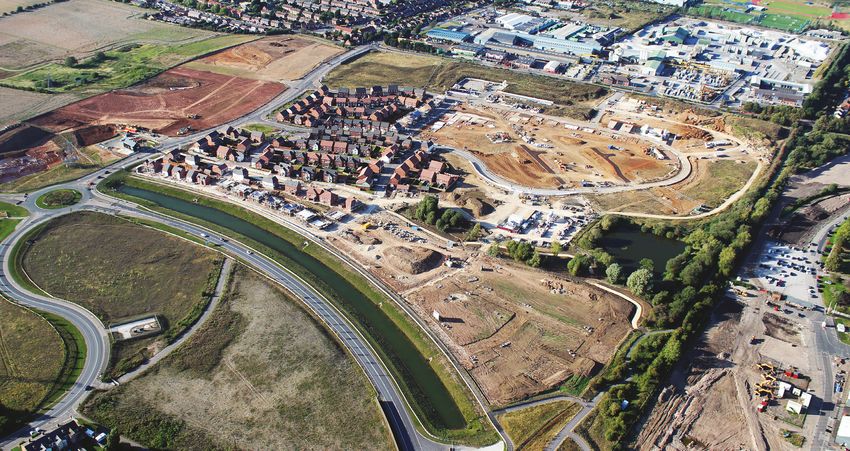
Presentation of full year results
to 30 September 2019
November 2019

1

Nature corridor - Houlton, Rugby
Key financial headlines
                            Financials
                            EPRA NAV 360.3p per share: near 9 per cent growth.
                            EPRA NNNAV 339.5p per share: up 7.5 per cent.

                            Plot sales
                            Actual 2019 plot sales 5 per cent ahead of 2018 forecast by
                            number and 3 per cent by revenues, reflecting different mix
                            not prices. Annual share of contracted future minimums
                            exceeds £100 million for first time.
                            Changed valuation assumptions
                            8 per cent up on income v 3 per cent on value
                            like for like against September 2018.
                            Translates into £25 million less uplift to reflect current cautions.
                            Additionality
                            Each new strategic planning consent affords the realistic
                            prospect of an additional 15-year plus income stream.
                            Waterbeach £24.6 million initial uplift.
                            Large site discount
  Urban&Civic has now       £197 million or 135p per share.
demonstrated unbroken       EPRA NAV + large site discount 495.0p per share.
five-year growth against
   generally static land    Dividend
                            Final dividend 2.5p per share.
prices, building platform
                            11.4 per cent annual increase to recognise maintained strong
and brand recognition in
                            performance and maturing project profile.
      the process.

2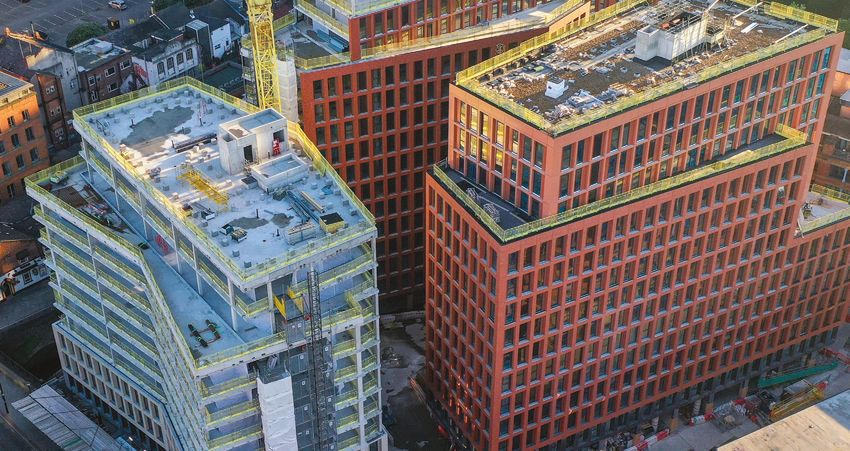
10 years and counting

                                  Newark
                                           9 sites: 6 in delivery

                                                      10 partners

                                                              16 stakeholders

                             do
                                                           19 housebuilding customers
                    o   f Lon n
                 es
             l
           mi
          1 00

3   Established platform advantage
Key gradients
Growth and additionality in generally static land markets

                                                                                             £ million
                                                                                £101.7m
                                                                   £93.4m

Contracted minimum
receipts (U&C share)      £48.2m
                                                 £57.2m
                                                                                             £ million
                                                                                £30.7m
    Annual contracted                                              £23.6m
    minimum receipts                             £12.3m
                                                                                             Plots
                          £10.8m
         (U&C share)                                                           1,797 plots
                                                                 1,563 plots

    Contracted unsold
         plots (100%)    962 plots
                                                1,135 plots

    Years forward sold
                         4.5 years              4.6 years
       (at contractual                                            4.0 years                  Years
      minimum rates)                                                           3.3 years

                         September             September         September     September
                           2016                   2017             2018          2019

Licences only

4    Each new consent establishes likely 15 year income stream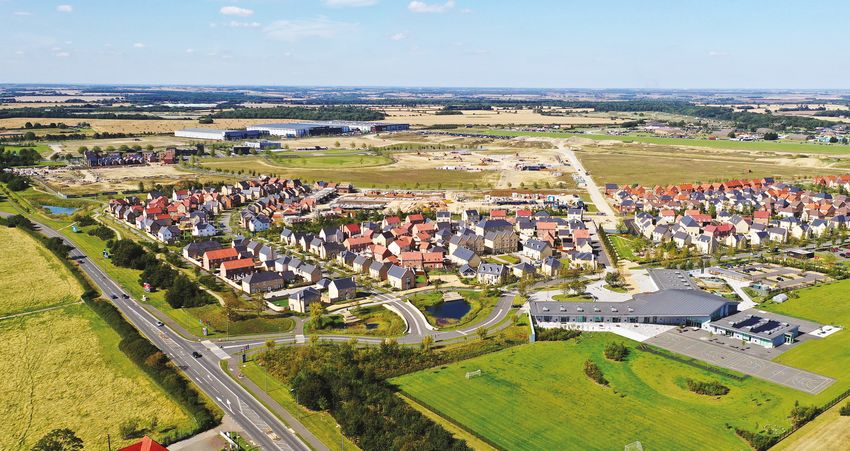
Government policies can be seen to be working
    Annual additional new dwellings in England
    (Current new consents running at around 370,000 per year)

                  300,000                                                                                                                    New build completions

                                                                                                                                             Other net additional

                  250,000
Number of homes

                  200,000

                  150,000

                  100,000

                   50,000

                       0
                              2007–08 2008–09 2009–10              2010–11      2011–12     2012–13       2013–14   2014–15   2015–16   2016–17    2017–18      2018–19

                            Source: MHCLG/ONS: Annual net additional dwellings and components, England.

   5               241,000 new homes, eight per cent above 2007-08 and the highest in 30 years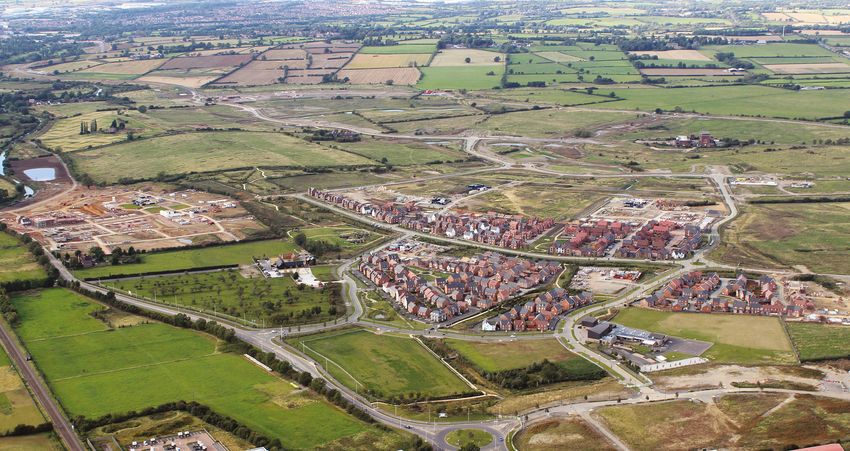
Recent MHCLG data confirms sufficient house supply across MOST of England
                      Government standard measure aggregates 273,000 new homes per year
                      80,000
                                                                                                                                                    Total net additions 2016-17

                                                                                                                                                    Total net additions 2017-18
                      70,000

                                                                                                                                                    Total net additions 2018-19
                      60,000                                                                                                                        Government standard measure
Number of dwellings

                      50,000

                      40,000

                      30,000

                      20,000

                      10,000

                             0
                                                     Below standardised methodology                        Close to or above standardised methodology
                                                London           South           East of   South   North                East            West             Yorkshire         North
                                                                  East           England   West    West               Midlands         Midlands           and the          East
                                                                                                                                                         Humber

                                                                C       M       AW Wi                                 Ne PH
                           Urban&Civic
                           project location                         T                 WB                                 R
                          Source: Lichfields.

                      6       Shortfall only in areas of high demand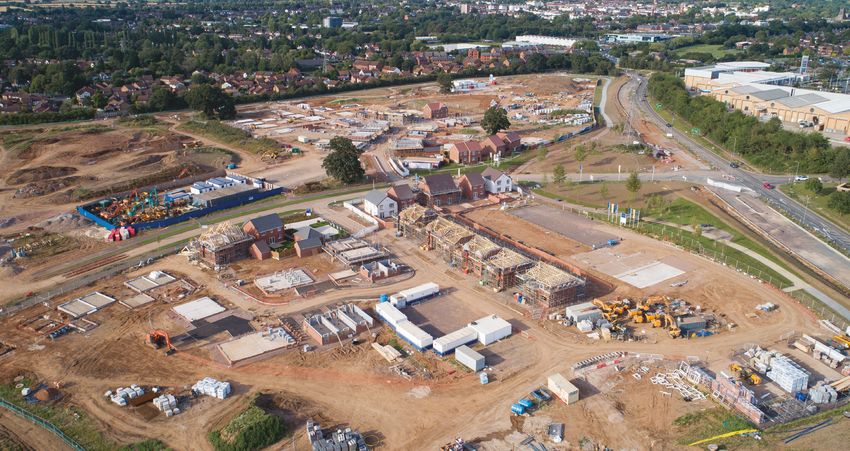
Continued movement along the hockey stick
                     Site progress – September 2019 against September 2018
                     Small steps and big jumps
                                                Second Generation First Generation
                                  Land assembly and site purchase
Net capital invested/returned £

                                                                                                                                                       Priors Hall

                                                                    Calvert

                                                                              Tyttenhanger (new site)                                        Alconbury Weald
                                                                                                                                            RadioStation Rugby

                                                                                    Manydown

                                                                                                                                   Newark

                                                                                                        Waterbeach
                                                                                                                     Wintringham

                    7             Show and tell: first generation projects are our best corporate advert
                                    See page 37 for 2018 comparison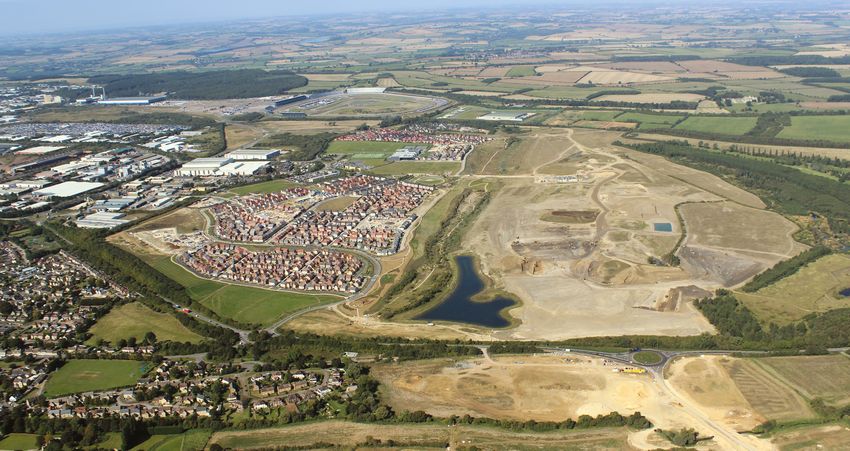
Master Developer in action
 Managing growth

                                                                  Large projects represent an increasing
                                                                  proportion of total planning consents.
                                                                  Urban&Civic account for approximately 20 per cent of large
                                                                  site consents.
                                                                  Necessarily infrastructure led
                                                                  Large projects are seen increasingly as able to deliver
                                                                  environmental and educational gains that infill sites never can.
                                                                  Building our own prime
                                                                  Creates value and drives absorption rates.
                                                                  Keys are location and stakeholder allignment.
                                                                  Show and tell
                                                                  Seeing is believing.
                                                                  Project delivery is home ground for Urban&Civic.
                                                                  Second generation
  Debate over large site                                          Starting with Wintringham, next generation of projects
contribution to South East                                        are in significantly more constrained supply locations.
 housing shortfall is over.
Moved to practicalities and
   quality of delivery.

 8   Urban&Civic accounts for 20 per cent of current large site consents
Financial highlights - sustained growth across key metrics

    665 plot completions (excl. Europa Way)      EPRA NAV                                      EPRA NAV + wholesale discount
      + 49.4 per cent up                           360.3p per share (+8.6 per cent)              360.3p + 135.0p = 495.3p
    Generating £42.4m of cash                    EPRA NNNAV		                                    +3.9 per cent
      U&C share: £34.3m (+63 per cent)             339.5p per share (+7.5 per cent)

                                                                                  360.3p

                                     665 plots                                                                                     495.3p

    Gearing                                      Gross profit (including share of JVs)         Dividends
    EPRA NAV basis                                 £28.4m (FY18: £29.4m)                         3.9p for year (2.5p final dividend)
      19.9 per cent (FY18: 16.3 per cent)                                                        +11.4 per cent
    Look through EPRA NAV basis
      28.3 per cent (FY18: 20.6 per cent)

                                                                                      £28.4m
                                                                                                                                   3.9p
                                      19.9%

9     Detailed charts in appendices
Accelerated sales progression

                                         Actual                                                           Estimated

                                                                                                   5 sites                 1 site
                                                           4 sites            1 site         1,200 completions        334 Europa Way
                                                      665 completions    401 Europa Way         + land sales
                                                                                               Cash: £80.0m +
                                                       Cash: £42.4m
                                                                                            U&C share: £60.0m +       U&C share: £3.5m
                                                     U&C share: £34.3m   U&C share: £2.3m

                                      4 sites
                                  445 completions
                                   Cash: £24.3m
                                 U&C share: £21.0m

                    1 site
               52 completions
              U&C share: £5.5m

      1 site
  1 completion
U&C share: £0.1m

   2015/16         2016/17          2017/18                       2018/19                                   2019/20

  10
Cash flow evolution - an illustrated example
Day 1 After 2 years After 3 years After 4 years
First housebuilder One housebuilder selling 40 homes per year 3 housebuilders selling 40 homes per year 5 housebuilders selling 40 homes per year
contract exchanged (0.8 homes per week, per sales outlet) (on 2 sales fronts)
£300,000 house is sold:
Contract signed
Urban&Civic receives £100,000
Housebuilder receives £200,000 Contract signed
Site opener
(e.g Hopkins)
Contract signed
Contract signed
40 homes x £100,000 120 homes x £100,000 200 homes x £100,000
£4.0m gross proceeds £12.0m gross proceeds £20.0m gross proceeds
Illustration applied to U&C ownerships:
Alconbury Weald 100% of site owned
RadioStation Rugby 50%
Newark 82%
Wintringham 33%
Priors Hall 100%
Total sites (fully owned equivalence) 365% x £20million = £73m gross proceeds to Urban&Civic
11Cash movements
(including Group’s share of joint ventures) £(87.4m)
£66.3m
Cash (100%): £42.4m
Completions: 665 plots
Cash per plot: £63.8k
U&C share of cash: £34.3m
£23.1m
£(25.2m)
£4.5m
£34.3m
£(5.3m)
£27.4m
£17.1m
Sept 18 Residential Commercial Catesby Loan Capital Overheads, Loan Sept 19
receipts receipts receipts drawdowns expenditure dividends and repayments
payments to EBT
12 Residential + Catesby receipts rather than commercial salesSummarised balance sheet as at 30 September 2019
(Joint ventures proportionately consolidated)
At At
30 September 30 September
£m 2019 2018 Comments
Property interests 586.5 523.8 Investment, PPE and trading properties, plus overages
and minimums (wholly owned or in JV)
Cash 27.4 17.1
Homes England (122.6) (92.6)
(149.5) (99.1)
Other (54.3) (23.6)
609.1
702.5
Total Borrowings (176.9) (116.2)
Deferred tax liability (5.9) (4.1)
Working capital (28.1) (31.6)
IFRS net assets 403.0 389.0
EPRA adjustments – property 116.0 85.3 Revaluation of trading properties
EPRA adjustments – tax 8.5 6.9
EPRA net assets 527.5 481.2
EPRA triple net adjustments (30.5) (23.1)
EPRA triple net assets 497.0 458.1
£m
£m
Property portfolio 702.5
Gross borrowings (179.1)
Net debt (149.5)
Loan arrangement costs 2.2
Other (56.0)
Borrowings (176.9)
EPRA triple net assets 497.0
13Property portfolio – September 2019
£594.8m Alconbury Weald RadioStation Rugby
85%
EPRA carrying values –
by segment
Commercial
£286.1m £113.4m
£702.5m Catesby
Strategic sites
£78.7m
11% Unserviced residential £146.3m Unserviced residential £59.5m
Servicing, housebuild and Servicing, other costs and
other costs and overage and overage and minimum
£29.0m minimum receivables £57.6m receivables £49.4m
4% Commercial £45.4m Commercial £4.5m
£68.2m Expansion Land £36.8m
£113.4m
16% 10% EPRA carrying values –
£47.5m by asset Priors Hall Newark
7%
Alconbury Weald
£46.0m RadioStation Rugby (50% interest)
6% Priors Hall
£68.2m £47.5m
Newark (82.2% interest)
£702.5m £33.6m Wintringham (33% interest)
5%
Waterbeach
Commercial work in progress
£78.7m Unserviced residential £48.5m Unserviced residential £15.8m
Catesby
11% Servicing, other costs
Servicing, other costs
and receivables £19.7m and receivables £24.3m
£286.1m
41% £29.0m Commercial £7.4m
4%
14 Clear focus on Master Developer activitiesDebt summary – stable platform
(including Group’s share of joint ventures)
Gross borrowings – 30 September 2019 All-in cost of borrowing by lender
£14.2m 3.4%
(8%)
Homes England (strategic sites) Homes England (strategic sites)
£24.1m
(14%) Corporate RCF 5.4% Corporate RCF
Manchester (joint venture) Manchester (joint venture)
Other Other
£179.1m1 3.8%
£16.9m 3.3%
(9%)
£123.9m
(69%) 3.8%
Loan maturity analysis Loan maturity analysis by lender
£1.0m
(1%) 2.9 years
More than three years Homes England (strategic sites)
£44.5m Between one and three years 1.3 years Corporate RCF
(25%)
Less than one year Manchester (joint venture)
Other
£179.1m1 6.7 years
4.5 years
£133.6m 8.8 years
(74%)
1
Including £47.7m borrowings held by joint ventures (£19.3m Radiostation Rugby, £24.1m Manchester New Square, £4.3m Wintringham) and gross of £2.2m of loan arrangement costs.
15 Homes England funding accounts for 69 per cent of drawn debtSummarised income statement
(Joint ventures proportionately consolidated)
Year to Year to
30 September 30 September
Joint ventures 2019 2018
£m Group and associates Total Total Comments
Revenue 102.1 29.4 131.5 159.2 Trading and residential property sales including share of JVs,
rental and other property income
Gross profit 21.2 7.2 28.4 29.4 Profits on trading and residential property sales,
rental and other property income
Administrative expenses (19.9) (0.1) (20.0) (18.8) Net of capitalisations
IFRS valuation movements 6.7 — 6.7 11.7 Revaluation of investment properties and receivables
Share of post-tax profit from 8.0 (8.0) — —
joint ventures
Other 0.3 0.9 1.2 — Finance income
Profit before tax 16.3 — 16.3 22.3
Tax (3.7) — (3.7) (3.6) Current and deferred tax
Profit after tax 12.6 — 12.6 18.7
16Movements in EPRA NAV per share: +8.6 per cent (or 28.5p)
Valuation
Sales:
movement:
Profit on property
Growth in value
sales (net of previous
of retained
EPRA adjs) 16.7p
properties 28.1p 3.6p (13.7)p
19.9p
(3.5)p
(4.4)p
24.6p (3.2)p 0.7p 360.3p
3.5p
331.8p
EPRA NAV Revaluation of Revaluation of Reversals of prior Trading property Rental and other Administrative Dividends paid Other Add back EPRA NAV
30 September investment trading period trading sales property income expenses deferred tax 30 September
2018 properties and properties property + effect of IFRS liability 2019
write down (EPRA adj) + revaluations on 15 adoption (EPRA adj)
of trading effect of IFRS 15 sales
properties adoption (EPRA adj)
17 Movement in EPRA NNNAV per share: 7.5 per cent (or 23.6p) = 28.5p EPRA NAV per share - 4.9p of deferred taxMaster Developer in operation
Newark
Regional critical mass
Platform and resourcing
Build to rent
Tentative steps into modular
Cementing relationships with housebuilders
18Delivery • Secondary school on site 1,000+ pupils • St. Gabriels primary school now has 170 pupils • Supermarket/nursery agreements exchanged • Terms for on site fitness centre 19
Delivery

            ne   d N ove m b er 20
     O   pe                          19

20
Delivery
• 455 contracted plots with 2 housebuilders
• 2 new housebuilder deals under offer
• First occupations expected 2020
• Over 10,000 trees planted to date
• First primary school under construction
e pt e m b e
n ing S r2
02
O pe 0
21Delivery
• Crest Nicholson and second phase Hopkins added
• Cambridgeshire County Council HQ - construction
works commenced
• A14 (motorway standard) due to open late 2020
• Local plan allocation for 1,500 units confirmed
• Best Mixed Use Development,
National Planning Awards 2019
22Delivery
• 7 housebuilders on site
• Expunging sins of the past
• 46,000+ trees planted in 2018/2019
• 8 playgrounds created
• New café and U&C office opened
• District centre/nursery consented
• Earth works started for zones 2 &3
23Delivery • Additional parcel sold to Bellway • One further parcel under offer • New café and U&C office opened • Frist primary school to open September 2021 24
Delivery

•        Outline Consent September 2019 for 6,500 homes
•        Enabling works already started
•        Significant construction commences Q1 2020

    25
Planning
• Early key stakeholder engagement
• Site visits for Officers and Members of Hertsmere Borough
Council to Alconbury and Rugby
• Technical workshop held with ongoing site wide analysis
identifying opportunities and constraints
26Planning
• Commercial arrangements with Basingstoke and Deane Borough
Council, Hampshire County Council and Wellcome nearing completion
• Outline planning permission for 3,500 homes expected Q2 2020
27Delivery • Joint Venture with Greater Manchester Pension Fund • £89.0m construction contract on time on budget • Completions Spring/Autumn 2020 • 145 of 351 units exchanged/reserved • Help to Buy to be available early 2020 28
Contribution to EPRA NAV:
  Revenue                 £10.1m
  PAT                     £5.3m
  Net EPRA movement        £1.4m
  Contribution to EPRA    £6.7m

Net capital invested:
   Net capital invested    £16.1m
   EPRA uplifts           £12.9m
   EPRA carrying value    £29.0m

Catesby Pipeline: 10,000 units

29
Calvert: only Urban&Civic project that relies on policy infrastructureA1 Rushden
Spa A5 A14
Northampton
Warwick A45
St Neots A428 A14
© Crown copyright and database rights 2018 OS 100030649
Daventry
Cambridge
Cambourne
Proposed route of HS2 Existing Oxford to Cambridge rail track
Stratford-
Cambridge
upon-Avon
B1 Expressway B3 Expressway
Existing MotorwayM1 Bedford A11
Corridor Corridor A421
Towcester
M40
A1
A5 Biggleswade
A43
Royston Saffron
Banbury Walden
Brackley
Milton Keynes
Buckingham Letchworth Baldock
Newton
Longville
Moreton- Hitchin M11
in-Marsh
Chipping A5
Stow-on-
Norton Bicester
CalvertLeighton
Buzzard A5
Luton A1(M) Bishop’s
the Wold
London
Stevenage Stortford
East West Rail Luton
Dunstable
Aylesbury Harpenden Hertford Ware
Kidlington Harlow
Witney Tring Hemel Welwyn
Oxford Hempstead
St Albans Garden
City
Hoddesdon
Thame A414 Hatfield Chelmsford
A34 Potters Epping
Lechlade- Bar
on-Thames
Chesunt A405
M40 Amersham A1 M25
Abingdon High Brentwood
Watford
Wycombe M1 Barnet
Faringdon Milton Beaconsfield M11
Gerrards M25
Cross Harrow
Wallingford
LONDON
Didcot A40 Ilford Romford
Wantage
A404 Euston
A308(M)
M4 London
Henley- Maidenhead Slough
A34 Ealing City Dagenham
on-
Thames M4
Old Oak City
Common
Reading A404(M)
M4 A282
M4 M4 Richmond
Windsor A3113
A30
London Heathrow
A2
Marlborough
Source: Highways Hungerford
England Bracknell Egham Staines A316
Wokingham Croydon
30 Two out of three may not be badSustainability at the heart of what we do:
Sustainability Capitals
Physical
Progressing a sustainability review to To design high quality places
establish a business wide Sustainability that mature with age and
Framework in 2020 based around 5 key allow people to navigate
easily on foot or by bike
capitals.
Human Social
To focus on people, To create vibrant
improve their quality communities and
of life and create a bring people together
sense of pride through community
citizenship
Natural Economic
To build in harmony with To build lasting
nature to protect the partnerships
existing value and make and provide economic
a positive contribution opportunities
31 Increasing recognition of virtues of Master Developer dividendSustainability at the heart of what we do:
Operating at scale
136,608
trees planted
(72,000 this year)
154
hectares of
land remediated
28,340
metres of cycle
lanes delivered
32 Demonstrable business differentiator: Waterbeach largest 2019 residential consent in the countryKey takeaways: looking beyond immediate politics Demographic necessity Land supply shortfall limited to Urban&Civic 100 mile radius in SE England. Not realistic to meet housing demand in that area without more big projects, whatever the Government. Increasing virtue Sustainability necessarily at the heart of what we do. Biodiversity and quality of life integral to the Urban&Civic Master Developer dividend. New prime New prime engaging motivated house buyers. Urban&Civic projects disproportionately attract first time buyers and growing families: precisely the groups with the current highest tendency to move. Our customers are building faster Houlton outselling Rugby average by 50 per cent. Near term sales 28 housebuilder contracts at September 2019, including 9 repeats. 3.3 years x on contracted forward sales. 11 parcels under offer, 6 new customers. 2019/20 central Business Plan is for a near doubling to 1,200 plot realisations on strategic sites. Next generation Second generation of Urban&Civic projects starts with Wintringham. All located in areas of constrained supply. 33 Resilient on continued uncertainty and positioned for any early bounce
Appendices

34
Strategic sites in numbers

                                                                                                                                                                                                       Under
                                                                                              Plot                    Plot                                                                 Civic     licence,
                                                                     Total           completions             completions                  Units                            Under          Living   offer or in
                                          Ownership                  units           to Sept 2018            to Sept 2019             remaining          Contracted         offer    in delivery    delivery

Alconbury Weald                               100%                  5,000                        153                     144                 4,703                   581      246            134        25.2%
Radiostation Rugby                             50%                   5,952                        78                     155                  5,719                 629        511            —         23.1%
Priors Hall                                   100%                  4,320 1                     230                      279                  3,811                 273       248             —         23.8%
Middlebeck Newark                             82.2%                  3,150                        37                      87                 3,026                  258       160             —         17.2%
Waterbeach                                      DMA                 6,500                         —                       —                 6,500                    —         —              —             —
Wintringham St Neots                          33.3%                 2,800                         —                       —                 2,800                   455       391             —        30.2%
Consented strategic sites                                           27,722                      498                     665                26,559                  2,196    1,556            134        18.2%

Europa Way                           Promotion and infrastructure      735                        —                      401                   334                   68       266             —         100%

Consented                                                           28,457                      498                    1,066               26,893                  2,264     1,822           134       20.3%
Alconbury – Grange Farm          3
                                              100%                   1,500                        —                       —                  1,500                   —         —              —             —
Manydown      2
                                               25%                  3,500                         —                       —                 3,500                    —         —              —             —

Allocated                                                           5,000                         —                       —                 5,000                    —         —              —             —
                                      Promotion and conditional
Calvert                                      purchase               5,000                         —                       —                 5,000                    —         —              —             —
Tyttenhanger                                    DMA                 4,000                         —                       —                 4,000                    —         —              —             —

Strategic sites total                                               42,457                      498                    1,066               40,893                  2,264     1,822           134        13.6%
1
 Unsold units at acquisition out of a total consent of 5,095. An application for a further 221 units (taking total consent to 5,316) was submitted in the year.
2
  Selected by Basingstoke and Deane and Hampshire County Councils with Wellcome Trust; land allocated.
3
  1,500 unit allocation in Local Plan.

    35
Site statistics Formal
open spaces
and sports
Gross NDAs - NDAs - Employment pitches
acres residential commercial Homes (sq.m.) (hectares) Schools Other Housebuilders Connectivity
Alconbury Weald 1,063 338 163 5,000 290,000 m2 21 3 primary, reserve site for railway station, 3,800 Hopkins Homes, 55 mins to London;
1 secondary m2 community facilities, Morris, Redrow, under 1 mile from A1(M)
1,500 m2 health centre, one district centre Civic Living, and A14
and three local centres, network Crest Nicholson
of cycle paths
AW Grange Farm 362 1,500 2,000m2 5.43 (As above)
RadioStation 1,170 363 36 5,952 120,000 m2 24 3 primary, new link road, 14 km of Davidsons, 50 mins to London; 35 mins
Rugby 1 secondary footpaths, one district centre Crest Nicholson, to Birmingham; under
and three local centres, Morris Homes, 1 mile from M1, four miles
2,900 m2 of community facilities, eight Redrow from M6 and under one mile
GP surgery, network of cycle paths from Daventry International
Rail Freight Terminal
Priors Hall 965 281 13 4,320 25,000 m2 26 3 primary, district centre & two local Barratt Homes & David 70 mins to London;
1 secondary centres, network of Wilson Homes, Kier 30 mins to M1
footpaths and Homes, Taylor Wimpey,
cycleways, country park Francis Jackson
Homes,
Jelson Homes, Larkfleet
Homes, Lodge Park,
Project Etopia
Newark 694 172 110 3,150 186,000 m2 7 1 primary new link road, 2,900 m2 Avant, Bellway 1 hour 30 mins to London;
community facilities 30 mins to Nottingham;
1 mile from A46 and A1(M)
Wintringham 400 2,800 63,500 m2 10 2 primary 9 km of cycle ways Cala Homes, Under 50 mins to London;
St Neots Morris Homes less than three miles to M1
Waterbeach 716 375 13 6,500 27,000 m2 24 3 primary, park & ride, health centre 70 mins to London; three miles
1 secondary to Cambridge Science Park
adjacent to A10
Manydown 794 271 3 3,500 6,000 m2 25 2 primary, 1 health care centre, 45 mins to London
1 secondary 2 community centres,
sports hall, country park
Calvert 785 5,000 On the intersection of HS2
and Varsity line
Tyttenhanger 2,000 4,000
36 1
Formal sports provision provided within the Alconbury Weald country park.Site progress to September 2018
Land assembly and site purchase
Net capital invested/returned £
Priors Hall
Calvert
Alconbury Weald
Manydown
Waterbeach
Wintringham
RadioStation Rugby
Europa Way Newark
37Site progress plans – Alconbury Weald
Hopkins Homes
A The Club 1 • 128 units
• 11.9 acres
B Incubator •
•
On site: Q1 2016
First completions: Q3 2016
C Incubator 2 2 Morris Homes
• 165 units
• 13.3 acres
D IKO •
•
On site: Q1 2017
First completions: Q4 2017
D E MMUK 3 Redrow
• 200 units
• 18.3 acres
E 6a F John Adams Toys • On site: Q1 2017
P • First completions: Q4 2017
O F G Ermine Street Church Academy
primary school 4 Civic Living
• 138 units
• 8.3 acres
M L H iMET • On site: Q4 2017
• First completions: Q2 2019
H K
I 6 7 I Cricket pitch
5 Hopkins Homes
5 8 •
•
189 units
12.8 acres
5 10 J Community park •
•
On site: Q3 2019
First completions: Q2 2020
4 3 Q K Watchtower Green
6 Crest Nicholson
2 9 • 192 units
1 J L The Glade
•
•
11.6 acres
On site: Q2 2019
• First completions: Q2 2019
M G N M Cambridgeshire County
Council HQ 6a Future residential parcel
H K N Allotments
7 Under offer
• 246 units
C
B A O Magpas • 14.1 acres
I
P Primary sub station 8 Future residential parcel
5
Q Secondary school
9 Future residential parcel
R Cricket pavillion/
community building 10 Future residential parcel
38Site progress plans – Houlton
Davidsons Homes
A St Gabriels CofE Academy
primary school 1 • 245 units
• 18.5 acres
• On site: Q4 2016
B Dollman Farm
• Project office / marketing suite
• First completions: Q4 2017
• Community building
•
•
Tuning Fork Café
Food store
2 Morris Homes
• 183 units
• Children’s nursery • 15.0 acres
• On site: Q3 2017
• First completions: Q3 2018
C Link road
3 Crest Nicholson
• 186 units
D Houlton school
Secondary school
•
•
11.8 acres
On site: Q3 2017
• First completions: Q1 2018
C E Gym 4 Redrow
D • 248 units
• 23.2 acres
4 • On site: Q1 2019
• First completions: Q1 2020
5
5 Under offer
• 151 units
• 13.1 acres
6 6 Under offer
• 360 units
2 3 • 20.9 acres
1
A
B
E
39Site progress plans – Priors Hall
Francis Jackson
A Corby Business Academy 1 • 53 units
B Priors Hall primary school 2 Larkfleet Homes
• 144 units
EDG Homes
3
C Corby Enterprise Centre
• 24 units
4 Jelson Homes
• 132 units
Zone 3 D Children’s nursery
5 Project Etopia
• 47 units
E Proposed Doctors surgery site
6 Kier
• 65 units
1 F Food store / district centre
7 Under offer
• 84 units
Barratt Homes
2
G Care home 8 • 62 units
A 10 9 Under offer
• 40 units
G Zone 2
B F Under offer
E 10 • 75 units
C D 9 3
Under offer
11 • 49 units
5 4
6
11
7
8
40Site progress plans – Middlebeck Newark
Avant Homes
A Primary school 1 • 173 units
• 16.1 acres
• On site: Q3 2017
• First completions: Q2 2018
B Project office/café
A 2 Bellway Homes
• 64 units
C Link road •
•
4.2 acres
On site: Q1 2018
• First completions: Q3 2018
Bellway Homes
D Sustrans Bridge 3 • 145 units
• 10.3 acres
3
4 2 •
•
On site: Q2 2019
First completions: Q4 2019
Under offer
4 • 160 units
• 12.5 acres
1
B
C
D
41Site progress plans – Wintringham St Neots
A Primary school
1 Cala Homes
• 222 units
3 •
•
14.7 acres
On site: Q3 2019
• First completions: Q2 2020
1 2 Morris Homes
A • 233 units
2 •
•
16.8 acres
On site: Q4 2019
• First completions: Q2 2020
5 3 Under offer
• 285 units
4 • 14.4 acres
2
4 Under offer
6 • 106 units
• 8.7 acres
5 Future residential parcel
6 Future residential parcel
42Valuation assumptions
Alconbury Weald RadioStation Rugby Newark Priors Hall Wintringham Waterbeach
Significant inputs Sep 19 Sep 18 Sep 19 Sep 18 Sep 19 Sep 18 Sep 19 Sep 18 Sep 19 Sep 18 Sep 19
House price – private (£p.sq.ft) 300 300 280 280 215 210 235 234 300 300 380
House price – affordable (£p.sq.ft) 200 200 170 170 125 125 123 177 184 174 242
Expected annual house price inflation (%) 2.50 3.00 2.50 3.00 2.50 3.00 2.50 3.00 2.50 3.00 —
Expected annual cost price inflation (%) 2.00 2.00 2.00 2.25 2.00 2.25 2.00 2.25 2.00 2.25 —
Land price (£ per NDA) 1,450,000 1,450,000 1,325,000 1,300,000 693,500 681,700 1,000,000 1,000,000 1,415,000 1,400,000 1,622,000
Risk adjusted discount rate (%) 6.00-9.35 6.00-9.60 6.00-9.35 6.00-9.70 6.00-10.00 6.00-10.25 6.00-9.85 6.00-10.25 6.00-9.85 7.00-10.50 10.00
Unserviced plot value (£p.sq.ft) 31,100 28,300 20,800 20,300 7,500 6,500 13,900 10,500 27,400 23,900 13,400
Note: CBRE have valued Waterbeach Development Management Agreement for the first time in September 2019.
43Wholesale to retail: a store of reversionary value
Large site discount at 30 September 2019
£297,600 Average sales price £254,000 Average sales price
Key £96,800 Cash assumed realised by £76,800 Cash assumed realised by
Blended Urban&Civic per house (we are making more) Blended Urban&Civic per house (we are making more)
Housebuilder margin and construction cost
£200,800
Cost of servicing land (actual and imputed) £177,200
CBRE valuation £53,600
£35,000
Wholesale discount £31,100 £20,800
£12,100 £21,000
Unsold plots 4,703 Unsold plots 5,719
Serviced land value Unserviced land value
Discount (unsold plots x implied discount) £57 million Discount (unsold plots x wholesale discount) £120 million
U&C share (50 per cent) £60 million
£299,700 Average sales price £253,500 Average sales price £325,400 Average sales price
£94,300 Cash assumed realised by £69,200 Cash assumed realised by £92,700 Cash assumed realised by
Blended Urban&Civic per house (to be determined) Blended Urban&Civic per house (to be determined) Blended Urban&Civic per house (to be determined)
£205,400 £232,700
£184,300
£54,900 £53,000
£40,000
£13,900 £13,400
£27,400
£15,300 £26,300
£12,000
Unsold plots 2,800 Unsold plots 3,494 Unsold plots 6,500
Discount (unsold plots x wholesale discount) £33 million Discount (unsold plots x implied discount) £54 million Discount (unsold plots x wholesale discount) £170 million
U&C share (33.3 per cent) £11 million U&C share (9 per cent) £15 million
44 Total large site discount £197m or 135p per shareUK quoted housebuilder land bank
Period Plots Annual completions Average sales price2 Gross margin ROCE Land cost % of ASP
Barratt FY – 30 Jun 19 85,229 17,111 £274,400 22.8% 29.7% 16.6%
Persimmon HY – 30 Jun 19 95,086 15,168 1
£216,942 33.8% 40.5% 13.9%
Taylor Wimpey HY – 30 Jul 19 77,060 12,864 1
£261,000 23.6% 32.0% 3
15.6%
Bellway FY – 30 Jul 19 42,993 10,892 1
£291,968 24.6% 24.7% 21.1%
Redrow FY – 30 Jun 19 28,566 6,443 1
£324,500 24.1% 28.5% 19.0%
Berkeley FY – 30 Apr 19 54,955 3,698 £472,000 27.6% 27.9% 12.5%
Bovis HY – 30 Jun 19 19,745 3,2941 £269,200 21.6% 19.8% 18.4%
Crest Nicholson HY – 30 Apr 19 18,060 2,374 1 £351,000 4 20.0% 23.0% 4 16.0%
1
Half year completions pro rated for full year
2
Including affordable homes
3
FY – 31 December 18 figure – HY ROCE figure no disclosed
4
FY – 31 October 18 Figure
45Financial highlights: support 1
Plot completions (total strategic sites) Cash flow generation from plot completions £42.4m
(total and U&C share)
665 £8.1m
£25.3m
445 £4.3m £34.3m
£21.0m
£5.5m
52
nil 1 nil £0.1m
2015 2016 2017 2018 2019
2015 2016 2017 2018 2019
JV share U&C share
EPRA NAV per share + EPRA NNNAV per share 360.3p EPRA NAV per share + large site discount
(+8.6%)
(8.7% annual growth in EPRA NAV per share + 7.7% annual
growth in EPRA NNNAV per share since listing) 20.8p
331.8p
(+9.0%) 339.5p
476.8p 495.3p
(+7.5%) (+3.9%)
15.9p (+28.0%)
304.4p
(+7.1%) 372.4p
284.2p 344.2p (+8.2%) 135p
315.9p 145p
(+5.1%) (n/a%)
12.1p (+8.1%)
68p 360.3p
8.8p 60p
331.8p (+8.6%)
292.3p 304.4p (+9.0%)
275.4p 284.2p
(+6.1%) (+7.1%)
(+5.0%) (+5.1%)
2016 2017 2018 2019 2016 2017 2018 2019
EPRA NNNAV EPRA NAV
46Financial highlights: support 2
Gearing – EPRA NAV basis Gross profit analysis £29.4m
£28.4m
£6.9m £9.7m
£18.1m £14.9m
£17.2m
£5.2m £3.8m
£4.3m
19.9% £14.9m
18.6% £11.7m £5.4m
16.3%
8.4% £7.5m £7.6m
£1.2m
2016 2017 2018 2019 2016 2017 2018 2019
Strategic sites Commercial Catesby
Total shareholder return Dividends per share
3.9p
3.5p (+11.4%)
3.2p (+9.4%)
2.9p (+10.3%) 2.5p
2.65p
(+9.4%) 2.2p
(n/a) 2.0p
1.8p
19.1% 1.65p
16.0%
15.8%
7.8% 1.3p 1.4p
1.1p 1.2p
1.0p
(15.0%)
2015 2016 2017 2018 2019 2015 2016 2017 2018 2019
Final dividend Interim dividend
47Summarised income statement
(Joint ventures proportionately consolidated)
Year to Year to
30 September 30 September
Joint ventures 2019 2018
£m Group and associates Total Total Comments
Revenue 102.1 29.4 131.5 159.2 Residential property sales at Alconbury Weald of £38.1m, at Newark
of £6.7m, at Priors Hall of £4.4m, at RadioStation Rugby of £22.6m
and at Wintringham of £6.3m. Catesby property sales total £33.4m
for the period and U&C commercial sales total £5.0m. Rental and
other property income £4.5m, hotel income of £7.6m, and project
management fees and other income of £2.9m.
Gross profit 21.2 7.2 28.4 29.4 Profits on residential property sales of £9.9m (including JVs), on
commercial property sales of £3.2m and on Catesby sales of £10.1m.
Also included are rental and other property profits of £0.6m, hotel
profits of £1.7m and project management fees of £2.9m.
Administrative expenses (19.9) (0.1) (20.0) (18.8) Stated net of capitalised costs of £5.4m.
IFRS valuation movements 6.7 — 6.7 11.7 Uplift on valuation of Alconbury Weald of £0.7m, Waterbeach of
£5.1m and Priors Hall debtor of £0.9m.
Share of post-tax profit from 8.0 (8.0) — —
joint ventures
Other 0.3 0.9 1.2 — Largely made up of net finance income of £1.2m.
Profit before tax 16.3 — 16.3 22.3
Tax (3.7) — (3.7) (3.6) Current tax and deferred tax movement.
Profit after tax 12.6 — 12.6 18.7
48Summarised balance sheet as at 30 September 2019
At At
30 September 30 September
£m 2019 2018 Comments
Property interests1 586.5 523.8 100% owned £415.7m, through JVs £170.8m.
Cash 27.4 17.1
Borrowings (176.9) (116.2) HE loans £123.9m (£45.2m Alconbury Weald, £9.2m Newark, £37.1m Priors Hall, £19.3m
RadioStation Rugby, £4.3m Wintringham, £8.8m Civic Living), RCF £16.9m, Alconbury Weald
HDC loan £2.0m, Manchester loan £24.1m, grant £1.0m, Deansgate loan £11.2m
(before accounting adjustments).
Deferred tax liability (5.9) (4.1) Deferred tax asset of £2.6m less deferred tax liability of £8.5m.
Working capital (28.1) (31.6)
IFRS net assets 403.0 389.0
EPRA adjustments – property 2,3,4
116.0 85.3 Includes Alconbury Weald £42.3m2, RadioStation Rugby £8.8m3, Priors Hall £14.0m4,
Newark £0.2m5, Catesby sites, £12.9m Wintringham £12.3m6, Waterbeach £19.5m7,
Manchester sites £5.6m, other sites £0.4m.
EPRA adjustments – tax 8.5 6.9 Add back deferred tax liability.
EPRA net assets 527.5 481.2
Alconbury Weald £208.5m , RadioStation Rugby £83.1m , Priors Hall £49.8m , Newark £34.6m5 , Wintringham £15.1m6, Waterbeach £26.5m7, Manchester sites £58.8m, Catesby sites £14.9m, Scottish land
1 2 3 4
sites £4.3m, others £9.6m.
Receivables in relation to properties total £81.3m.
2
Alconbury Weald - EPRA carrying value £286.1m - £208.5m on balance sheet, £42.3m EPRA adjustment and £35.3m debtor re. licence receivables.
3
RadioStation Rugby - EPRA carrying value £113.4m - £83.1m on balance sheet, £8.8m EPRA adjustment and £21.5m debtor re. licence receivables.
4
Priors Hall - EPRA carrying value £68.2m - £49.8m on balance sheet, £14.0m EPRA adjustment and £4.4m debtor re. licence receivables.
5
Newark - EPRA carrying value £47.5m - £34.6m on balance sheet, £0.2m EPRA adjustment and £12.7m debtor re. licence receivables.
6
Wintringham - EPRA carrying value £33.6m - £15.1m on balance sheet, £12.3m EPRA adjustment and £6.2m debtor re. licence receivables.
7
Waterbeach - EPRA carrying value £46.0m - £26.5m on balance sheet and £19.5m EPRA adjustment.
49Property analysis – EPRA valuation movement
At 30 September Valuation Acquisitions At 30 September
£m 2019 movement 1 Expenditure (disposals) 2018 2
Alconbury Weald 250.8 6.5 21.0 (32.2) 255.5
Alconbury Weald minimums and overages 35.3 — — 15.6 19.7
286.1 6.5 21.0 (16.6) 275.2
Newark (82.2% interest) 34.8 0.9 4.2 (7.6) 37.3
Newark minimums 12.7 — — 3.9 8.8
47.5 0.9 4.2 (3.7) 46.1
Priors Hall 63.8 4.6 15.4 (4.7) 48.5
Priors Hall debtor, minimums and overage 4.4 0.9 — (3.0) 6.5
68.2 5.5 15.4 (7.7) 55.0
RadioStation Rugby (50% interest) 91.9 (1.0) 15.9 (10.1) 87.1
RadioStation Rugby minimums (50% interest) 21.5 — — 9.1 12.4
113.4 (1.0) 15.9 (1.0) 99.5
Wintringham (33% interest) 27.4 3.8 5.0 (5.2) 23.8
Wintringham minimums (33% interest) 6.2 — — 6.2 —
33.6 3.8 5.0 1.0 23.8
Waterbeach 46.0 24.6 2.7 — 18.7
Strategic land total 594.8 40.3 64.2 (28.0) 518.3
Manchester New Square (50% interest) 41.9 0.7 21.0 0.1 20.1
Manchester Deansgate 22.5 (0.1) 0.4 (0.3) 22.5
Scottish land sites 4.3 — (0.3) (0.1) 4.7
Other 10.0 (1.0) 2.9 (2.8) 10.9
Commercial total 78.7 (0.4) 24.0 (3.1) 58.2
Catesby 29.0 1.4 2.0 (7.0) 32.6
EPRA valuations 702.5 41.3 90.2 (38.1) 609.1
1
Of the £41.3 million valuation movement, £6.7 million is taken through the income statement, with a further £34.6 million of EPRA adjustments.
50Valuation movement recognised in accounts £m Movement in period Comments Investment property/debtors 6.7 Alconbury Weald up £0.7m, Waterbeach up £5.1m and Priors Hall debtor £0.9m IFRS total 6.7 EPRA adjustments on sites sold (4.7) See property analysis – EPRA adjustments EPRA adjustments on sites retained 39.3 See property analysis – EPRA adjustments EPRA total 34.6 Total valuation adjustments 41.3 51
Property analysis – EPRA adjustments
                                                 At                                                    At
                                       30 September    Movement owing to     Movement in     30 September
£m                                             2019      IFRS 15 adoption        period              2018

Bude                                             —                    —             (0.6)             0.6
Willingdon                                       —                    —              (1.2)            1.2
Europa Way                                       —                    —              (1.2)            1.2
Canningford House                                —                    —              (1.2)            1.2

Sudbury                                          —                    —             (0.5)             0.5

Sites sold                                       —                    —             (4.7)             4.7

Alconbury Weald                                42.3                  (2.3)           5.8             38.8
RadioStation Rugby                              8.8                  (0.8)           (1.0)           10.6
Newark                                          0.2                  (0.8)           0.9              0.1
Wintringham                                    12.3                   —              3.8              8.5
Waterbeach                                     19.5                   —             19.5              —
Priors Hall                                    14.0                   —              4.6              9.4
Manchester sites                                5.6                   —              0.6              5.0
Catesby sites                                  12.9                   —              4.9              8.0
Other                                           0.4                   —              0.2              0.2

Sites retained                                 116.0                 (3.9)          39.3             80.6

Total EPRA adjustments                         116.0                 (3.9)          34.6             85.3

52
Administrative expenses
Year ended Year ended
£m 30 September 2019 30 September 2018
Personnel costs 15.2 14.1
Share-based payment charge 3.9 3.4
Accommodation costs 1.5 1.9
Professional fees 2.1 2.0
Other 2.7 2.1
25.4 23.5
Capitalised to investment properties (0.4) (0.5)
Capitalised to trading properties (5.0) (4.2)
(5.4) (4.7)
Net administration expenses 20.0 18.8
53Bank and other borrowings
(Urban&Civic share)
Commitment Drawn Undrawn
At 30 September 2019 £m £m £m
In place:
Newark – infrastructure loan from Homes England (HE)1 9.2 9.2 —
Priors Hall – infrastructure loan from HE1 48.0 37.1 10.9
Alconbury Weald – infrastructure loan from HE1 47.9 45.2 2.7
Alconbury Weald (Civic Living) – housebuilding loan from HE 1
8.8 8.8 —
RadioStation Rugby – infrastructure loan from HE1 – U&C 50% share 19.3 19.3 —
Wintringham – infrastructure loan from HE1 – U&C 33% share 8.7 4.3 4.4
HE loans1 (gross of £1.3m of loan arrangement costs) 141.9 123.9 18.0
Alconbury Weald – construction loan from Huntingdonshire District Council – 2.5% margin 2.0 2.0 —
Corporate – HSBC RCF – 2.75% – 2.5% margin 40.0 16.9 23.1
Manchester New Square – £51.0m development loan (senior) from Housing Investment Fund1 – 3.23% margin – U&C share 50% 25.5 13.1 12.4
Manchester New Square – £24.6m development loan (mezzanine) from Greater Manchester Pension Fund1 – 7.5% all in – U&C share 50% 12.3 11.0 1.3
Newark – LEP grant 1.0 1.0 —
11.2 11.2 —
Deansgate – bank loan from HSBC – 2.5% margin
Other loans (gross of £0.9m of loan arrangement costs) 233.9 179.1 54.8
Summary:
Joint venture borrowings (RadioStation Rugby, Wintringham and Manchester) 65.8 47.7 18.1
Subsidiary borrowings (gross of £2.2 million of loan arrangement costs) 168.1 131.4 36.7
233.9 179.1 54.8
Summary of borrowings by lender at 30 September 20192:
HE 141.9 123.9 18.0
Other lenders 92.0 55.2 36.8
233.9 179.1 54.8
1
Facility allows rolled-up interest
54
2
Total facilities including share of JVs , HE: £159.3m, other lenders: £129.8m - undrawn HE: £26.8m, other lenders: £50.5mDisclaimer Forward-looking statements This presentation may include certain forward-looking statements, beliefs or opinions, including statements with respect to Urban&Civic plc's business, financial condition and results of operations. These forward-looking statements can be identified by the use of forward-looking terminology, including the terms "believes", "estimates", "plans", "anticipates", "targets", "aims", "continues", "expects", "intends", "hopes", "may", "will", "would", "could" or "should" or, in each case, their negative or other various or comparable terminology. These statements are made by the Urban&Civic plc Directors in good faith based on the information available to them at the date of the 2019 annual results announcement and reflect the Urban&Civic plc Directors' beliefs and expectations. By their nature these statements involve risk and uncertainty because they relate to events and depend on circumstances that may or may not occur in the future. A number of factors could cause actual results and developments to differ materially from those expressed or implied by the forward-looking statements. No representation or warranty is made that any of these statements or forecasts will come to pass or that any forecast results will be achieved. Forward-looking statements speak only as at the date of the 2019 annual results announcement and Urban&Civic plc and its advisers expressly disclaim any obligations or undertaking to release any update of, or revisions to, any forward-looking statements in this presentation. No statement in the presentation is intended to be, or intended to be construed as, a profit forecast or profit estimate and no statement in the presentation should be interpreted to mean that earnings or NAV per Urban&Civic plc share for the current or future financial years will necessarily match or exceed the historical earnings or NAV per Urban&Civic plc share. As a result, you are cautioned not to place any undue reliance on such forward- looking statements. This presentation does not constitute or form part of any offer or invitation to sell or issue, or any solicitation of any offer to purchase or subscribe for any securities. The making of this presentation does not constitute a recommendation regarding any securities. 55
You can also read