Institutional Presentation - July/18 - MZ Group
←
→
Page content transcription
If your browser does not render page correctly, please read the page content below

Institutional Presentation
          July/18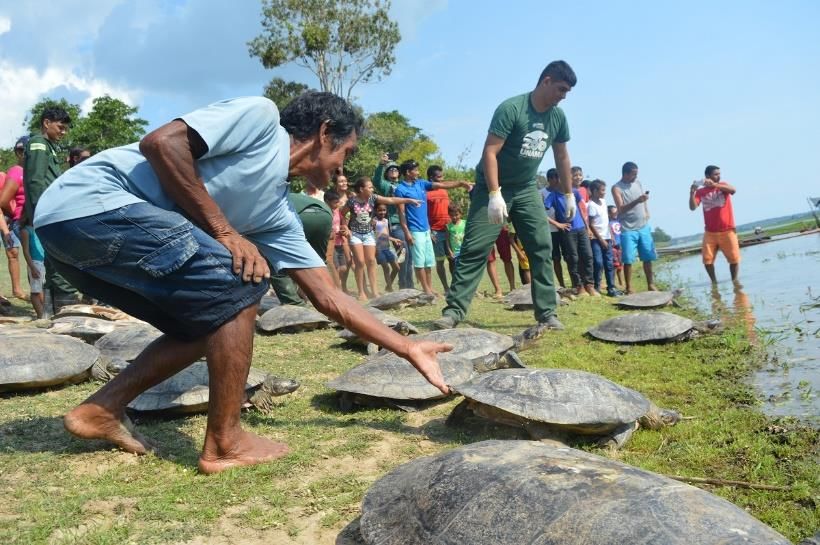
Agenda

Ser Educacional profile
                                                                      1

Brazilian higher education market and Ser Educacional social vision
                                                                      2

Ser’s growth paths
                                                                      3

Operational and financial results
                                                                      4

Action plan 2018
                                                                      5

Attachment
                                                                      6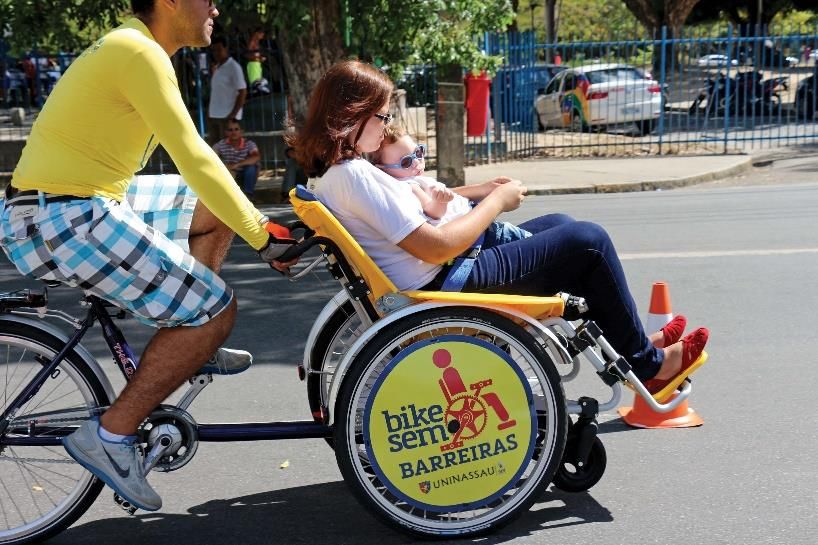
Ser Educacional profile

Ser Educacional Profile
                                                                                                                                     Distribution of the student base (‘000) and regional brands as of 1Q18
          Leader in the higher education market in the North and Northeast regions, areas that
 1        present the highest growth rates of the sector in Brazil                                                                    Region        North                                                  Region       Northeast
                                                                                                                                      Students*       31                                                   Students*        102

          Complete portfolio of courses in the segments of on campus and distance learning                                            % total        21%                                                   % total          68%
 2        (DL), offered through regional brands and high capillarity

          Highly visible paths for growth: selected acquisitions, new on-campus units and DL
 3        expansion

          DNA of innovation and social engagement, recognized by the market and local
 4        Social engagement DNA recognized by the market and local communities
          communities

          Superior value proposition for the student based on teaching quality, advanced
 5        infrastructure and labor market recognition                                                                                             Region           SE/MW/S                                                          1T18

                                                                                                                                                  Students*          18                                   Students                  160

          Company with controlling shareholder (53% of capital), with a solid execution history,                                                  % total           12%                                   On campus graduation*     152
 6        standardization of processes and gain in operational efficiency                                                                                                                                 On campus units            60

                                                                                                                                                                                                          DL units                  190

     Net Revenue                                                                           # of enrollment                                                                   Adjusted EBITDA(1)
     (R$ million)                                                                          (‘000)                                                                            (R$ million)                       354          331
                                                                        1,231                                                                                                                       298
                                                         1,125                                                                             148              152                             248
                                         1,032                                                                                 141
                                                                                                                 128
                           705                                                                      99                                                                              154
           547

           2013           2014           2015            2016           2017                        2013         2014         2015        2016              2017                   2013     2014   2015        2016          2017
 Source: Company. Note:(1) Adjusted EBITDA as reported by the company. * Student on campus graduation and distance learning                                                                                                               4
15 years of consistent development blending organic growth alternatives
and acquisitions

                                                           2003-2007                                                       2008-2013                                                  2014-2018
                                                        Local Player                                                    Reginal Player                                             National Player

                                ◼       2003 – 2007: creation of the first on campus units          ◼   Cartesian Capital Group investment                     ◼    Acquisition of UNAMA (PA), UNG (SP) e University Center
                                                                                                                                                                    in Rio de Janeiro (RJ) and accreditation in Belo Horizonte
                                    ▪   UNINASSAU do Recife (PE)                                    ◼   Presence in all northeastern state capitals
                                                                                                                                                                    (MG), Fortaleza (CE), Olinda (PE), Parnamirim (RN) e São
                                                                                                        through organic growth and acquisitions
                                    ▪   UNINASSAU João Pessoa (PB)                                                                                                  Lourenço da Mata (PE)
     Mainl Developments

                                                                                                    ◼   Presence in the largest cities in the North
                                    ▪   UNINASSAU Campina Grande (PB)                                                                                          ◼    37 new accreditation of on campus units
                                                                                                        through acquisitions: Belém and Manaus
                                    ▪   UNINABUCO Paulista (PE)                                                                                                ◼    Launch of 190 DL centers throughout Brazil
                                                                                                    ◼   IPO on the B3 Novo Mercado
                                                                                                                                                                    (regulatory march from jul./17)

                                                                                                                                                               ◼    UNIVERITAS brand released for operations in Southeast ,
                                                                                                                                                                    South and Mid-West.

                                                                                                                                                               ◼    Capital increase R$393mm in Nov/17
Student Base Evolution (‘000)

                                                                                                                                                                                                       152            160
                                                                                                                                                                          141            148
                                                                                                                                                             129
                                                                                                                                                      99
                                                                                                                                          57
                                                                                                           33             41
                                                                                   23        25
                                    0.5              8.4            13
                                    2003            2006           2007          2008        2009         2010           2011           2012          2013   2014        2015           2016          2017           1T18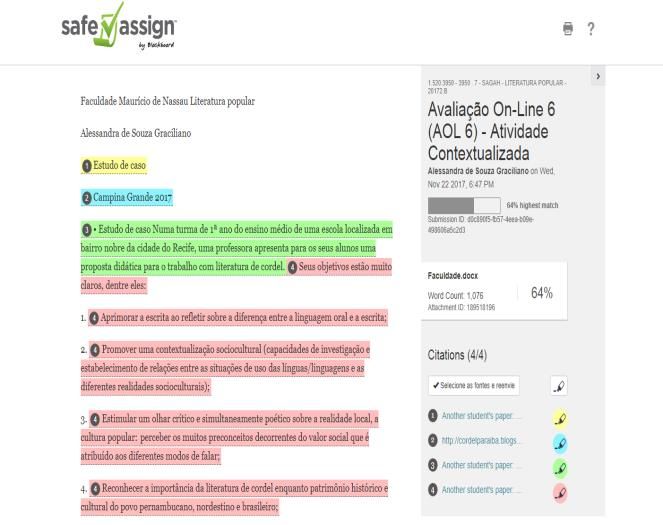
Consistent results since IPO

                                           @ IPO (2Q13)                   Today (1Q18)

                                          Focus on North and                                  Focus on
                Regions                                                    National
                                           Northeast regions                               regional brands

                # of students                  76 K                          160 K             ~2x more

                # of on campus units in
                                              23 units                      60 units           ~3x more
                operation

                                                                                         400 in operation until
                # DL centers                   zero                       190 centers
                                                                                                 2019

                Net revenue LTM1            R$ 368 mm                    R$ 1.240 mm           ~3x more

                EBITDA LTM1                 R$ 126 mm                     R$ 297 mm            ~3x more

                EBITDA UTM1 / Student      R$ 1.650/year                 R$ 1.860/year      Efficiency gain

                                          Consistent value generation since IPO
                                                                                                                  6
1   LTM: Last twelve months
Brazilian higher education
      market and Ser
Educacional social vision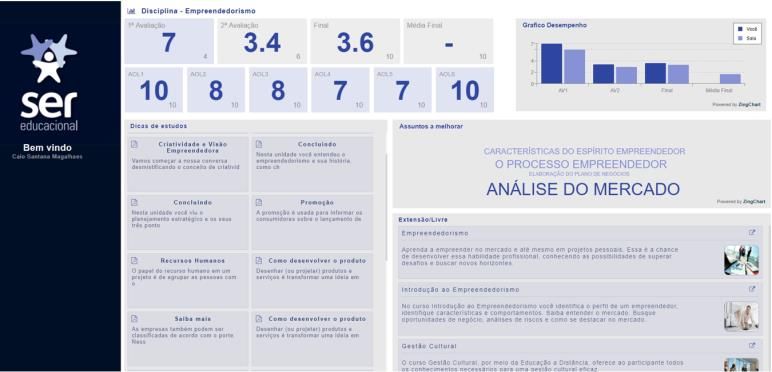
Relevant addressable market that generates value to students
Addressable market analysis Higher education proves to be valuable to the student
Brazilian Addressable Market analysis (in mm habitants) - 2016 Average compensation Unemployed by educational level
by education level
~ 35 R$/Month, 2Q16, 25-34 years Undergraduate
Levers to penetrate the 6.2%
addressable market
Basic
1.Interiorization of on campus No
education Education
High- 20.3%
School High School
2.DL and hybrid learning expansion
25.5%
8 8 3.Private / Public financing Undergrad
20%
uate
0 1 2 3 Basic 34.0%
Student base of the 18-39 years
sector completed high school Source: IBGE/PNAD and JP Morgan Source: IBGE Fev/18
Source: IBGE, INEP e Ser Educacional estimates
Challenging economic scenario over the last years
Market Share top 10 CAGR Student base per High School x Brazilian unemployment Year-over-year GDP growth
players region (2011 – 2016) Undergraduation (million of habitants)
(total of 2,4 k players) Graduations
(million of students) 12 12
5%
46% 5%
Undergraduate
9 3.0%
High -School
2.0
36% 4% 1.9% 1.0%
3%
1.8
3% 3% 7 0.5%
6 6
1.2
1.1
-3.5% -3.5%
2011 2016
N
S
BR
NE
SE
MW
2012 2013 2014 2015 2016 2017 2012 2013 2014 2015 2016 2017
2 0 11 2016
Source: INEP/Santander Source: INEP / Ser Educacional Source: INEP Source: IBGE Source: IBGE
Ser Educacional has created a virtuous cycle of generating social value in
    the cities since its foundation
             Virtuous cycle of generating value through social activities                                                                                         Highly recognized regional brands
                                                                                                                                                     Brand recognition1                                  Spontaneous media generation

                                                                                                                                                    UNINASSAU: most recognized                           News generated by spontaneous
                                                                                                                                                    brand of higher education in                                 media2 (‘000)
                          Initiatives                                              Students and                                                     the Northeast region (may/18)
                          portfolio:                                               Teachers engaged
               ▪   Workability                                                     and benefits in the                                                        1   Belém Teresina     2
               ▪   Environment                                                     cities
               ▪   Health                                                                                                                                                                                                         18.4
               ▪   Social                                                                                                                                                          Fortaleza 2                  13.8
               ▪   Sport
                                                                                                                                                                                         Natal   4
               ▪   Education
                                                                                                                                                                                     João        2              2016              2017
                                                                                                                                                                                   Pessoa

                                                                                                                                                                                     Recife      1   ◼   Frequently present in the most relevant
                                                                                                                                                North                                                    communication vehicles in each market
                                                                                                                                                Northeast                           Maceió       2   ◼   Spontaneous and positive exposure of
                                                                                                                                                Southeast                                                the brand in diversified segments of
                                                                                                                                                                                                         society
                       Greater recognition                                       Spontaneous media                                                                 1   Guarulhos
                       of the brands                                             generation
                                                                                                                                                                           International case study

                                                                                                                                                                       ◼    International case study on efficiency in the generation of
                                                                                                                                                                            education at affordable prices, with financial returns and
                                                                                                                                                                            education as a tool for social mobility

                                                                                                                                                                       ◼    Publication: October 2017 (click on the logo to download)
1 Research and brand recognition by city are according to the Company’s internal research, while research related to the Northeast region was
a partnership between Troiano Branding and O Estado de São Paulo newspaper published in May 2018
2 Number of online and printed publications, measure disregards radio and TV .                                                                                                                                                                     9
Diversified portfolio of activities ensures the systematic movement of the
virtuous cycle of generating social value
           Social projects                                                          Environment
Over 20 social projects spreading out
knowledge, promoting social dialogue
and inclusion
                                                                                                                        +4,000 wild animals
Highlights projects
                                                                                                                        rescued in 10 years
▪ Productive Mothers
▪ Social Cirque
                                                                                                                        ZooUNAMA        works   on    the
▪ Beach without barriers
                                                                                                                        recovery of animals and the
▪ Bike without barriers                                                                                                 reinsertion of the species in the
▪ College in community                                                                                                  Amazon Forest
▪ Bullying: finalist campaign in
  Cannes (click here to watch video)                                                                                                      Source: Ser Educacional

           Healthcare                                                               Sports

                                         83,000 healthcare                                                    52
                                                                                               42    42
                                        assistances in 2017                   40
                                                                                      37
                                Students under supervision work in pro bono
                                   healthcare programs in various fields:                                    504
                                                                              360    368      362    423
                                ▪   Medical Care   ▪ Physiotherapy
                                ▪   Dentistry      ▪ Phonoaudiology
                                ▪   Nutrition      ▪ Nursing
                                ▪   Psychology                                2013 2014 2015 2016 2017
                                                                                Sponsored students    Titles achieved
Source: Ser Educacional                                                                                                                   Source: Ser Educacional

                                                                                                                                                              10
Higher education treated as a social mobility tool
Workability: supporting income generation Education: quality of education for all
Career Center Services Career Portal Unique educational methodology with integrated curricular matrix that allows a
comparison of performance between units through the collegiate test
Academic PDCA Development
Partnerships with ▪ Pedagogical project ▪ Pedagogical
companies ▪ Curricular Matrix support
▪ Teaching plans ▪ Electronic
▪ ISO9001 P D diary Training of Academic
▪ Ratting teachers performance per
Advertisement of unit
▪ Leveling ▪ Academic
vacancies course audit
Selective processes ▪ Workshop
A C ▪ Collegiate
for partner test
Jobs Offered Partner Companies ▪ Action plan ▪ Check list
Pedagogical Wheel of
companies week masters
26.1
Actions for 9.1
graduates Focus on students and society development: +20 multidisciplinary congresses per year
and free summer courses at the Company's main campuses
Professional 8.1
2.4
counseling
research
2016 2017 2016 2017
Shows
employability
◼ 100% of the courses have the entrepreneurship
Vacancy portal chair
and career
blog ◼ +4 thousand assistance per year in legal practice
centers
Career plan and
CV writing advice ◼ Startups IncubatorSer’s growth avenues
Well-defined growth paths focused on generating sustainable value for
shareholders

 Growth paths/ Strategic
        rational
                                      1   On campus                            2   Distance Learning                       3   Acquisitions

                                  ▪   Ramp-up of 14 units                  ▪   New DL regulation as of July/17         ▪   Focus on traditional institutions
                                                                                                                           with a strong and recognized
                                  ▪   +5 new units in 2019                 ▪   190 DL centers opened in the last           brands
    Geographic expansion                                                       12 months                               ▪   Preference for universities,
                                  ▪   Aprox +10 units / year from 2020
                                                                                                                           university centers with portfolio of
                                                                           ▪   400 operating DL centers up to              courses in healthcare and
                                                                               4Q19                                        engineering

                                                                                                                       ▪   Regional expansion through new
                                  ▪   New units in cities with less then   ▪   Extensive portfolio of courses in the
                                                                                                                           on campus units and DL
                                      200 thousand habitants and micro         100% online model
         Capillarity                                                                                                       expansion
                                      regions with 400 thousand            ▪   Network of own centers and partner
                                      inhabitants                                                                 ▪        Extraction of commercial
                                                                               centers
                                                                                                                           synergies

                                  ▪   Curricular Matrix and Shared                                                     ▪   Solid cash position
                                                                           ▪   New Platform and state-of-art
                                      Services Center 100% integrated                                                  ▪   Positive track record in integration
                                                                               technology
   Competitive advantages             in all brands                                                                        of recent acquisitions
                                                                           ▪   New entrant with recognized
                                  ▪   Regional brands recognized by                                                    ▪   "Plug and play" backoffice and
                                                                               regional brands
                                      professional market                                                                  academic model

               Strategic Objective : Be dominant in the Northeast and North regions and relevant in other regions of the country                                  13
Ser's business model is designed to offer a superior value proposition to
students
/
Location
Professional placement /
Infrastructure Academic quality
Career development
◼ Location is a key factor influencing the ◼ Facilities designed to provide the best ◼ The best academic quality consistent ◼ Frequent analysis of courses offered to
choice of a higher education course student experience possible with the need and perceived value of meet the demand of the labor market
the student ◼ Extracurricular activities designed to
◼ Units strategically located close to ◼ Facilities recognized by MEC and local ◼ UNAMA: The best Private facilitate the access of graduates to the
students' work and public transportation communities University in the North in best available jobs
hubs 2016 and 2017 ◼ Core of employability and careers
◼ 1st Company listed to hold 2 Maximum
University Centers with CI(3) 5 5
(UNINASSAU Recife and Concept
UNIVERITAS Rio de Janeiro)
Quality metric(2016)
CPC(1) IGC(2)
Strong portfolio of brands anchored in an unbeatable value proposition for the student
Note: (1) Program-level, performed by Ministry of education (MEC). (2) Unit-based assessment, performed by MEC to evaluate quality of the programs offered. (3) Institutional Concept, used to evaluate the quality of the institution's facilities, faculty and teaching program.
14Regional and targeted brands for specific market segments
Market segments Regions of operation Brand positioning
Premium / Balanced
North Northeast Education that shapes winners
High academic level,
usually focusing on
Elite specific areas
Premium / Elite
Academic highlight,
recognition in different Tradition in forming the best
Premium areas and high average
ticket
Mass / Balanced
Institutions with intermediate
Balance recognition and ticket
Mid-west Education for social mobility
Institutions with aggressive Southeast
price and discount policies.
Balanced / Premium
Mass Students searching for the
lowest price
South Education transforms the future
15Focus on standardization, monitoring and control of processes that lead to
greater scalability and profitability
Student attraction
▪ Business Intelligence for recruitment
▪ Pricing (student discounts / financing)
1 ▪ Social marketing
▪ New courses, units and products (DL 100% online and hybrid)
Student retention
▪ Ser Retention System (SRS): statistical analysis of big data to predict and prevent student evasion
2 ▪ Customer service mentality: aims at the maximum satisfaction of the students
Academic Results
▪ Ser’s Academic Management System (SIGAS): backbone for academic quality assurance:
3 academic audit, benchmarking, evaluation, etc.
▪ ISO 9001certificate
4 Operational efficiency
▪ Shared Services Center (CSC): centralization of key financial and administrative processes, allowing greater profitability
and quality control
▪ Student Relationship Center (CRA): academic and interface processes with students conducted digitally, allowing cost
reduction
5
Financial results
▪ Consistent track record of generating return to shareholders
▪ Focus on generating long-term results
16Organic growth plan status
Organic on campus growth
Units opened in the last
Units in operation Accreditation status of new units
12 months per region
Accreditation status obtained Total
MW
60 60 6% New accreditations in operation 17
SE
46 13% Accreditation obtained in operationalization 20
42
31 Total accreditations obtained since the IPO 37
24 Accreditations in progress in the MEC 8
N
NE 19%
Total expansion Plan Accreditation 45
62%
▪ New regulation of autonomy for universities, colleges and
2013 2014 2015 2016 2017 1Q18 universities
Organic distance learning growth
DL centers in operation DL centers opened in the last 12 Status of DL accredited University Centers
months per region
190
Authorized
MW Units CI DL*
poles/year
7%
119 UNINASSAU Recife 4 150
NE SE
UNINASSAU Maceió 4 150
41% 28%
UNIVERITAS/UNG Guarulhos 5 250
9 9 15 UNAMA Belém 5 250
0
S Total DL centers authorized per year 800
2013 2014 2015 2016 2017 1Q18 N 8%
16% *CI = Institutional conceptDistance learning platform fully prepared to support the growth plan
Integration of all distance learning support activities
Premium DL platform
into a single location
Additional marginal investments to support platform Active teaching methodologies, reverse
growth classroom and broadcast live lessons
Consolidating content production, maximizing cost Ability to quickly integrate future acquisitions
efficiency with reduced additional investments
DL platform with the most modern pedagogic techniques and cutting-edge teaching technology
Enhanced reality Safe Assign System Artificial intelligence
▪ Introduction of SOFIA (artificial
Intelligence software) in the
course of entrepreneurship in
2018
▪ Answer questions about
academic content 24hx7
▪ Comparison of grades between
students and automatic
suggestion of contents for
learning improvement
Free Office 365 for students and teachers
Download app:
Sagah Avaliação Nutricional
18Ser’s Digital Project: engaging digital transformation objectives aiming long-
term value creation
Partnership with Accenture to improve the students' learning experience in all 4 dimensions approach
stages of the learning process and contact with the Company's teaching institutions
24 moths
STUDENTS,
TEACHERS AND
Mapping and Drawing of the Implementation Digital journey
11 EMPLOYEES
diagnosis future Plan implementation EXPERIENCE
INNOVATION
1
3
Technological solutions construction that support the new digital reality
Improvement of students experience, employees and teachers
21
ORGANIZATIONAL
TECHNOLOGY 41 CULTURE
Adapting existing digital culture
IMPACT
Remodeling the corporate innovation environment
Adjustment of technologies and IT model
19Significant growth through acquisitions
Value Students Current focus on acquisitions
Year City Region
R$ MM ('000)
2007 Campina Grande (PB) NE 2.3 -
Recognized Students base in heath Universities or
2008 Maceió (AL) NE 10.0 1.0 University
regional brands and engineer courses
Centers
2008 Natal (RN) NE 5.0 0.7
2011 Belém (PA) N 2.0 0.1 Positive quality Strategic geographical
double turnaround
concepts location
potential
2012 Aracaju (SE) NE 1.0 -
Case Study UNAMA
Double Turnaround Case
2013 Teresina e Parnaíba (PI) NE 29.8 3.7
▪ Expansion of student base and net
revenue
2014 Belém e Santarém (PA) N 151.0 12.6 ▪ EBITDA margin growth
▪ Use of the regional brand for new
Macapá
Boa units and DL expansion
2015 Guarulhos (SP) N 199.0 18.3 Vista
Belém
Net revenue R$MM
Santarém
2015 Rio de Janeiro (RJ) SE 10.0 - Marabá
210.2
Porto
2015 Parnamirim (RN) e Fortaleza (CE) NE 6.0 0.4 Rio Velho 109.3
Branco Palmas
UNAMA- units accredited after the
2016 Belo Horizonte (MG) SE 0.2 0 acquisition
2014 2017 20Operational and financial
resultsStudent base evolution
Total student base ('000) Undergraduate student base ('000)
Total FIES
131 134 136
124
160 101
152 70
148
141
128 2013 2014 2015 2016 2017 1Q18
DL student base (Graduation and Post Graduation) ('000)
18
99
11
7
2 3
40% 40% 0
38% 37%
2013 2014 2015 2016 2017 1Q18
32%
28%
Vocational and post-graduation student base
29
25
13
9
7 6
2013 2014 2015 2016 2017 1Q18
2013 2014 2015 2016 2017 1Q18Financial performance
Net revenue (R$MM) Adjusted EBITDA (R$MM) Adjusted Net Income(R$ MM)
e Adjusted EBITDA Margin(%) e Net Margin Adjusted(%)
1,231
1,125
1,032
705 354
331
298
248
248 220 217
457
197
309 317 154 36%
119
112 24%
34% 35% 83
32%
78 63
26% 27% 31%
26% 27%
22% 20%
19% 18%
2013 2014 2015 2016 2017 1Q17 1Q18 2013 2014 2015 2016 2017 1Q17 1Q18 2013 2014 2015 2016 2017 1Q17 1Q18
23Net debt, cash position and capital expenditures
Cash and equivalentes (R$MM) e Net Cash (debt)(R$MM) e CAPEX ex-acquisitions (R$MM) e
% net revenue (LTM) in cash Net Cash (debt) / EBITDA CAPEX / Net revenue (%)
0.1 0.9 0.3
74% 69% -1.1 -1.4 -1.4
66%
161
36%
27%
19%
452 427
110
102
99
174
81
912 -37
857 -118
-280
22% 23%
400
26
301 283 10% 9% 8%
7%
137
2013 2014 2015 2016 2017 1Q18 2013 2014 2015 2016 2017 1Q18 2013 2014 2015 2016 2017 1Q18Action plan 2018
Key factors that have impacted recent performance and subsidize the
resumption of the original long-term growth plan

           Strong growth in new accreditations in the last 18 months
    1          - 29 new on campus units
               - Authorization to start operations up to 800 DL centers per year

           Acceleration of the expansion plan as of 2017
    2          - Discretionary increase in the structure of expenses and costs in order to accelerate the growth
               provided by the accreditations obtained

           Challenging market environment in 2018
    3           - Reduction of the number of vacancies filled by FIES
               - Resumption of the economy at a slower pace than expected in the regions where the Company operates

           Focus on the original long-term plan
               - Reordering the opening of new units per year and reaching 400 DL centers by 2019-2020
    4
               - Focus on our cost and expense control DNA
               - Keep the Company prepared to adjust the growth pace according to market development                  13
Roadmap for implementing the 2018 action plan
Phase 1 Phase 2 Phase 3
Structure Adjustment Operational Baseline Reorder Growth
▪ Optimization of the administrative structure ▪ Reassessment of all existing courses and Step 1
aiming to adjust the necessary structure in units to adapt costs and expenses to the ▪ Unification of the NABUCO and NASSAU
relation to the current student base Company's operating standards: brands in state capitals in Northeast region
outside the metropolitan region of Recife
▪ Utilization of short-term operational - Optimization of physical and ▪ Reordering of the opening certain accredited
performance improvement opportunities administrative structures units that requires better course mix
(healthcare and engineering courses) before
- Maximization of teaching and
launching
administrative staff
- Optimization of classes in the current
Step 2
curricula
▪ Further review and analysis in selected
- Focus on continuous improvement of markets
academic quality
▪ Reorder the new openings pipeline of already
accredited units
Concluded in April/18 To be concluded in June/18 Step 1: April/18 Step 2: August/18
14Current status of the 2018 action plan
Opportunity to reduce costs and expenses phases 1 and 2 Reordering the opening of units
Entradas 2017 Opened in 2018.1 (+3)
Total potential for cost and expense reduction over the 2018 budget Rio de Janeiro (RJ)** Arapiraca (AL)
running between April-December / 18: ~R$ 80 million * Olinda (PE) Marabá (PA)
Fortaleza (CE) 2017.1 (+4) Belo Horizonte (MG)**
João Pessoa (PB)
Ananindeua (PA) Closed in 2018.1 (-3)
Accreditations of São Paulo (SP) UNG
courses and units Garanhuns (PE)
Juazeiro (BA) Maceió (AL) Nabuco
16%
Mossoró (CE) João Pessoa (PB) Nabuco
Sobral (CE)
Personnel and Boa Vista (RR) 2017.2 (+10)
outsourced
Porto Velho (RO)
services (cost and
expenses) Rio Branco (AC)
43% Anápolis (GO)
Maracanaú (CE)
Marketing
25%
+14 +3 / - 3
60 60
Others 46
3% Rent and
upkeeping
13%
2016.2 2017.2 2018.1
* This is not a projection or estimate ** License acquisitions 15Individual status of all accredited units as of 1Q18
Year Region City Brand Status
NE Feira de Santana (BA) NASSAU Open 2016.1
Status of the accreditations Total
2015
NE Olinda (PE) NASSAU Reordered
4 NE Jaboatão dos Guararapes (PE) NASSAU Open 2016.1 Open 17
NE Petrolina (PE) NASSAU Open 2016.1
NE Cabo de Santo Agostinho (PE) NASSAU Open 2016.2 Unified with existing NASSAU units in the same city 4
2016
NE João Pessoa (PB) NABUCO Unified
4 NE Jaboatão dos Guararapes (PE) NABUCO Reordered
Reordered 16
NE Maceió (AL) NABUCO Unified
N Boa Vista (RR) UNAMA Open 2017.2
N Porto Velho (RO) UNAMA Open 2017.2 Total 37
N Rio Branco (AC) UNAMA Open 2017.2
NE Fortaleza (CE) NASSAU Open 2017.1
N Marabá (PA) UNAMA Open 2018.1
NE Garanhuns (PE) NASSAU Open 2017.2
▪ Reordered accreditations are scheduled to be opened in the next 2-3
NE Maracanaú (CE) NASSAU Open 2017.2 years
NE Ananindeua (PA) NASSAU Open 2017.2
CO Anápolis (GO) UNIVERITAS Open 2017.2 ▪ 8 new accreditations in process with the MEC to materialize the plan to
‘0
NE Juazeiro do Norte (CE) NASSAU Open 2017.2
open 45 units
NE Sobral (CE) NASSAU Open 2017.2
NE Mossoró (RN) NASSAU Open 2017.2
▪ The four unified accreditations will be replaced by new accreditations
2017
NE Natal (RN) NABUCO Unified
26 CO Brasilia (DF) UNIVERITAS Reordered already in process:
NE Arapiraca (AL) NASSAU Open 2018.1
CO Campo Grande (MS) NASSAU Reordered ▪ New regulation of autonomy for universities, colleges and
NO Macapá (AP) UNAMA Reordered
CO Cuiabá (MT) UNIVERITAS Reordered
universities
S Porto Alegre (RS) UNIVERITAS Reordered
SE Vitória (ES) UNIVERITAS Reordered ▪ There are additional accreditations requested in 2017 and 2018
CO Goiânia (GO) UNIVERITAS Reordered that will support the growth of long-term units
N Belém NABUCO Reordered
N Palmas (TO) UNAMA Reordered
NE Salvador (BA) NABUCO Unified
▪ There are no significant changes in the EAD development plan
S Curitiba (PR) UNIVERITAS Reordered
S Joinville (SC) UNIVERITAS Reordered
NE Patos (PB) NASSAU Reordered
2018
3 NE
SE
Imperatriz (MA)
Campinas (SP)
NASSAU
UNIVERITAS
Reordered
ReorderedSer Educacional has relevant levers for growth sustainable
operating margins
Consolidated Adjusted EBITDA margin On Campus Students
and excluding new units and DL per Teacher ▪ Reduction of impact in results
by reordering the opening and
Reordering the number of new 32.1% maturation of new units
units per year 30.0
29.4
▪ Opportunity to improve the
adjusted EBITDA margin of
24.7% legacy operations through the
27.5
2018 action plan
Operational optimization of
existing units ▪ Opportunity to enhance
1Q18 1Q16 1Q17 1Q18 students / class rate in the
Adjusted EBITDA ex- new units and DL second semester
Adjusted EBITDA
Distance Learning Gross Margin
58.6% ▪ DL initiating operating
57.6%
leverage by increasing gross
DL to start contributing to margin while structure of
consolidated results costs and fixed expenses was
already mostly created in
2017
1Q17 1Q18
New accreditations already ▪ Reduction of the 2018 budget for new unit accreditations for the coming years as the Company
reached advanced developments obtained a significant volume of new accreditations and the new regulation allows autonomy for
universities to expand within their states of origin
17Attachments
Brazilian Scenario – Student Profile
         Undergraduation Student base Evolution in 2016 (mm students)                                                PROUNI Student base Evolution (mm student)
               On campus Private         On campus Public          DL Private          DL Public

                                                                7,8             8,0           8,1
                                                 7,3                                          0.1
                      6,7          7,0                          0.1             0.1
         6,4                                     0.2                            1.3           1.4
                                   0.2                          1.2
         0.2          0.2          0.9           1.0                                                                                          0.5                     0.5         0.5
         0.8          0.8
                                                                1.8             1.8           1.9                      0.4        0.4                     0.4
                      1.6          1.7           1.8
         1.5
                                                                                                         0.3

                      4.2          4.2           4.4            4.7             4.8           4.7
         4.0

       2010          2011          2012         2013            2014            2015         2016      2010           2011       2012        2013        2014        2015        2016
Source: INEP
                                                                                                      Source: INEP
               Student per region in 2016 (mm student % of total)                                                         Current FIES contracts base evolution

                                              Mid-west
                                   South                                                                   Total contracts
                                                 0.8                                                                                                                            2.4
                                    1.3                                                                    Student base
                                                10%                                                                                                                 2.2
                                   16%
                                                       Northeast                                                                                        1.8
                                                          1.7
                                                         21%                                                                                                  1.3         1.3         1.2
                                                                                                                                            1.1
                                                                                                                                                  0.8
                                                                                                                                0.6
                             Southeast                  North                                                                         0.4
                                3.6                      0.7                                          0.2 0.2        0.3 0.2
                               44%                       9%
                                                                                                       2010          2011       2012        2013        2014        2015        2016
Source: INEP                                                                                        Source: INEP
Glossary
▪ EBITDA : Earnings before Interest, Taxes, Depreciation and Amortization.. It is a way of measuring the financial health of a company by taking into account only what the company
can generate from revenue, without taking into account the financial effects or the tax abatement of any nature.
▪ IGC: Unit-based assessment, performed by MEC to evaluate quality of the programs offered.
▪ CPC: Program-level, performed by Ministry of education ( MEC)
▪ FIES : Is a program of Ministry of Education (MEC) which finances courses in private sector , helping students to enter in college
▪ Ex-FIES: students that pay tuitions out of pockets
▪ IBGE: Brazilian Institute of Geography and Statistics, is the main provider of data and information in the country.
▪ INEP: National Institute of Educational Study and Research. Its mission is to subsidize the formulation of educational policies of the different levels of government in order to
contribute to the economic and social development of the country.
▪ CI: Institutional Concept, at each evaluation cycle, the educational institution is evaluated on the spot, it is composed of self-assessment or internal evaluation (coordinated by each
institution's own evaluation committee) and by the external evaluation carried out by the committees designated by Inep
▪ CAGR (Compound Annual Growth Rate): is an average growth rate for several years. It is a geometric mean of annual growth rates
▪ ISO9001: Standard that certifies the Quality Management Systems and defines the requirements for the implementation of the system. This document has standardization tools, it is
a safe model for the implementation of Quality Management.
▪ PDCA ( Plan Do Check Act ) : is an interactive four-step management method used for the continuous control and improvement of processes and products
▪ PROUNI : Program University for All made by MEC, which grants scholarships in private institutions of higher education, in undergraduate and sequential courses of specific training,
to Brazilian students without a diploma of higher level.
▪ Collegiate Test: Student evaluation model prepared by the Company, made jointly by the teachers and finalized by a group of validating teachers.Disclaimer
This material reflects management’s expectations and may contain estimates related to future events. Any information. data. forecasts or future plans
herein refer to estimates. and therefore cannot be taken as concrete evidence or a promise to the market. Ser Educacional is not responsible for
investment operations or decisions taken based on the information herein. These estimates are subject to change without prior notice.
This material has been prepared by Ser Educacional S.A. (“Ser Educacional" or the “Company”) in accordance with the highest national and
international standards and includes certain forward-looking statements that are primarily based on Ser Educacional’s current expectations and
projections of future events and financial trends that currently affect or may affect the Company’s business. and therefore they are not guarantees of
future performance. They are based on management’s expectations and involve a number of risks and uncertainties that could lead the Company’s
financial situation and operating results to differ materially from those expressed in said forward-looking statements. Ser Educacional assumes no
obligation to publicly update or revise any forward-looking statements.
This material is disclosed solely for information purposes and should not be construed as a request or an offer to buy or sell any shares or related
financial instruments. Accordingly. this presentation is not a recommendation of investment and should not be considered as such. It is not related to
the specific investment objectives. financial situation or particular needs of any recipient. neither does it make a statement or provide a guarantee.
either expressly or implicitly. related to the accuracy. completeness or reliability of the information herein. This presentation should not be regarded
as a substitute to the recipients’ judgment. Any opinion expressed herein is subject to change without prior notice and Ser Educacional does not
assume the obligation to update or revise them.
34QUALITY EDUCATION FOR YOU TO WIN CONTACTS: Jânyo Diniz, CEO | João Aguiar, CFO Rodrigo Alves, IRO | Geraldo Soares, IRM Phone: +55 (11) 2769-3223 E-mail: ri@sereducacional.com Website: www.sereducacional.com/ir
You can also read