EN - Rapid case review Allocation of Cohesion policy funding to Member States for 2021-2027
←
→
Page content transcription
If your browser does not render page correctly, please read the page content below
EN

Rapid case review
Allocation of
Cohesion policy
funding to Member
States for 2021-2027

March 2019
2

Contents
                                                           Paragraph

Glossary

Executive Summary                                               I-VII

Introduction                                                   01-02

Allocation principles and overview of process                  03-10
Allocation principles                                          03-06
Overview of process                                            07-10

Initial allocation to Member States                            11-24
Allocation for Investment for Jobs and Growth goal             11-17
Less developed regions                                         12-13
Transition regions                                             14-15
More developed regions                                         16-17
Allocation for the European Territorial Cooperation goal       18-19
Allocation for the Cohesion Fund                               20-23
Financial weight of the allocation criteria                       24

Adjustments to initial allocation                              25-37
Caps and safety nets                                           26-30
Caps                                                              27
Safety nets                                                    28-29
Exemptions                                                        30
Additional adjustments                                         31-33
Final allocations                                              34-37

Final remarks and next steps                                   38-40

Annexes
3

Annex I — Evolution of the allocation criteria over the last three
programme periods
Annex II — Framework for initial allocation of Cohesion policy
funds to Member States
Annex III — Allocation method for less developed regions for 2021-
2027
Annex IV — Allocation method for transition regions for 2021-2027
Annex V — Allocation method for more developed regions for
2021-2027
Annex VI — Allocation method for the European territorial
cooperation goal (ETC) for 2021-2027
Annex VII — Allocation method for the Cohesion Fund for 2021-
2027
Annex VIII — Caps and safety nets
Annex IX — Criteria for ESF+ allocation adjustments
Annex X — Regional classifications for ERDF/ESF+

ECA Team

4

Glossary
AROPE rate refers to the percentage of the people who are ‘At-risk-of poverty or
social exclusion‘.

Berlin Method: A methodology, devised in 1999, for allocating cohesion funds
based on regional and national prosperity and unemployment. Although remaining
consistent in focus, the method’s criteria have evolved with each programming period
to reflect new challenges and policy objectives.

Cohesion Fund (CF): An EU fund for reducing economic and social disparities in the
EU by funding investments in Member States where the gross national income per
inhabitant is less than 90 % of the EU average.

Cohesion policy: The EU’s main investment policy, which aims to reduce economic
and social disparities between regions and Member States through promoting job
creation, business competitiveness, economic growth, sustainable development, and
cross-border and interregional cooperation. It is financed through the European
Regional Development Fund (ERDF), the European Social Fund Plus (ESF+) and the
Cohesion Fund (CF).

Common provisions regulation (CPR): EU regulation governing a number of
shared management funds. For 2014-2020, this is Regulation (EU) No 1303/2013 of the
European Parliament and of the Council. For 2021-2027 there is a Commission
proposal, published in May 2018, for rules that will govern seven funds: the European
Regional Development Fund, the Cohesion Fund, the European Social Fund Plus, the
European Maritime and Fisheries Fund, the Asylum and Migration Fund, the Internal
Security Fund, and the Border Management and Visa Instrument.

Connecting Europe Facility (CEF): An instrument identifying investment priorities
and providing financial aid to the energy, transport and information and
communication technology sectors for the creation of high performance, sustainable
and interconnected infrastructure. It is managed directly by the Commission.

DG REGIO: Directorate-General for Regional and Urban Policy

European Regional Development Fund (ERDF): A fund aiming to strengthen
economic and social cohesion throughout the European Union by correcting regional
imbalances through financial support for priority areas: innovation and research; the
digital agenda; small and medium-sized enterprises and the low carbon economy.

5

European Social Fund Plus (ESF+): An EU fund under the 2021-2027 budgetary
period for creating educational and employment opportunities and improving the
situation of people at risk of poverty. Unlike its predecessor the European Social Fund,
ESF+ encompasses the Youth Employment Initiative and the Fund for European Aid to
the Most Deprived.

European Territorial Cooperation (ETC): A framework for interregional, cross-
border and transnational cooperation, guiding policy exchanges and the
implementation of joint action. It is financed by ERDF.

Europe 2020 Strategy: The European Union’s ten-year strategy, launched in 2010,
to boost growth and create jobs.

Fund for European Aid to the Most Deprived (FEAD): An instrument seeking
to help the poorest members of society through combining food aid and basic material
assistance with long-term social inclusion measures designed to bring them out of
poverty.

Gross domestic product (GDP): A standard measure of a country's wealth: the
monetary value of all the goods and services produced in a specific period within the
economy.

Gross national income (GNI): A standard measure of a country's wealth, based on
income from domestic sources and abroad.

Less developed region (LDR): A region where the GDP per capita is below 75 % of
the EU average.

Multiannual Financial Framework (MFF): The EU's spending plan setting
priorities (based on policy objectives) and ceilings, generally for seven years. It
provides the structure within which annual EU budgets are set, limiting spending for
each category of expenditure. The current MFF covers 2014-2020.

More developed region (MDR): A region where the GDP per capita exceeds 90 %
(2014-2020) or 100 % (2021-2027) of the EU average.

NEET rate refers to the percentage of people who are ‘neither in employment,
education or training’. It includes both unemployed and inactive people.

Northern sparsely populated (NSP) regions: The regions of northernmost
Sweden and northernmost and eastern Finland.
6

Nomenclature of territorial units for statistics (NUTS): Classification used in
regional statistics and funding allocation which subdivides Member States into regions
of three categories according to existing national administrative subdivisions and
specific population thresholds. From larger to smaller areas, they are: NUTS 1 (3 to
7 million inhabitants), NUTS 2 (800 000 to 3 million) and NUTS 3 (150 000 to 800 000).

Outermost regions: A classification referring to nine regions in the European Union:
the five French overseas departments and the French overseas community of Saint-
Martin; the Spanish autonomous community of the Canary Islands; and the Portuguese
autonomous regions of the Azores and Madeira. These regions face certain constraints
(remoteness, insularity, small size, difficult topography and climate, economic
dependence, etc) which affect their socio-economic development.

Purchasing power standard (PPS): An artificial currency unit used to express
national account aggregates adjusted for price level differences among Member
States.

Premium: An additional payment made on top of the basic regional allocation in view
of various socio-economic and environmental criteria.

Programme period: The period within which EU spending is planned and
implemented.

Safety net: Minimum allocation expressed as a percentage of the allocation received
in the previous programme period.

Transition region (TR): A region where the GDP per capita is between 75 % and
90 % (2014-2020) or 75 % and 100 % (2021-2027) of the EU average.

Youth Employment Initiative (YEI): A programme under the Youth Guarantee to
support young people not in education, employment or training in regions with a
youth unemployment rate above 25 %.
7

Executive Summary
I The European Commission has proposed that the EU spends €373 billion in the next
programme period, 2021-2027, on cohesion policy, designed to narrow the gap
between rich and poor European regions. Funding for cohesion policy is channelled to
Member States through three funds: the European Regional Development Fund
(ERDF), the European Social Fund Plus (ESF+) and the Cohesion Fund (CF).

II How much of the total EU budget is devoted to cohesion policy is essentially a
political decision. The amount allocated to each Member State is governed by a series
of processes, which have been broadly similar since the 2000-2006 period. For 2021-
2027, the Commission published its allocation methodology proposals as part of its
much wider proposals for a ‘common provisions regulation’ (CPR), governing the
whole operation of the three shared management funds referred to above, together
with four other smaller funds. The processes determining the amounts available to
Member States are relatively complicated. The aim of this rapid case review is
therefore to set these processes out, within their context, so that stakeholders can
understand the rationale behind, and operation of, these processes.

III Within cohesion policy, the Commission proposes to allocate a total of
€326.3 billion to the ERDF/ESF+, and the remainder, €46.7 billion, to the CF. Within the
former, there are two high level goals: Investment for jobs and growth (€316.8 billion),
and European territorial cooperation (€9.5 billion). The allocation processes vary:

o    Within the Investment for jobs and growth goal, different processes are used for
     the three categories of regional wealth (less developed, transition and more
     developed). The main criterion determining funding is relative prosperity, but
     regions can also benefit from additional premiums relating to socio-economic and
     environmental factors: unemployment, particularly youth unemployment,
     educational attainment, greenhouse gas emissions and migration. The last two of
     these factors are proposed for the first time for 2021-2027.

o    The European territorial cooperation goal, funding is allocated to regions
     primarily on the basis of the populations affected.

o    Funding from the CF is available to Member States whose wealth is less than 90 %
     of the EU average. Funding is allocated on the basis of eligible Member States’
     populations and areas, adjusted for relative prosperity.

In total, relative wealth determines just over 80 % of the allocations.
8 IV As in previous periods, the allocations resulting from the processes set out above are subject to further adjustments designed to mitigate significant fluctuations in the amounts received by individual Member States. These adjustments take the form of caps limiting the maximum amount receivable, and safety nets guaranteeing a minimum level of funding. V The Commission proposes two further adjustments, after the caps and safety nets have been taken into account. First, the Commission has proposed to maintain the transfer of €11 billion from the CF to the directly-managed Connecting Europe Facility (CEF). And separately from its initial CPR proposal, the Commission proposed a methodology for allocating funds to the ESF+ with a view to distinguishing the allocations for ESF+ (€100 billion in total) and the ERDF at Member State level. The main criterion is the proportion of ESF resources received by each Member State for the 2014-2020 period, adjusted by reference to two additional criteria relating to youth unemployment and social inclusion. VI The Commission’s proposal would mean that Member States received, in total, 10 % less cohesion policy funding in 2021-2027 than in the previous period. A significant factor for changes in individual allocations is the changed prosperity level of many regions (and some Member States), leading to a reclassification of their status (for example, from less developed to transition). The effect of the caps and safety nets means that no Member State would receive an increase in cohesion policy funding of more than 8 %, or a reduction of more than 24 %. The total share of cohesion policy funding going to less developed regions under the proposal would remain constant, at 75 % of available funding. VII The final stage of the process takes place outside the methodology proposed by the Commission, in political negotiations involving the EU and the Member States. In previous periods, these negotiations gave rise to additional allocations to certain Member States and regions. As at February 2019, the revised timetable – in line with European Council conclusions – is to reach a compromise on the multiannual financial framework (MFF) in the autumn of 2019 and to finalise the CPR negotiations shortly afterwards.
9

Introduction
01 Cohesion policy – designed ‘to promote economic, social and territorial cohesion
among Member States’ – is one of the most significant areas of European Union (EU)
activity, accounting for around a third of its budget. Each Member State is entitled to
spend a fixed sum, channelled through different funding mechanisms, pursuing
Cohesion objectives. The processes determining the amounts available to Member
States are relatively complicated. The aim of this rapid case review is to set these
processes out, within their context, to help readers understand the rationale behind,
and operation of, these processes.

02 Since this rapid case review is not an audit report, it contains no audit
judgements, conclusions or recommendations. Our focus is the proposed allocation of
cohesion funds for the next programme period, 2021-2027, on which the EU legislators
are expected to decide within the next 12 months. We compare these proposals with
previous periods where appropriate. The review is structured as follows:

o    The main principles guiding the allocation process, and an overview of the
     allocation process

o    Initial allocations to Member States, comprising a number of different stages

o    Subsequent adjustments to the initial allocations
10
Allocation principles and overview of
process
Allocation principles
03 In line with the Treaty objective1, Cohesion policy is designed with the aim of
closing the gap between poor and rich European regions. Consistent with this policy,
the main principle underpinning allocation is that resources are directed towards the
poorest countries and regions. However, as in previous periods, for the 2021-2027
multiannual financial framework (MFF) richer regions are not excluded from Cohesion
funding. According to the Commission, this is because many of the greatest challenges
(such as globalisation and the transition to a low carbon economy) increasingly affect
many regions across the EU, including more developed ones. 2
04 A methodology for allocating funds was put in place for the 2000-2006
programme period 3, and the general approach has remained relatively constant since
then. The criterion having the biggest effect on how much Member States and regions
receive remains relative wealth 4. Other criteria are used in the allocation process,
reflecting policy priorities, but these criteria have much less weight. Over previous
programme periods, criteria relating to the labour market and education have been
used; for the 2021-2027 period, the Commission proposes migration flows and
greenhouse gas emissions as additional criteria. Annex I provides more details on the
evolution of criteria. Since the reliability of data and acceptance by the Member States
is key, the Commission uses data from Eurostat as the basis for its allocations.
1
TFEU article 174.
2
EU Commission, Fact Sheet, 29 May 2018 and Impact Assessment 2021-2027, SDW(2018)
283 Final.
3
It is known as the ‘Berlin method’, as it was agreed at the Berlin summit of 1999.
4
The Commission considers, after an examination of alternative indicators, this measure to
be the most neutral and reliable indicator, reflecting the needs and disparities of the
regions and Member States. See DG REGIO, July 2014 report on economic, social and
territorial cohesion, p. 198.11
05 Mechanisms in the form of caps and safety nets are incorporated in the process
to ensure that individual Member States’ allocations do not vary too much from one
programme period to the next.
06 The final decisions on MFF allocations take place within a highly political context.
As the MFF is approved by unanimity, the outcome of the allocation process has to be
acceptable to the European Parliament and all Member States. Extensive negotiations
are generally necessary: in previous periods, additional sums have been allocated to
Member States outside the application of the relevant formulae. The final allocation
represents a political compromise.
Overview of process
07 For the 2021-2027 period, the Commission has included, for the first time, a
description of the allocation methodology in the CPR proposal 5. The proposal also
includes the amounts allocated to the Member States.
08 Figure 1 below gives an overview of the Commission’s proposal for translating
the total EU resources for the period into allocations for Cohesion policy for each
Member State and for each fund. All figures quoted in this review are in current prices,
unless otherwise indicated.
5
Annex XXII of CPR proposal COM(2018) 375 final. This proposal assumes that the UK leaves
the EU at the end of March 2019. As at February 2019, the arrangements governing the
UK’s potential exit were uncertain. We have therefore excluded any Brexit-related
considerations from this review.12
Figure 1 – The allocation process for Cohesion policy funds
MFF 2021-2027 = €1 279 bn
EU
budget
Heading 2: Cohesion and Values €442 bn
Erasmus + Creative Europe Others…
Cohesion Policy
Policies €373 bn
Cohesion Fund ERDF / ESF +
Funds
€46.7 bn €326.3 bn
Territorial
Investment for jobs and growth goal
Goals cooperation goal
€316.8 bn €9.5 bn
Funding for outermost +
Allocation National northern sparsely Regional Regional /national
method populated regions
Adjustments National caps and safety nets
Split
Final ETC
CF ESF+ ERDF
Allocations (funded by ERDF)
Source: ECA.
Note: The financial amounts presented are the Commission’s proposals for 2021-2027. They include
funding not directly allocated to Member States (‘transfers’): €11.3 bn transferred from the CF to the
Connecting Europe Facility (CEF), €1.3 bn for Technical Assistance managed by the Commission (for all
the funds), €1.2 bn for the interregional components of the European territorial cooperation goal,
€0.6 bn from ERDF to the European Urban Initiative and €0.2 bn for transnational cooperation under the
ESF+.
09 The first stages in the process are as follows:
o The starting point is the overall EU multi-annual budget for the programme
period. In May 2018, the Commission published its proposals for the next period,
2021-27 6. The Commission’s proposal represents an increase in the total budget
of 18 % over the previous period, 2014-2020 (from €1 087 billion to
€1 279 billion). This is equivalent to 5 % after adjustments 7.
6
COM(2018) 322 final and COM(2018) 321 final.
7
ECA Briefing paper July 2018 “The Commission’s proposal for the 2021-2027 Multiannual
Financial Framework”, paragraphs 4 and 6. Adjustments include the need to take account
of inflation and Brexit.13
o Within that total figure, the Commission proposes to allocate €442 billion to
‘Cohesion and values’; and within that, €373 billion to Cohesion policy (10 % less
than the previous period). The allocation of this latter sum is the subject of this
review. Three funds contribute to Cohesion policy: the European Regional
Development Fund (ERDF); the European Social Fund Plus (ESF+); and the
Cohesion Fund (CF).
o Of the total Cohesion policy funding, the EU earmarked €46.7 billion for the CF,
with the ERDF/ESF+, which are allocated together initially, accounting for the rest.
o For the ERDF/ESF+ total of €326.3 billion, the EU has two goals: Investment for
jobs and growth, accounting for the bulk, and European territorial cooperation. A
small amount (€1.6 billion) within the first goal is allocated to support ‘outermost
and northern sparsely populated regions’.
10 The next stage is the first point at which allocations to individual Member States
are determined – either to the country as a whole or to regions within it. Different
processes are used for the initial allocation of different elements of the total Cohesion
funding available, as set out in the following sections and presented in Annex II. First,
we explain the allocation of ERDF/ESF+, followed by the allocation of the CF. The final
section within this part of the review covers subsequent adjustments, including caps
and safety nets and the allocation to ESF+. Throughout the document, we use a
number of worked examples, based on fictitious Member States or regions, to
illustrate the calculations.14
Initial allocation to Member States
Allocation for Investment for Jobs and Growth goal
11 Different processes are used to allocate funding related to the two goals of
ERDF/ESF+. Within the first goal, investment for jobs and growth, an important
criterion is the relative wealth of regions8. The Commission proposes the following
categorisation for 2021-2027 (see also Annex X):
o Less developed regions, where average GDP per capita is under 75 % of the EU
average
o Transition regions, where average GDP per capita is 75 % - 100 % of the EU
average
o More developed regions, where average GDP per capita is greater than the EU
average
Less developed regions
12 The allocation for less-developed regions is determined in three steps, and
illustrated in Annex III (a):
(1) The difference between the region’s GDP per capita and that of the EU average –
the prosperity gap – is multiplied by the population of the region.
(2) A coefficient is applied to this figure, reflecting the relative wealth of the Member
State within which the region is located – see Annex III (b). A poor region in a
poor country therefore receives more than an equally poor region in a less poor
country.
(3) Regions can benefit from additional premiums relating to socio-economic and
environmental factors: unemployment and youth unemployment specifically,
educational attainment, greenhouse gas emissions and migration – see Annex III
(c).
8
The Commission measures wealth using gross domestic product (GDP), and gross national
income (GNI), with or without adjustments to reflect purchasing power. These terms are
explained in the Glossary.15
13 A worked example of the process for less developed regions, for a fictitious
region, is in Table 1.
Table 1 – Worked example of calculating less developed regions’
individual allocation
Region
(1) Regional GDP per capita €15 000
(2) EU GDP per capita €25 000
Step (1) (3) Prosperity gap = (2)-(1) €10 000
(4) Region's population 3 500 000
(5) Initial theoretical amount = (3) x (4) x 7 years €245 bn
90 % of the EU
National GNI per capita
average
Step (2)
(6) Corresponding coefficient (see Annex IIIb) 1.3 %
(7) Individual allocation = (5) x (6) €3 185 m
Number of people unemployed (a) 300 000
Rate of unemployment (b) 13.2 %
Premium 1
Average for less developed regions (c) 13.5 %
Unemployment
Number of people exceeding the average 0
(8) Premium amount = (d) x €500 x 7 years €0
Number of young people unemployed (a) 60 000
Rate of youth unemployment (b) 35.0 %
Step (3) Premium 2 Youth Average for less developed regions (c) 32.6 %
(example for Unemployment Number of people exceeding the average
4 114
3 premiums) (if b>c) (d) = (a) - [(a)/(b)x(c)]
(9) Premium amount = (d) x €500 x 7 years €14.4 m
National CO2 emissions (a) t 200 m
2030 target (b) t 175 m
Premium 3
Amount exceeding the target (if a>b)
Greenhouse gas t 25 m
(c) = (a) - (b)
emissions
Region's share within national population (d) 10.0 %
(10) Premium amount = (c) x (d) x €1 x 7 years €17.5 m
Allocation for 2021-2027 = (7) + (8) + (9) + (10) €3 216.9 m
Source: ECA based on Commission’s CPR Proposal, Annex XXII, 1a. to g.
Note: This is not the complete allocation process, as the example does not show the allocation of all
premiums.
Transition regions
14 The Commission proposes that for 2021-2027, transition regions are those where
the GDP per capita is between 75 % and 100 % of the EU average 9. For the 2014-2020
period, the equivalent was 75 % - 90 % of the EU average; regions in the 90%-100 %
9
Art.102-2.b of the Commission’s CPR Proposal (COM(2018) 375 final).16
category were previously classed as more developed – see paragraph 16 below. This
change considerably widens the population covered by this category, from under 15 %
to over 25 % of the EU population. The effect of moving from more developed to
transition status is that the regions in question tend to receive more cohesion funding.
The Commission justifies this change by the persistence of structural challenges for
middle-income regions, which are being progressively caught up by less prosperous
but fast developing regions 10 while still being outdistanced by the more developed
regions. The countries mostly affected by this modification are Finland, France,
Germany, Slovenia and the Netherlands. Within this extension of the range of
transition regions, the mechanics of the allocation process proposed for 2021-2027 are
broadly similar to 2014-2020.
15 There are four steps involved in the allocation, illustrated in Annex IV:
(1) A minimum level of support (€18 per head each year), before premiums, is
determined. This is the theoretical initial amount per head that the region would
receive if it were more developed 11.
(2) A maximum level of support, before premiums, is calculated. This is 60 % of the
allocation per head that the region would receive if it were less developed
(paragraph 12), with a GDP per capita of 75 % of the EU average 12.
(3) The support for the region in question is then determined by reference to the
region’s relative GDP per capita against the EU average, within the minimum and
maximum limits as outlined above. A worked example is presented in Figure 2, for
a region with a GDP per capita of 87.8 % of the EU average; the Figure shows that
this region would receive €50 a head each year.
(4) Member States can benefit from the same additional premiums as is the case for
less developed regions (Annex III (c)), relating to socio-economic and
environmental factors: unemployment and youth unemployment specifically,
educational attainment, greenhouse gas emissions and migration.
10
P. 198 of the Sixth report on economic, social and territorial cohesion, DG REGIO, July 2014.
11
Commission’s CPR Proposal, Annex XXII, 2.a and 3.
12
Ibid, 1.a and b.17
Figure 2 – Worked example of calculating an initial allocation for a
fictitious transition region
8
Maximum allocation per head
80 € 7
Allocation per year and per head
6
Region B
5
x
(in €)
50 €
4
3
2
18 €
1
Minimum allocation per head
0
75 % 80 % 85 % 87.8 % 90 % 95 % 100 %
GDP per capita expressed in relation to the EU average
Source: ECA based on Annex XXII, 2a and b.
Note: The graph illustrates how, for this region, its wealth of 87.8 % of the EU average results in an
allocation per head of €50 a year.
More developed regions
16 More developed are regions whose GDP per capita is above the EU average13.
The allocation methodology differs from those previously described but remains
broadly similar to that in place for 2014-2020. As illustrated in Annex V (a), there are
three steps:
(1) The Commission calculates the total funding for more developed regions by
multiplying an amount per person per year by the population of those regions.
(2) Of this total, the amount then allocated to each region is based on data relating
to seven demographic and socio-economic indicators. These indicators have
different weightings, ranging from the 20 % for population and educational
attainment, to 2.5 % for population density. The indicators and their weighting
are in Annex V (b). The share for each region is calculated for each indicator and
13
Art.102-2.c of the Commission’s CPR Proposal (COM(2018) 375).18
applied to the total funding available to determine each region’s allocation. Table
2 provides a worked example of this method for the first indicator.
(3) As a last step, premiums related to greenhouse gas emissions and migration can
be added, if applicable, using the same processes as for less developed and
transition regions.
Table 2 – Worked example of the allocation method for more developed
regions – simulation based on indicator 1 (population)
Region
(1) Total population 208 m
Step 1: Available resources for all MDRs
(2) Allocation per head €18
(excluding premiums)
(3) MDR total funding = (1) x (2) x 7 years €26.2 bn
(4) Population of region 6m
(5) MDR total population 208 m
(6) Population share = (4) / (5) 2.9 %
Step 2 (7) Share of indicator 1 in available resources 20 %
(8) Rescaled share for region = (7) x (6) 0.6 %
(9) Final allocation for region on the basis of
€151 m
indicator 1 = (8) x (3)
Source: ECA based on Commission’s CPR Proposal, Annex XXII, 3 and 4.
17 As in the 2014-2020 period, within this goal the Commission also proposes to
ringfence funding of €1.6 billion to outermost and northern sparsely populated
regions. Funding would be allocated on the basis of population.
Allocation for the European Territorial Cooperation goal
18 Cohesion policy objectives relating to the European territorial cooperation goal
are funded through the ERDF. Allocation within this goal is based on four ’strands’ of
activity (Annex VI (a)): terrestrial cross-border cooperation, maritime cooperation,
transnational cooperation and cooperation in outermost regions. For 2021-2027, the
Commission proposes to allocate €9.5 billion to this goal 14, with different amounts
available under each strand. Within each strand, funding would be allocated to eligible
regions on the basis of the populations affected– see Annex VI (b). The bulk of the
funding is devoted to the terrestrial cooperation strand.
14
The proposed ETC regulation (COM(2018) 374 final) distinguishes five components: cross-
border cooperation, transnational and maritime cooperation (two different strands in the
allocation process), outermost regions’ cooperation, interregional cooperation and
interregional innovation investments. The two interregional components, amounting to
€1.2 bn, are not allocated to Member States.19
19 A worked example of funding under the European territorial cooperation goal is
in Table 3.
Table 3 – Worked example of calculating a Member State’s allocation
under the European Territorial Cooperation goal
Member State
(1) Member state's share of total population of regions along land borders 5.0 %
(2) Share of total population living less than 25 km from the border 10.0 %
A. Terrestrial cross-
(3) Weighted share = 60 %x(1) + 40 %x(2) 7.0 %
border cooperation
(4) Total funding available for this strand €5.0 bn
(5) Allocation for this strand = (3)x(4) €350 m
(1) Member State's share of total population of regions along border coastlines 1.0 %
(2) Share of total population living less than 25 km from the coastlines 2.0 %
B. Maritime
(3) Weighted share = 60 %x(1) + 40 %x(2) 1.4 %
cooperation*
(4) Total funding available for this strand €1.35 bn
(5) Allocation for this strand = (3)x(4) €19 m
(1) Member State’s population share in the EU 5.0 %
C. Transnational
(2) Total funding available for this strand €1.65 bn
cooperation*
(3) Allocation for this strand = (1)x(2) €82.5 m
(1) Member State’s population share in the EU outermost regions 8.0 %
D. Outermost regions
(2) Total funding available for this strand €0.3 bn
cooperation
(3) Allocation for this strand = (1)*(2) €24 m
E. Total ETC allocation for 2021-2027 = A(5) + B(5) + C(3) + D(3) €475.5 m
Source: ECA based on Commissions’ CPR Proposal, Annex XXII, 8. and the presentation “Methodology for
determining financial allocations by Member State” by the European Commission.
* In the proposed ETC regulation (COM(2018) 374 final) transnational and maritime cooperation is one
component with a budget of €3 bn. The split (€1.35 bn and €1.65 bn) is only for the purposes of
allocation to the Member States.
Allocation for the Cohesion Fund
20 Member States with a GNI per capita below 90 % of the EU average are eligible
for the Cohesion Fund. For 2021-2027, the Commission has proposed that a total
€46.7 billion be allocated to the CF, a 45 % reduction compared to the previous period.
The Commission explains this significant reduction by the reduced need in Member
States which joined the EU in 2004 and 2007 for major investments in transport and
environment infrastructure. In practice, higher allocations from the ERDF and ESF+ to
poorer regions compensate for this reduction in CF funding, so that the overall relative
allocation of Cohesion policy funds to poorer regions remains broadly unchanged.
21 The process for allocating the Cohesion Fund budget has remained the same as in
the previous periods. The allocation process is as follows (see Annex VII):20
(1) The first step is the calculation of a theoretical total figure for the CF, based on
€62.90 per person per year.
(2) An initial allocation is made on the basis of population (50 %) and surface area
(50 %) 15.
(3) This initial allocation is adjusted for national prosperity (based on the Member
State’s GNI relative to the EU average).
(4) The mechanics of the prosperity adjustment means that the calculation needs to
be rescaled. The rescaled Member State share is then applied to the total CF
funding available, to give the Member State’s allocation.
22 A worked example of funding under the Cohesion Fund is in Table 4.
Table 4 – Worked example of calculating a Member State’s CF allocation
Member State
A: Step 1 - CF resources available € 62.9 per head x 7 years x total eligible population €46.7 bn
(1) Member State's population share 10 %
B: Step 2 - Member State's share (2) Member State's surface share 8%
(3) Member State's share = 50 %xB(1)+50 %xB(2) 9%
(1) Amount by which the Member State's GNI/capita is lower than
the average for all Member State's eligible for CF 30 %
C: Step 3 - Adjustment for relative (2) Adjustment to reflect Member State's relative poverty = 1/3 (per
national prosperity CPR proposal) * C(1) +10 %
(3) Adjusted Member State's share = B(3)x(1+C(2)) 9.9 %
D: Step 4 - Member State's share (1) Sum of all adjusted Member States' shares 115 %
rescaled (2) Rescaled Member State's share = C(3)/D(1) 8.6 %
Final CF allocation for 2021-2027 = AxD(2) €4.02 bn
Source: ECA based on Commission’s CPR Proposal, Annex XXII, 7.
23 In line with the proposal to reduce CF funding for 2021-27, the Commission
proposes to limit an individual Member State’s entitlement to CF resources to one-
third of its total allocation for all Cohesion policy funding. The countries affected by
this limit in the proposed 2021-2027 allocation are Estonia, Latvia and Malta. However,
these Member States will not lose any funding, as any excess CF resources will be
transferred to their entitlements under the Investment for jobs and growth goal.
15
If the population density is very high, the area criterion is not factored in.21 Financial weight of the allocation criteria 24 In terms of total Cohesion policy funding – covering ERDF, ESF+ and CF – Table 5 illustrates the weight of the different criteria in the allocation process to Member States. It shows that for both the 2014-2020 and 2021-2027 periods, prosperity accounts for over 80 % of the allocations. Table 5 – Financial weight of the allocation criteria Criterion 2014-2020 2021-2027 Prosperity (GDP/GNI) 86 % 81 % Labour market, education, demographics 14 % 15 % Climate - 1% Migration - 3% Total 100 % 100 % Source: Presentation “EU Budget for the future: Regional development and cohesion” by the European Commission.
22

Adjustments to initial allocation
25 This section covers the operation of the caps and safety nets in place, and
adjustments to allocations including specific allocations to funds. It also presents the
result of these processes, in terms of the final allocations to Member States as shown
in the Commission’s CPR proposal.

Caps and safety nets
26 As in previous periods, the allocations to Member States resulting from the
processes set out above are subject to further adjustments designed to mitigate
significant fluctuations in the amounts by individual Member States. These
adjustments take the form of caps limiting the maximum amount receivable, and
safety nets guaranteeing a minimum level of funding. Annex VIII (a) shows the caps
and safety nets proposed for the 2021-2027 period.

Caps

27 For 2021-2027, the Commission proposes three capping elements:
(1) First, the total annual funding available to an individual Member State is limited
    to a fixed percentage of their estimated GDP 16. The proportion of GDP allowed
    has decreased over the last programme periods (see Annex VIII (b)) and depends
    on the relative wealth of the country: poorer countries have higher limits, as
    shown in Table 6, on the basis that their needs are greater.

Table 6 – Capping, expressed as a proportion of national GDP

                                             Cap as
 Threshold in terms of GNI per                                   Applicable to Member
                                             proportion of
 capita                                                          State
                                             GDP
 under 60 % of EU average                    2.3 %               Bulgaria, Romania, Croatia
 60 % - 65 % of EU average                   1.85 %              Latvia
 over 65 % of EU average                     1.55 %              All other EU countries
Source: ECA based on CPR 2021-2027 Proposal, Annex XXII, 10 and Commission information.

16
     Based on DG ECFIN 2021-2027 long-term growth forecasts (in non-PPS terms).
23
(2) As a second cap, national allocations are also subject to a limit in relation to the
amount received under the previous programme period. For 2021-2027, the
Commission proposes that a Member State cannot receive more than 108 % of its
allocation for the 2014-2020 period. Romania, Bulgaria and Greece are affected
by this limit.
(3) Finally, the Commission’s proposal introduces a new ceiling for rich Member
States, whose GNI per capita is at least 120 % of the EU average. These countries
cannot receive more than was allocated to them for 2014-2020. Six Member
States are affected: Belgium, Sweden, the Netherlands, Austria, Denmark and
Luxembourg.
Safety nets
28 The main safety net proposed by the Commission is that an individual Member
State’s allocation cannot be less than 76 % of what it received in the 2014-2020 period.
This is a much higher level than was in place for that period, when the equivalent
safety net was set at 55 %. Five countries benefit from this safety net in 2021-2027:
Hungary, Lithuania, Estonia, Malta and Czechia.
29 The allocation mechanism means that transition regions cannot receive less than
they would if they were more developed regions (paragraph 15 (1)). An additional
safety net is in place to cushion the impact of a region losing its less developed status,
as this would normally lead to a lower allocation. Regions in this category cannot
receive less than 60 % of their annual allocation under the 2014-2020 Investment for
jobs and growth goal.
Exemptions
30 The caps and safety net mechanisms are applied to all the funding receivable
under Cohesion policy by a region or a Member State, with two exceptions where they
do not apply:
o Allocations under the European territorial cooperation goal. According to the
Commission, this is to prevent imbalances in allocations between border
countries.
o The cap relating to allocations to more developed regions based on GDP (see
paragraph 27 (1)). According to the Commission, this is to avoid further
reductions where the allocations are already relatively low.24
Additional adjustments
31 The Commission proposes two additional adjustments, after the caps and safety
nets have been taken into account. First, for the 2021-2027 period, the Commission
has proposed to maintain the transfer of €11 billion from the Cohesion Fund to the
directly-managed Connecting Europe Facility for Transport (CEF) 17.
32 Secondly, for 2021-2027, the Commission has proposed a fixed amount of
€100 billion for ESF+ and €216.8 billion for ERDF under the Investment for jobs and
growth goal. However, in the methodology described above, the two Funds are treated
together and allocated jointly. Separately from its May 2018 CPR proposal, in October
2018 the Commission proposed a methodology for allocating funding to the ESF+ with
a view to distinguishing the allocations for ESF+ and ERDF at Member State level.
33 The proposed methodology for establishing the ESF+ share is similar to the
method used in 2014-2020 as follows, with a worked example in Table 7:
(1) The starting point for each Member State is its allocation of 2014-2020 ESF
resources as a proportion of its total ESF and ERDF allocation for that period.
(2) These shares are then adjusted by reference to two additional criteria, relating to
youth unemployment – Not in Education, Employment, or Training, (NEET) rate;
and social inclusion – At risk of poverty or social exclusion (AROPE) rate. These
indicators stem from the European Pillar of Social Rights and reflect the policy
priorities of the ESF+ 18. The mechanics of these adjustments are in Annex IX.
(3) The sum of all shares is then applied to the total available ESF+ resources.
17
The Connecting Europe Facility for Transport is designed to support investments in building
new transport infrastructure in Europe and rehabilitating and upgrading the existing one. It
focuses on cross-border projects and projects aiming at removing bottlenecks, as well as
horizontal priorities such as traffic management systems.
18
For 2021-2027, the Youth Employment Initiative (YEI) and Fund for European Aid to the
most Deprived (FEAD) have been integrated into the ESF+.25
Table 7 – Worked example of calculating a Member State’s ESF+
allocation
Member State
(1) Member State's allocation for Investment for jobs and growth
A. Initial data goal for 2021-2027 period €15 bn
(2) ESF share (including YEI and FEAD) in 2014-2020 period 40 %
(3) NEET rate in the Member State
20 %
(4) Adjustment by 1.5 % for youth unemployment
(as NEET rate > 16.4 % - Annex IX) +1.5 %
B. Adjustments for youth (5) AROPE rate in the Member State
unemployment and social inclusion 25 %
(6) Adjustment by 1 % for social inclusion
(as 23.9 % < AROPE rate < 30.3 % - Annex IX) +1 %
(7) Adjusted ESF+ share = (2)+(4)+(6) 42.5 %
(8) Initial ESF+ amount for the Member State = (7)x(1) €6 375 m
(10) Sum of all Member States' initial ESF+ amounts €103 bn
C. Adjustment for the availability
(11) Available ESF+ resources for 2021-2027 * €99.45 bn
of ESF+ resources
(12) Adjusting factor = (11)/(10) 96.6 %
D. Final ESF+ allocation for 2021-2027 = (8)x(12) €6 155 m
Source: ECA.
* €0.2 bn for transnational cooperation under ESF+ and €0.35 bn for technical assistance implemented
by the Commission is deducted from the €100 bn total ESF+ funding before allocation.
Final allocations
34 Table 8 compares the result of the allocation methodology per type of region
between 2014-2020 and the proposal for 2021-2027. Despite the reduction in the CF,
the overall relative allocation of Cohesion policy funds to less developed regions in the
2021-2027 proposal remains constant, amounting to three quarters of the available
funding (paragraph 20).26 Table 8 – Allocation by type of region Fund/Type of region 2014-2020 2021-2027 Cohesion Fund 22 % 13 % ERDF/ESF+ Less developed regions 53 % 62 % ERDF/ESF+ Transition regions 10 % 14 % ERDF/ESF+ More developed regions 15 % 11 % Total 100 % 100 % Share CF + ERDF/ESF+ Less developed regions 75 % 75 % Source: Presentation “EU Budget for the future: Regional development and cohesion” by the European Commission. 35 The Member State allocations per Fund for 2021-2027 are presented in Table 9 below.
27

Table 9 – Proposed allocations to Member States per Fund for 2021-2027
(in million euros, current prices)
                                                                       of which to
                                                                                                   CPR proposal,
                       ESF+         ERDF         ETC        CF         transfer to   Transfers *
                                                                                                    Annex XXII
                                                                         the CEF

Belgium                  1 177        1 158          405         0               0           15           2 754
Bulgaria                 2 588        5 643          143     1 654             401           54          10 082
Czechia                  2 737       10 524          314     6 444           1 563          100          20 116
Denmark                    181          213          249         0               0            3             646
Germany                  6 205       10 346        1 029         0               0          101          17 681
Estonia                    492        1 651           51     1 075             261           16           3 285
Ireland                    579          450          190         0               0            7           1 226
Greece                   5 900       11 528          120     4 034             978          116          21 697
Spain                   12 084       25 377          639         0               0          221          38 325
France                   7 194        9 654        1 106         0               0          102          18 058
Croatia                  2 145        5 776          219     1 695             411           53           9 888
Italy                   15 011       27 411          788         0               0          252          43 463
Cyprus                     207          434           24       319              77            4             989
Latvia                     736        2 573           55     1 424             345           24           4 812
Lithuania                1 029        3 127           88     2 085             506           31           6 359
Luxembourg                  21           21           30         0               0            0              73
Hungary                  4 806       11 624          272     3 437             833          109          20 248
Malta                       91          345           14       219              53            3             673
Netherlands                552          673          392         0               0            9           1 625
Austria                    510          695          229         0               0            8           1 442
Poland                  14 297       45 300          595    12 144           2 945          392          72 724
Portugal                 7 579       11 578          142     4 436           1 076          127          23 862
Romania                  8 385       17 323          392     4 499           1 091          168          30 766
Slovenia                   793        1 673           80       901             218           18           3 464
Slovakia                 2 481        8 345          235     2 173             527           71          13 305
Finland                    725          944          129         0               0           10           1 809
Sweden                     946        1 121          333         0               0           13           2 413
Technical assistance
*                             349          737         29        153
Transnational
cooperation *                 200
EUI *                                      564
Interregional **                                   1 206                                                  1 206
TOTAL                  100 000      216 808        9 498    46 692          11 285         2 027        372 991
Source: ECA based on Commission data.

* Transfers are: Technical assistance (0.35 % of the ERDF/ESF+/CF/ETC allocation), Transnational
cooperation (under ESF+) and the European Urban Initiative (under ERDF). They represent funding
managed by the Commission, not directly available to Member States. Indicative allocations of transfers
per Member State are shown, to reconcile with the Commission’s CPR proposal.

** Interregional components of ETC are not allocated to the Member States.

Note: the table has rounding differences.
28
36 For the first time the Commission has included in the CPR proposal the amounts
allocated to each Member State resulting from the methodology described above.
Figure 3 below presents the proposed allocations for 2021-2027 to Member States and
the relative change compared to the allocations for the 2014-2020 period, as of May
2018.
Figure 3 – Allocations to Member States 2021-2027 compared to 2014-
2020 (in 2018 prices)
-24 % safety net +8 % cap
Bulgaria +0.7
Romania +2.0
Greece +1.4
Italy +2.3
Finland +0.1
Spain +1.6
Cyprus +0.02
Sweden =
Increase/decrease in bn € Austria =
(in 2018 prices) Netherlands =
Luxembourg =
Denmark =
Belgium =
-0.9 France
-0.5 Croatia
-1.6 Portugal
-0.3 Slovenia
-0.2 Ireland
-0.6 Latvia
-4.1 Germany
-3.3 Slovakia
-19.5 Poland
-0.2 Malta
-0.9 Estonia
-5.7 Hungary
-5.6 Czechia
-1.8 Lithuania
-25 % -20 % -15 % -10 % -5 % 0% 5% 10 %
Source: ECA based on Commission data.
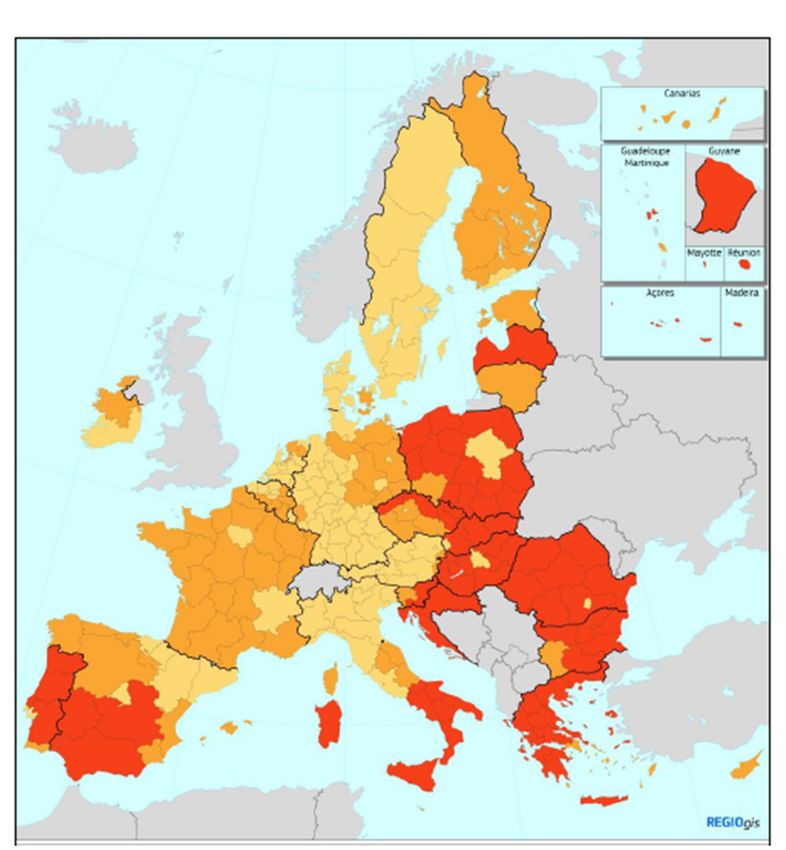
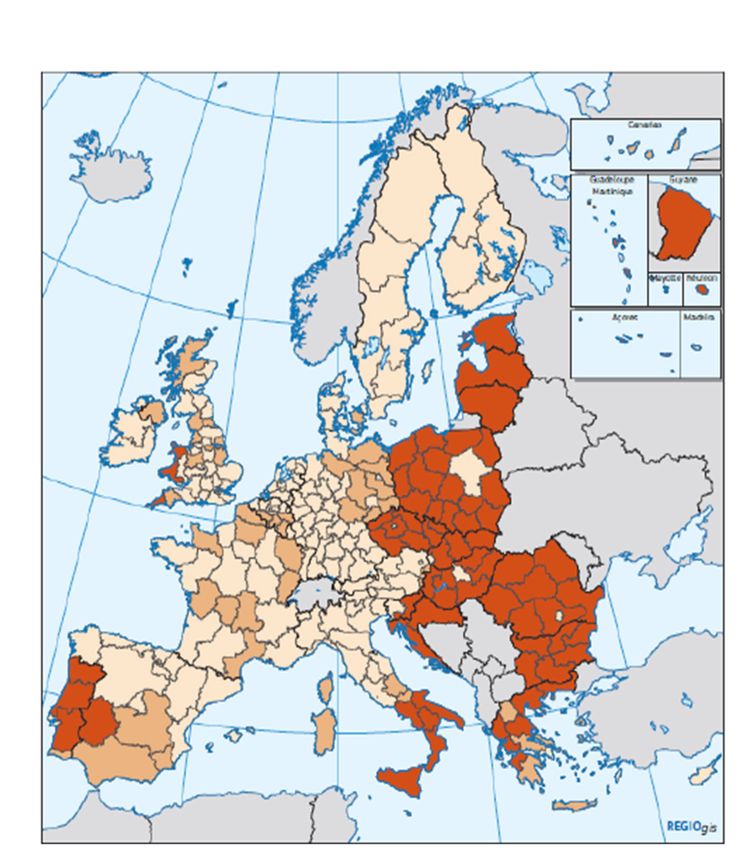
37 Figure 3 shows that although the allocation process is broadly similar and the
caps and safety nets are designed to limit significant variations, differences in
individual Member States’ allocations range from a reduction of 24 % to an increase of
8 %, with an average reduction of 10 %. A significant factor is the changed prosperity
level of many regions, which leads to a reclassification of their status (see maps at
Annex X). The main changes are:
— Estonia and Lithuania, and some regions in Czechia, Poland, and Bulgaria, change
from less developed region to transition region status;29
— In Greece and Spain, the number of regions with less developed region status
increases significantly, with a lower increase in Italy and Portugal ;
— Several countries have regions reclassified from more developed region to
transition region status: Finland, France, Germany, the Netherlands, Slovenia,
Austria, Belgium, Italy, Spain, Greece, Cyprus and Ireland. This is partly due to the
new threshold for transition regions (see paragraph 14).30
Final remarks and next steps
38 The allocation process proposed for 2021-2027 follows the model used for
previous periods. While climate change and migration have been brought into some
parts of the process, the effect is limited; the most significant factor remains relative
wealth, with 75 % of the funding going, as in previous periods, to less developed
regions. The Commission has been more transparent about the process than has been
the case in the past. It published its proposed methodology in full in its proposal for
the CPR, together with the resulting allocations. Under the proposal, individual
Member States would receive between 76 % and 108 % of their Cohesion policy
funding for 2014-2020.
39 The final stage of the process takes place outside the methodology set out in the
Commission’s proposal, in political negotiations involving the EU institutions and the
Member States (paragraph 06). Among the issues which might be covered in these
negotiations are whether or not to update calculations to reflect the availability of new
data. Previous allocations, for the 2007-2013 and 2014-2020 periods, were based on
data available two years before the start of the programme period. And in previous
periods, the political negotiations have also given rise to additional allocations to
certain Member States and regions19.
40 The initial aim of the Commission, when presenting the package in May 2018,
was that an agreement on the MFF should be reached before the European Parliament
elections in May 2019. As at February 2019, the revised timetable – in line with
European Council conclusions – is to reach a compromise on the MFF in autumn 2019
and to finalise the CPR negotiations shortly afterwards.
19
CPR 1303/2013, Annex VII, Art.14-20.31
Annexes
Annex I — Evolution of the allocation criteria over the last
three programme periods
Criteria 2007-2013
Reg. 1083/2006, Annex II
Convergence objective
A region's individual allocation regional population x prosperity gap (region's GDP
per capita - EU average)
Coefficient for national prosperity
GNI per capita32
2014-2020 2021-2027
CPR (1303/2013), Annex VII CPR Proposal, Annex XXII
Less developed regions (LDR) Less developed regions (LDR)
regional population x prosperity gap (region's GDP regional population x prosperity gap (region's GDP
per capita - EU average) per capita - EU average)
3.15 % 2.80 %
2.70 % 1.30 %
1.65 % 0.90 %
€1 300 /year x €500 /year x
number of unemployed persons exceeding average number of unemployed persons exceeding average
unemployment of all less developed regions unemployment of all less developed regions
€500 /year x
number of young unemployed persons exceeding
average youth unemployment of all LDR
€250 /year x
number of persons exceeding average low
education level of all LDR
€1/year for each tonne of CO2 equivalent exceeding
in 2016 the 2030 national targets
€400 /year per person
for MS’s non-EU net migration yearly average for
2013-2016
Transition regions (TR) Transition regions (TR)
average aid intensity of a MS's MDR per capita per average aid intensity of all EU MDR (€18) per capita
annum. If no MDR, EU average for MDR (€19.8) per annum
40 % of the amount for a theoretical region with 60 % of the amount for a theoretical region with
GDP/capita=75 % GDP/capita=75 %
linear interpolation of the region's relative linear interpolation of the region's relative
GDP/capita compared to EU average GDP/capita compared to EU average
€1 300 /year x €500 /year x
number of unemployed persons exceeding average number of unemployed persons exceeding average
unemployment of all less developed regions unemployment of all less developed regions
€500 /year x
number of young unemployed persons exceeding
average youth unemployment of all LDR
€250 /year x
number of persons exceeding average low
education level of all LDR
€1/year for each tonne of CO2 equivalent exceeding
in 2016 the 2030 national targets
€400 /year per person
for MS’s non-EU net migration yearly average for
2013-201633
Criteria 2007-2013
Reg. 1083/2006, Annex II
Regional competitiveness and employment objective
Total initial theoretical financial envelope
Share of regions according to the criteria
Population total population (50 %)
Unemployment number of unemployed people in NUTS level 3
regions with an unemployment rate above the
group average (20 %)
Employment number of jobs needed to reach an employment
rate of 70 % (15 %)
Tertiary education number of employed people with a low educational
level (10 %)
Low population density low population density (5 %)
Early School Leaving
GDP
Adjustment of the shares for regional prosperity increase or decrease of a region's total share by
+ 5 %/-5 % according to whether its GDP per capita
is below or above the average GDP per capita for
the group
Additional premiums
Greenhouse gas emissions
Migration34
2014-2020 2021-2027
CPR (1303/2013), Annex VII CPR Proposal, Annex XXII
More developed regions (MDR) More developed regions (MDR)
total eligible population x total eligible population x
an aid intensity per head and per year of €19.8 an aid intensity per head and per year of €18
total regional population (25 %) total regional population (20 %)
number of unemployed people in NUTS level 2 number of unemployed people in NUTS level 2
regions with an unemployment rate above the regions with an unemployment rate above the
average of all MDR (20 %) average of all MDR ( 20 %)
employment to be added to reach the Union employment to be added to reach the average
strategy for smart, sustainable and inclusive growth employment rate (ages 20 to 64) of all MDR (20 %)
target for regional employment rate (ages 20 to 64)
of 75 % (20 %)
number of persons aged 30 to 34 with tertiary number of persons aged 30 to 34 with tertiary
educational attainment to be added to reach the educational attainment to be added to reach the
Union strategy for smart, sustainable and inclusive average tertiary educational attainment rate (ages
growth target of 40 % (12,5 %) 30 to 34) of all MDR ( 20 %)
(g) population of NUTS level 3 regions with a g) population of NUTS level 3 regions with a
population density below 12,5 inhabitants/km 2 population density below 12,5 inhabitants/km2
(2.5 %) (2.5 %)
number of early leavers from education and training number of early leavers from education and training
(aged 18 to 24) to be subtracted to reach the Union (aged 18 to 24) to be subtracted to reach the
strategy for smart, sustainable and inclusive growth average rate of early leavers from education and
target of 10 % (12,5 %) training (aged 18 to 24) of all MDR ( 15 %)
difference between the observed GDP of the region difference between the observed GDP of the region
(measured in PPS), and the theoretical regional GDP (measured in PPS), and the theoretical regional GDP
if the region were to have the same GDP per head if the region were to have the same GDP per head
as the most prosperous NUTS level 2 region (7.5 %) as the most prosperous NUTS level 2 region (7.5 %)
€1/year for each tonne of CO2 equivalent exceeding
in 2016 the 2030 national targets
€400 /year per person
for MS’s non-EU net migration yearly average for
2013-201635
Annex II — Framework for initial allocation of Cohesion policy funds to Member States
European territorial
Investment for jobs and growth goal Cohesion Fund
cooperation goal
More developed MS with GNI/cap
Less developed regions Transition regions regions36
Annex III — Allocation method for less developed regions for
2021-2027
Annex III (a) – General allocation formula for less developed regions
Allocation method for less developed regions
Allocation for region X
=
Individual absolute National prosperity Premiums
amount coefficient (if applicable)
2.8 % Unemployment
(if GNI per capita is less than (15 years and +)
Regional population 82 % of EU average)
(inhabitants) Youth unemployment
or (15-25 years)
× × 1.3 %
(if GNI per capita is between
Low level of education
(25-64 years)
82 % and 99 % of EU average)
Prosperity gap
or Greenhouse
(EU27 GDP per capita –
gas emission
regional GDP per capita
0.9 %
(in PPS) (if GNI per capita is over
99 % of EU average) Migration
Source: ECA based on based on Commission’s CPR Proposal, Annex XXII, 1.a to g.37
Annex III (b) - Coefficients for determining the level of support of each less
developed region with respect to national prosperity
Applicable Proposed
Applicable to less
coefficient coefficient
GNI per capita developed regions in
2021-2027
2014-2020 2021-2027
BG, EE, LV, LT, HU, PL,
Less than 82 % of EU average 3.15 % 2.8 %
PT, RO, SK, SI, HR, EL
Between 82 % and 99 % of EU
2.7 % 1.3 % CZ, ES, IT
average
Greater than 99 % of EU
1.65 % 0.9 % FR
average
Source: ECA based on Commission’s CPR Proposal, Annex XXII, 1.b, Regulation 1303/2013, (Annex VII)
and Proposals for the MFF and Cohesion Policy 2021-27: a preliminary assessment, EPRC, June 2018.You can also read