GIS-BASED SPATIAL ACCESSIBILITY TO ISLAMIC FACILITIES FOR MUSLIM COMMUNITY IN THE MELBOURNE METROPOLITAN AREA - DIVA
←
→
Page content transcription
If your browser does not render page correctly, please read the page content below
Journal of Earth Sciences and Geotechnical Engineering, Vol.10, No.5, 2020, 49-68
ISSN: 1792-9040 (print version), 1792-9660 (online)
Scientific Press International Limited

GIS-based Spatial Accessibility to Islamic Facilities
 for Muslim Community in the Melbourne
 Metropolitan Area
 Khlood Ghalib Alrasheedi1, Gang June Lue2, Sultana Nasrin Baby3
 and Nadhir Al-Ansari4

 Abstract

The Geographic Information System (GIS) technology has not been widely used in
Islamic facilities including mosques, Islamic schools and halal butchers, and is an
important issue for the Muslim communities in Melbourne, Australia. This study
applied spatial methods to analyze the spatial accessibility to Muslim facilities of
the population in Melbourne city. Spatial accessibility is needed because Muslim
people believe that they must pray in the mosques, buy halal food and educate their
children in Islamic environment. Therefore, this study aimed to (i) identify spatial
accessibility by car to the above-mentioned Muslim facilities and (ii) identify
disadvantaged Muslim communities and facilities using census data at the fine
spatial resolution (i.e. at Mesh Block level). The disadvantaged Muslim
commonalities in the Melbourne Metropolitan Area (MMA) were delineated in GIS
environment using such techniques as spatial and hot spot analysis, network
analysis, mean center and standard distance methods by using ArcGIS 10.3. The
spatial accessibility was assessed in terms of travel distance and time, to highlight
their differences. This study highlighted the most affected Muslim communities in
terms of spatial accessibility, which are located in Hume, Whittlesea, and Melton
and Casey suburbs. Furthermore, this study stressed that there is a lack of Mosques
and Islamic Schools in the MMA, as approximately 5,000 Muslims do not have
proper access to this kind of facilities. The findings of this study could be used by

1
 Department of Geospatial, Royal Melbourne Institute of Technology (RMIT University),
Melbourne, Victoria, Australia.
2
 Department of Geospatial, Royal Melbourne Institute of Technology (RMIT University),
Melbourne, Victoria, Australia.
3
 Department of Geospatial, Royal Melbourne Institute of Technology (RMIT University),
Melbourne, Victoria, Australia.
4
 Lulea University of Technology, Lulea 971 87, Sweden.

Article Info: Received: April 19, 2020. Revised: April 27, 2020.
Published online: June 30, 2020.
50 Khlood Ghalib Alrasheedi et al.

Muslim community when choosing a suburb for their families. Therefore, it is
recommended that the urban and regional planners should take the obtained results
into consideration to achieve fair and better distribution of Islamic facilities in
Melbourne city.

Keywords: Accessibility, Muslim facilities, analysis by GIS, hotspot, road
network, Islamic school, halal butchers, mosques, Melbourne Metropolitan Area
(MMA), Statistical Mesh Block (MB), Statistical Area Level 1 (SA1).

1. Introduction
The 2016 census report for Muslim population distribution in Australian cities,
states that 30.2% lives in Melbourne [1]. As per the Australian Bureau of Statistics
(ABS) census 2016, the suburbs with the highest numbers of Muslim population in
Melbourne have been identified as Meadow Heights, Reservoir, Dallas, Noble Park,
Coburg, St. Albans, Broadmeadows, Lalor and Dandenong. Given this large and
substantially scattered Muslim population, it is essential to see if all the facilities
and services needed by this population are available around the areas they dwell in.
Spatial accessibility to places of worship and services and facilities including
mosques, educational institutions, halal butchers is an important issue for the
Muslims communities in Melbourne because they believe that they must attend their
mosques [2], buy meat from halal butchers [3] and educate their children in Islamic
environment [4]. Therefore, easy accessibility to places of worship and other
services and facilities is crucial for the Muslims communities and surrounding
suburbs (Euro – Islam info 2016). A number of minority religions (for example,
Islam) in big countries like Australia have special significance to their religious
identity [5]. Muñoz (2010) remarked that it is very important to gain an
understanding about the minority communities and their religious requirements as
it moulds the society, they live in. Realizing the importance of religion and religious
practices in daily life, it can be stated that the places of worship will have a huge
importance in human lives [6]. Therefore, the places of worship for Muslims are
very important and are parts of their social identity [13]. Similarly, other facilities
for the Muslim community such as Islamic schools and halal shops will also have
significant influence in their lives, because, for example, Muslims believe that they
must consume meat from halal butchers. Thus, they practice their religion as
guidance in their daily life which influences their choices of settlement and
residence [7].
Spatial studies hold an important place in the research on religion because they
provide an opportunity to explore both the spatial distribution of the faith followers
as well as the religion facilities [8]. Khan (1992) reported that many spatial studies
have explored the places of worship. For example, [10] conducted spatial studies on
mosques. In addition, [9] conducted spatial studies that focused on Muslims and
their identity. Ayhan and Cubukcu (2010) demonstrated that Geographic
Information System (GIS) can be used to explore the distribution of worship places
GIS-based spatial accessibility to Islamic facilities for Muslim community… 51

in the urban areas. GIS has also been used to identify disadvantaged areas and
different aspects of accessibility to different places. A number of studies [12, 13,
14] established that when religions are studied from the geographical perspective,
several concepts are used and comprehended in different ways. These concepts
include access, accessibility, mobility, spatial cluster etc. Numerous studies on
intra-urban accessibility have been conducted in the fields of urban planning,
transportation planning, geography sciences etc. [15]. The purpose of this study is
to explore distribution and spatial accessibility to places of worship (i.e. mosque),
Islamic schools and halal butchers for the Muslim communities in the Melbourne
Metropolitan Area (MMA) using GIS.

2. Related work
After reviewing the previous and current work by geographers relating to religion,
spirituality and faith, four overlapping themes have emerged: spatial distribution,
landscape, social considerations, and cultural aspects of religions reflecting varied
combinations of the topic and its related methodologies [16].The most significant
area of growth in the geographies of religion is influenced by the “cultural turn”. In
geography over the last two decades, the study focused on the cultural dimensions
of political, social and economic processes [17].
It has been stated by [18] that geography’s distinctive contribution lies with the
discipline’s core principles of space, place and scale. The geography of religion
concerns itself with how religious ideologies, sites, institutions, activities,
experiences etc. that are manifested across space, in different places and on a variety
of scales, from corporeal and institutional to geopolitical [18].
Previous studies also involved spatial analysis on the relationship between faith
followers and their places of worship, shopping, dining, education and services, and
religious organizations that provide significant social services to communities [19].
The relationship is established after identifying the extent of service offerings within
such communities, and location characteristics (i.e. similarities or differences), as
against secular community-based organizations, faith-based organizations and
religious congregations that offer services to low-income urban communities [19].
Employing qualitative and quantitative approaches together with survey data from
religious and secular organizations, [19] demonstrated that religious institutions,
specifically places of worship and faith-based organizations, had an important
community attendance in their offerings, presence and locations. These religious
institutions provided a substantial level of service to individuals, and hence operated
as “silent partners” within their communities, providing important, even though
often private, “institutional capital” to local development in urban America [19].
Research in the field of geography, in connection with religion, found that the
consideration of religions, in terms of community space, or buildings and locations,
helps us to understand certain risk factors that may cause conflict within ethnically
diverse societies [20]. The geographical study of religions also explains how
particular social institutions, services, and organisations can use geographic
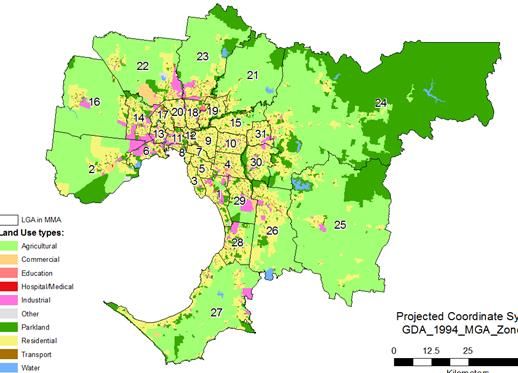
52 Khlood Ghalib Alrasheedi et al.

concepts in religion (sacred sites, temples, churches, etc.) to improve the social
environment and promote the value of tolerance. Through the investigation of some
city’s religious landscapes, it was shown that in addressing the diversity issues, the
urban, socio-cultural and political aspects are interrelated and the exclusion of any
of these aspects from management practices often reduce the opportunity for the
efficiency associated with diverse regulation [20]. Muslim population have
increased tremendously in the past two decades in Australia, mainly because of the
migration as well as natural increase. There were 604,200 Muslims in Australia, of
which 40% were Australian born [21]. This is equal to 2.6% of the total Australian
population, an increase of over 15 percent of its earlier population share of 2.2%,
informed in the previous census 5 years earlier.
The remaining Muslim population is from the 183 countries all around the globe.
This has resulted in Australian Muslims being one of the most ethnically and
nationally heterogeneous religious communities [13, 22]. The study will focus on
Muslim population distribution and will conduct a spatial analysis to investigate the
spatial accessibility to the places of worships and Islamic facilities in the MMA,
Australia.

3. Study area
Melbourne Metropolitan Area (MMA) in Australia was chosen as the study area. It
has a total population of 5 million people, out of which 3.2% are Muslim [2]. MMA
was selected as the study area for the following reasons:

 • The MMA has Islamic facilities across the urban and regional areas, while
 Muslim communities have accessibility to these facilities by cars.
 • The datasets required for the research were available from different
 government, non-government and educational organisations.
The study area is presented including land use, population distribution, the spatial
distribution of Islamic facilities including Islamic schools, mosques and halal
butchers and spatial accessibility to these facilities. The land use is presented to
understand the distribution and clustering of different land types in the MMA. The
distributions of total and Muslim population at Statistical Mesh Block (MB) levels
is also presented, while density (per km2) and ratio of Muslim to total population is
presented at MB level only. Finally, the spatial locations of disadvantaged Muslim
communities in terms of their access to the above-mentioned facilities are also
highlighted. The largest area in the MMA is devoted for agricultural use and
constitutes 48.34% followed by parklands (26.39%) and residential areas (19.35%).
The remaining area of land is used for other purposes including industrial (2.68%),
commercial (1.49 %), education (0.65%), transport (0.26%), water (0.66%) and
other purposes (0.13%) [21]. Figures 1 and 2 highlight that major portion of land
use belongs to residential, agricultural and parklands usages.
GIS-based spatial accessibility to Islamic facilities for Muslim community… 53

 0.13% 26.39%
 Agricultural
 2.68% Commercial
 0.05% 19.35% Education
 0.65% Hospital/Medical
 1.49% Industrial
 0.26% Other
 0.66% Parkland
 Residential
 Transport
 Water
 48.34%

 Figure 1: Percentage of land use in the MMA.

 Figure 2: Land use distribution in the MMA.
54 Khlood Ghalib Alrasheedi et al.

4. Methodology and Data Processing
This research will identify Islamic facilities: mosques, halal butchers, Islamic
schools using GIS techniques. Spatial variations of the Muslim population and the
ratio of the Muslim population to the total population will be mapped to highlight
areas of high and low spatial accessibility to Islamic facilities. The analysis will be
performed at the finest spatial resolution, i.e. Mesh Block (MB) level [23].
Population data will be upscaled from Statistical Area Level 1 (SA1) to MB level
using residential address locations. The high and low spatial accessibility from the
locations of the Muslim population based on the travel distance and travel time to
the Islamic facilities will also be analysed. Finally, the spatial configuration of the
road infrastructure in the MMA will be mapped, including arterial, sub-arterial,
collector and local roads. Thematic maps will be created using ArcGIS 10.4 to
visualize and analyse the variations in Muslim population, densities and Muslim to
total population ratios, spatial accessibility to Islamic facilities, hot spots in terms
of distance and travel time and disadvantaged areas.
It was assumed that the existence of spatial variation in the distribution of
population, Islamic facilities and road infrastructure has influence on the spatial
accessibility to the Islamic facilities. Therefore, it was necessary to analyse spatial
variations in accessibility to Islamic facilities at the finest available spatial
resolution.

4.1 Data Collection and pre-processing data
For measuring and evaluating the spatial accessibility to the Islamic facilities, the
data on Muslim population, locations of the Islamic facilities and road network were
required. The data on population, including various attributes, i.e. age, religion,
were acquired directly from the Australian Bureau of Statistics [21] (see:
http://www.abs.gov.au). The Islamic facility data, including the locations of halal
butchers, Islamic schools and mosques were obtained from the Islamic council of
Victoria (see: http://www.icv.org.au/ ) as a table. The datasets on Local Government
Area boundaries and road networks were downloaded from the Victorian
Government database (see: https://www.data.vic.gov.au) in vector format.

4.2 Geocoding locations of Islamic facilities
The data for the mosques, Islamic schools and halal butchers were processed in an
Excel spread sheet and further geocoded to allow its use in a GIS environment. It is
necessary to have street address and reference datasets for geocoding [24].
Moreover, the correct spelling of addresses was checked to avoid errors in
geocoding [24]. Chan et al. (2014) theorized and demonstrated two steps for the
geocoding process as Pre-processing and Matching. After collecting the data from
their respective sources, each address was checked in Google maps in Google Street
view (https://www.google.com.au/map/) to verify addresses retrieved were the
actual addresses and street photos.
GIS-based spatial accessibility to Islamic facilities for Muslim community… 55

This verification is an additional precaution taken to get error free data. Some of the
addresses extracted from the sources did not exist, and thus were removed from the
database.
The website (http://mynasadata.larc.nasa.gov/latitudelongitude-finder) was further
used as a tool to convert address layer information into corresponding latitude and
longitude coordinates for the Islamic facilities.

4.3 Mapping the spatial distribution of the Muslim population
The ABS in Australia is the nation’s statistical agency and served as a source of
population data used in this study. These data were available at various spatial levels.
The population data for 2016 were downloaded at the finest available resolution, i.e.
SA1 level. The availability of address data and MB level spatial units made the
estimation of spatial accessibility at a much finer resolution possible. In this study,
the 2016 SA1 level population data were disaggregated into their corresponding MB
units. The merits of conducting such intricate spatial analysis at a much finer
resolution of MB rests with the research focus, which can be performed explicitly
for residential areas [14].
There are numerous methodologies for spatial data disaggregation. This research is
focusing on interpolating data using the address-weighted method to disaggregate
population data from SA1 to MB level in MMA. There were two assumptions made
for the creation of the disaggregated population datasets:

 • The population distribution is even among residential addresses within the
 SA1 layer.
 • There is variation of population across urban space, the density of
 cumulative residential address points can be considered and recognized as
 proxies for the given population density.

The equations used for disaggregation of the 2016 SA1 level population to their
corresponding MB units are given below [14]:

 = (1)
 1 1

 = 1 = ∑ 1 (2)
 1 =1

MBpi is the population of residential MBi, SA1p is the population of the SA1 that
contains MBi, MBaddi is the number of residential address points that are located
within MBi, SA1add is the number of residential address points located within the
SA1 that contains MBi.
56 Khlood Ghalib Alrasheedi et al.

The above-mentioned analysis was performed separately for Islamic and total
population in the MMA. In addition, the densities of Islamic and total population
and their ratios were calculated.

The population density was calculated as:

 = (3)

The ratio of the population was calculated as:

 = (4)

The information that was extracted using the above-mentioned calculations was
mapped to demonstrate spatial variations of total Muslim populations, density and
the Muslim to total population ratio.

4.4 Measuring spatial accessibility to Islamic facilities
Two road network datasets were available for this study. The first was complete
containing all road types, and the second was missing some minor roads, but
contained information on speed limits. After performing spatial adjustment
procedures using Transfer Attributes function in ArcGIS, speed limit attributes were
transferred to the complete road network dataset. Road network was further refined
by removing bicycle paths, walking tracks and proposed roads, as we were
interested in car accessibility only. The speed limits for road segments with missing
speed sign attributes were calculated by averaging speed signs per road type, as
follows: freeways: 93km/h, highways: 78km/h, arterial roads: 70km/h, sub-arterial
roads: 70km/h, collector roads: 56km/h, local roads: 52km/h, 2WD tracks: 83km/h
and 4WD tracks: 99km/h. As average speed limits for 2WD and 4WD tracks were
unreasonable, we defaulted them to 60 km/h. In order to ensure that all the roads
were connected, we also processed it through the Integrate tool in ArcGIS 10.4. The
final road network was also Split at Vertices to ensure snapping of MB centroids in
the network Analyst (ArcGIS 10.4). It is also important to note that in this study
such factors as the road condition and congestion times were ignored.
The shortest network distance and travel time were measured from the centre of
each MB to the closest facility. The distance was measured in metres, while travel
time was calculated in minutes. Firstly, the measurement of travel distance was
calculated using network Analyst capabilities. The spatial accessibility in terms of
distance was further categorized into the following five classes: 16,000m. Secondly, the conversion of travel
distances to travel time was carried out using the speed limit sign information. The
following formula was used to calculate travel time:
GIS-based spatial accessibility to Islamic facilities for Muslim community… 57

 ( )
 = ∗ ( ) (5)
 ( )∗1000 ℎ
 ℎ

Then, the travel times to mosques, halal butchers and Islamic schools was also
transformed into the following five classes: 20min using Python capabilities in the field calculator of ArcGIS using the
following expression (in this example for mosques):

4.5 Conducting Hot Spots analysis based on travel time and travel distance
The Hot Spot Analysis tool in ArcGIS calculates the Getis-Ord Gi* statistic
(pronounced G-i-star) for each feature in a dataset. To be considered as a hot spot
which is statistically significant, it must be surrounded with areas of high values as
well. The sum of the local values for a feature and its neighbours is compared
equally to the sum of all features.
Cluster analysis was based on hot spot analysis (Getis-Ord Gi*) implemented in
ArcGIS Spatial Statistics toolbox [25]. Hot spot analysis was performed for both
Muslim to the total population ratio as well as spatial accessibility to Islamic
facilities in terms of distance and travel times.

Identifying disadvantaged locations
In order to identify areas of disadvantaged Muslim populations, we overlaid spatial
clusters of MBs with high Muslim to total population ratio, i.e. high ratio of Muslim
population, with clusters of MBs with high travel times and distances to Islamic
facilities, i.e. low spatial accessibility. The Intersect tool from ArcGIS 10.4 was
58 Khlood Ghalib Alrasheedi et al.

used to perform this procedure of hot spots of Muslim to total population ratio and
spatial accessibility to Muslim facilities. Then disadvantaged areas were grouped
into seven categories, such as disadvantaged in terms of accessibility to (1)
mosques, (2) halal butchers, (3) Islamic schools. This research discusses the
methods and techniques used to analyse spatial accessibility to the Islamic facilities
for Muslim communities living in the MMA using ArcGIS 10.4. The step-by-step
methodology of this research is presented in the flowchart (Figure 3).

 Figure 3: Flow chart describing the methodology used in this study.

5. Results and Discussion
The land use is presented in order to understand the distribution and clustering of
different land types in the MMA. The distributions of total and Muslim populations
at Statistical Area Level 1 (SA1) and Mesh Block (MB) levels are also presented,
while density (per km2) and ratio of Muslim to total population is presented at MB
level only. Finally, the spatial locations of disadvantaged Muslim communities in
terms of their access to the above-mentioned facilities are also highlighted.
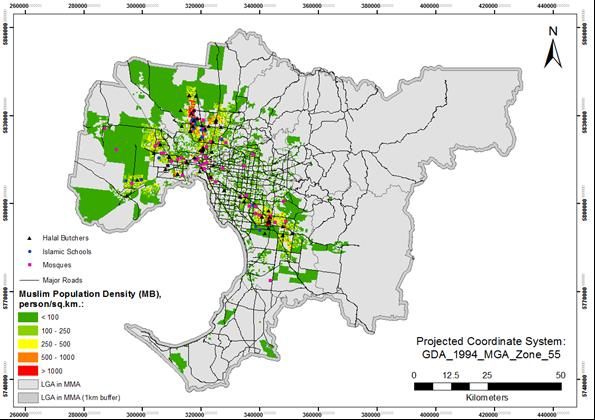
GIS-based spatial accessibility to Islamic facilities for Muslim community… 59

5.1 Muslim population density at MB level
The Muslim population density (persons/km2) in the study area was calculated and
mapped in Figures 4 and 5.

 Figure 4: Muslim population density based at MB level.
60 Khlood Ghalib Alrasheedi et al.

 Figure 5: Spatial distribution of Islamic facilities in the MMA.
Figures 4 and 5 show the Muslim population density distribution at MB level with
less than 100 to more than 1,000 persons/km2. First and second density classes (less
than 250 persons/km2) are the most common and are scattered all over the MMA
with large clusters in the northern, western and south-western parts of the MMA. In
contrast, second, to fifth classes, with densities of more than 250 persons/km2, are
predominantly distributed in the northern, western and south-eastern parts of the
MMA with insignificant occurrence in other areas. The locations of densely
populated Muslim MBs are similar to those of Muslims in total populations (Figure
4), and thus both could be used for identification of hot spots of highly populated
areas.

5.2 Spatial distribution of Islamic facilities in the MMA
Islamic facilities data were retrieved from the Islamic Council of Vitoria website
(http://www.icv.org.au/). The locations of the Islamic facilities were geocoded
using the address layer of the VicMap database and verified using Google Map and
high-resolution aerial images accessible through ArcGIS base maps. The travel time
calculation, was carried out based on travel distance model by car. Figure 2 shows
the distributions of 65 halal butchers, 14 Islamic schools and 60 mosques, Muslim
population density and the major roads in the MMA.
GIS-based spatial accessibility to Islamic facilities for Muslim community… 61

From Figure 5 the Melbourne city and Port Phillip, northern suburban areas (i.e.
Moonee valley, Moreland and Hume) and south-eastern suburban areas (i.e. Greater
Dandenong) have the majority of halal butchers, Islamic schools and mosques.
These areas also correspond to the most densely populated regions. There are also
Islamic services and facilities in the Western suburbs (i.e. Hobsons bay,
Maribyrnong and Brimbank). There are few facilities in Melton, Wyndham,
Werribee, Point Cook and Tarneit, while the furthest mosque from the Melbourne
CBD is at Frankston. Travel distances in metres from the MB centroids to the
mosques were classified into five categories (Figure 6).

 Figure 6: Spatial accessibility to mosques in terms of travel distance.

The first distance class represents areas of less than 3,000 m from the MB centroids
to the mosques. These areas are indicated by dark green, and are in the northern,
western and south-eastern areas of the MMA, and correspond to the locations of the
mosques. The second, third and fourth classes are evenly distributed away from the
mosque locations, and represent MBs within 3,000-6,000 m, 6,000-9,000 m and
9,000-16,000 m of the mosques, respectively. The fifth class in red corresponds to
areas located the furthest away (>16,000 m) from the mosques, which is mainly
located at the outskirts of the MMA.
62 Khlood Ghalib Alrasheedi et al.

5.3 Spatial accessibility to Islamic facilities based on travel time
The second parameter used for determining spatial accessibility is based on travel
time. For the calculation of travel time various variables such as congestion zones
as well as parking time were ignored.

Travel time to mosques
Travel time (in minutes) by car to reach the closest mosque from MB centroids is
presented in Figure 7. Similarly, to the travel distance, the travel times were
classified into five categories.

 Figure 7: Spatial accessibility to mosques in terms of travel time.

The first and second classes corresponds to the areas with travel times less than 10
minutes. These areas indicated by green and are mainly found in the Northern,
western and south-eastern areas of the MMA. These areas have the best accessibility
to mosques in the MMA. The third, fourth and fifth classes in yellow, orange and
red correspond to travel times of more than 10 minutes. These areas are
concentrated on the outskirts of the MMA, and are mainly scattered as minor
patches in the outer northern, south-eastern and southern regions of the MMA.
GIS-based spatial accessibility to Islamic facilities for Muslim community… 63

Clustering of Muslim to total population ratio
To identify regions with highly populated MBs. the hot spot analysis of Muslim to
total population ratio showed a substantial part is occupied by the Muslim
population. Cold and hot spots are characterized by the ratio of Muslim populations
to total populations having negative and positive numbers, respectively.
As can be seen in Figure 8, cold spots are scattered in the outskirts of the MMA,
while hot spots are concentrated mainly in the south-eastern and north-western
regions of the MMA. Hot spots represent clusters where there are significant
Muslim populations, whereas cold spots represent areas where the Islamic
population is very low compared to the total population. It can be seen that most
Muslims live in the hot spots (62%), while the Muslim population that lives in cold
spots is very low (0.1%). However, there are 5639 MBs (21.7%) in hot spots,
whereas there are 7641 MBs (29.4 %) in cold spots. The area of hot spots is also
substantially lower than that of cold spots (594km2 vs 1554km2).

 Figure 8: Clustering of Muslim to total population ratio in the MMA.
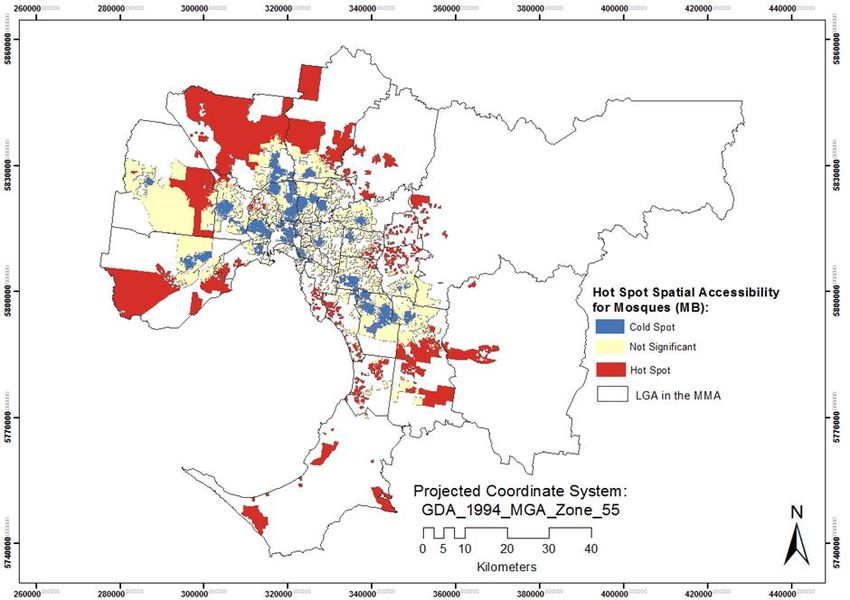
64 Khlood Ghalib Alrasheedi et al.

Clustering of travel time spatial accessibility to mosques
Figure 9 shows clustering of spatial accessibility to mosques in terms of travel time.
It is evident that cold and not-significant spots are in the inner sides of the MMA,
while hot spots are predominantly located in the North-Western and South-Western
parts of the MMA.

Figure 9: Hot spot analysis of spatial accessibility to mosques based on travel
 time.
Hot spots of spatial accessibility to mosques refer to areas with high travel times,
while cold spots refer to areas with low travel times. The hot spots account for an
area of 908km2 covering 4901MBs, which is substantially higher in comparison
with the cold spot areas which occupy 201km2 and cover 7074MBs. Cold, not
significant and hot spots account for 42%, 47% and 12% of the total Islamic
population, respectively.
The distributions of cold and hot spots are like that of Islamic Schools. However,
cold spots are much more localised around mosques and occupy a smaller area.

5.4 Identifying disadvantaged Muslim communities
Disadvantaged areas are defined as areas with low spatial accessibility to closest
Muslim facilities and high Muslim to total population ratios. Figure 10 shows these
disadvantaged locations based on travel time by car. On average disadvantaged
locations are located 9.3 minutes, 11.2 minutes and 15.1 minutes from mosques,
GIS-based spatial accessibility to Islamic facilities for Muslim community… 65

halal butchers and Islamic schools, respectively.
Figure 10 shows disadvantaged locations of low spatial accessibility in terms of
travel time and high Muslim populations to various Islamic facilities. The
disadvantaged locations can be mainly found in the northern and north-western
areas of the MMA. As it can be seen, most of the disadvantaged population in the
northern regions have difficulty accessing mosques and Islamic schools, and in the
north-west they have difficulty accessing Islamic schools and halal butchers.
Similarly, disadvantaged locations of low spatial accessibility in terms of travel
distance and high Muslim populations are presented in figure 10. Disadvantaged
areas represent locations within MMA where there is a high proportion of Muslims
with low spatial accessibility to essential facilities reside. On average disadvantaged
locations are located 9093m, 11530m, 14988m from mosques, halal butchers and
Islamic schools, respectively.

Figure 10: Disadvantaged locations of Muslim populations in terms of travel
 time accessibility.
66 Khlood Ghalib Alrasheedi et al.

6. Conclusions and outlook
This research provides an insight into Muslim population distribution and spatial
accessibility in terms of travel distance and time to Islamic facilities in the MMA.
GIS confirmed to be a robust approach to extract accurate information on spatial
accessibility. This study also highlighted the most affected Muslim communities in
terms of spatial accessibility, which are in Hume, Whittlesea, Melton and Casey
suburbs. It is also clear that there is a lack of mosques and Islamic schools in the
MMA, with approx. 5,000 Muslims not having convenient access to this kind of
facility. The findings of this study could be used by Muslim communities when
choosing a suburb for their families. The urban and regional planners could also use
the findings of this research while considering the development of Islamic facilities.

References
[1] Nayak, A. (2012). Race, religion and British multiculturalism: The political
 responses of Black and Minority Ethnic voluntary organisations to
 multicultural cohesion. Journal of Political Geography, 31, 7, pp.454-463.
[2] Australian Bureau of Statistics (2017). 2016 Census data reveals “no religion”
 is rising fast (http://www.abs.gov.au/).
[3] Bonne, K., and Verbeke, W. (2008). Muslim consumer trust in halal meat
 status and control in Belgium. Meat science, 79, 1, pp.113-123.
[4] Ahmad, I., and Szpara, M. Y. (2003). Muslim children in urban America: The
 New York city schools experience. J. of Muslim Minority Affairs, 23, 2,
 pp.295-301.
[5] Woodlock, R. (2010). Praying where they don't belong: female muslim
 converts and access to mosques in Melbourne, Australia. Journal of Muslim
 Minority Affairs, 30, 2, pp.265-278.
[6] Muñoz, S. A. (2010), Geographies of faith: the differing residential patterns of
 the Indian‐Hindu, Indian‐Sikh and Indian‐Muslim populations of Dundee and
 Glasgow. J. Population, space and place, 16, 4, pp.269-285.
[7] Beckford, J. A. (2019). Religions and migrations–old and new. J. Quaderni di
 Sociologia, pp.15-32. https://doi.org/10.4000/qds.2599
[8] Mourad, H. (2009). The development and land use impacts of local mosques. B.
 Planningthesis, Unpublished. Sydney: The University of New South Wales.
 https://www.be.unsw.edu.au/sites/default/files/upload/pdf/schools_and_enga
 gement/resources/_notes/5A4_5.pdf
[9] Khan, A. A. (1992). An integrated approach to measuring potential spatial
 access to health care services, J. Socio-economic planning sciences, 26, 4,
 pp.275-287.
[10] Nayak, A. (2012). Race, religion and British multiculturalism: The political
 responses of Black and Minority Ethnic voluntary organisations to
 multicultural cohesion. J. Political Geography, 31, 7, pp.454-463.
GIS-based spatial accessibility to Islamic facilities for Muslim community… 67

[11] Ayhan, I., and Cubukcu, K. M. (2010). Explaining historical urban
 development using the locations of mosques: A GIS/spatial statistics-based
 approach. J. Applied Geography, 30, 2, pp.229-238.
[12] Allan, D. P. (2014). Catchments of general practice in different countries–a
 literature review. International J. of health geographics, 13, 1, 32.
[13] Ball, W., and Beckford, J. A. (2018). Religion, education and city politics: A
 case study of community mobilisation. In Jewson N. and Macgregor S.
 (Editors), Transforming Cities, part 4, chapter 14 (pp.193-204). Taylor and
 Francis Group, Routledge. ISBN: 9781351169486
[14] Ahmad, S. (2012). A GIS based investigation of spatial accessibility to health
 care facilities by local communities within an urban fringe area of Melbourne.
 Master Thesis, Mathematical and Geospatial Sciences, RMIT University,
 Melbourne, Australia.
[15] Geurs, K., Zondag, B., De Jong, G., and de Bok, M. (2010). Accessibility
 appraisal of land-use/transport policy strategies: More than just adding up
 travel-time savings. J. Transportation Research Part D: Transport and
 Environment, 15, 7, pp.382-393.
[16] Kumar, D., Singh, A., Jha, R. K., Sahoo, S. K., and Jha, V. (2018). Using
 spatial statistics to identify the uranium hotspot in groundwater in the mid-
 eastern Gangetic plain, India. J. Environmental Earth Sciences, 77, 19, 702.
[17] Bisin, A., Patacchini, E., Verdier, T., and Zenou, Y. (2008). Are Muslim
 immigrants different in terms of cultural integration?. J. the European
 Economic Association, 6, 2-3, pp.445-456.
[18] Holloway, J. and Valins, O. (2002). Editorial: Placing religion and spirituality
 in geography. J. Social & Cultural Geography 3,1, 5-9. DOI:
 10.1080/14649360120114107
[19] Botchwey, N. D. (2007). The religious sector's presence in local community
 development. J. Planning Education and Research, 27, 1, pp.36-48.
[20] Yang, F., and Ebaugh, H. R. (2001). Religion and ethnicity among new
 immigrants: The impact of majority/minority status in home and host
 countries. J. the scientific study of religion, 40, 3, pp.367-378.
[21] Australian Bureau of Statistics (2011). Census of Population and Housing
 2006 and 2011. Australian Bureau of Statistics ABS, Canberra.
 https://www.abs.gov.au/ausstats/abs@.nsf/ViewContent?readform&view=pr
 oductsbyCatalogue&Action=Expand&Num=2.1
[22] Akbarzadeh, S. (2001). Unity or fragmentation? In Saeed, A. and Akbarzadeh
 S. (Eds.), Muslim Communities in Australia, Sydney NSW Australia:
 University of New South Wales Press Ltd., pp. 228 - 234. ISBN:0868405809
[23] Mavoa, S., Witten, K., McCreanor, T., and O’sullivan, D. (2012). GIS based
 destination accessibility via public transit and walking in Auckland, New
 Zealand, J. Transport geography, 20, 1, pp.15-22.
68 Khlood Ghalib Alrasheedi et al.

[24] Chan, D. V., Gopal, S., and Helfrich, C. A. (2014). Accessibility patterns and
 community integration among previously homeless adults: A Geographic
 Information Systems (GIS) approach. Social Science & Medicine, 120,
 pp.142-152.
[25] Kong, L. (2010). Global shifts, theoretical shifts: Changing geographies of
 religion. J. Progress in Human Geography, 34, 6, pp.755-776.
You can also read