8 Social Baseline - Transport and Main Roads
←
→
Page content transcription
If your browser does not render page correctly, please read the page content below
8 Social Baseline
AECOM                                               Gladstone Port Master Planned Area
                                                    Evidence Base Report for the Proposed Gladstone Port Master Planned Area

8.0             Social Baseline
      8.1           Context
The primary intent of this section is to provide a social baseline and identify the community
and social values of the port and surrounding areas. The proposed Gladstone port master
planned area and its surrounds contain significant features of social amenity and cultural
importance for both the local community and the traditional owners of the land. Gladstone
relies heavily on the strength of its resources and industrial sector. The community therefore
identifies strongly with industrial activities and the employment opportunities that it provides.
The community also places significant value on the region’s natural assets with the popularity
of recreational activities such as fishing and boating reflecting the community’s interest in
upholding existing environmental values.

      8.2           Residential communities
Table 24 identifies communities that are either located within or in close proximity to the
proposed Gladstone port master planned area.
Table 24      Residential communities located within or adjacent to the proposed Gladstone port master planned area

Name of community               Location                         Description and issues
                   Residential communities located within the proposed port master planned area

Facing Island                   Facing Island is located         The island has three communities with a small permanent
(including Farmers              approximately 11 km east         population of approximately 30 residents. The island has
Point, Northcliffe and          from Gladstone mainland          designated camping areas and is recognised for its
Gatcombe)                       and the Gladstone CBD.           recreational and environmental values.
                                                                 It is unlikely that there would be any encroachment from
                                                                 port related activity on Facing Island.

             Residential communities located partially within the proposed port master planned area

Barney Point                    Barney Point is located          Barney Point is a residential community of approximately
                                                                                  147
                                approximately 2km east           1,156 residents located immediately adjacent to Port
                                of the Gladstone CBD             Central.
                                and immediately adjacent         The interface between Barney Point and port activities
                                to Port Central. It is noted     located immediately adjacent to the residential locality is a
                                that only part of the            critical land use consideration.
                                residential locality is
                                located within the
                                proposed master planned
                                area boundary.

Gladstone Central               Gladstone Central is             Gladstone Central is the CBD that services the greater
                                located near the mouth of        Gladstone area. The CBD has a wide range of community
                                Auckland Creek                   services and primary social infrastructure facilities
                                alongside Hanson Road.           including the Gladstone Hospital. Approximately 1529
                                It is noted that a small         residents reside within the suburb of Gladstone Central.
                                proportion of Gladstone          Gladstone Central has an interface with the Gladstone
                                Central falls within the         Marina and Auckland Point Wharves. The issues of
                                proposed master planned          residential air quality and visual amenity are therefore
                                area boundary.                   important factors to consider in the context of the future
                                                                 port activity within close proximity of Gladstone central.

147
      Australian Bureau of Statistics 2011, Census of Population and Housing

                                                                                                                               131
AECOM                                     Gladstone Port Master Planned Area
                                          Evidence Base Report for the Proposed Gladstone Port Master Planned Area

Name of community         Location                     Description and issues
        Residential localities located within close proximity to the proposed port master planned area

Boyne Island/Tannum       Boyne Island/Tannum          Boyne Island/ Tannum Sands is a residential community of
Sands                     Sands is located             approximately 9350 residents located either side of the
                          approximately 15km SSE       mouth of the Boyne River. The locality has a range of
                          of Gladstone Central.        facilities of significant social value including schools,
                                                       medical centres, churches, childcare centres and open
                                                       space/ recreation areas.
                                                       The broader social issue of increasing pressure on existing
                                                       social infrastructure within this locality needs to be closely
                                                       considered in the context of significant population growth.

Mount Larcom              Approximately 35km west      The suburb of Mount Larcom comprised 278 residents and
                          of the Gladstone CBD,        134 dwellings as at the 2011 Census within a low
                          adjacent to the GSDA         density/rural residential setting.
                                                       The township itself is located approximately 700m to the
                                                       north-west of the GSDA boundary.
                                                       There are unlikely to be any overt impacts to the residential
                                                       community of Mount Larcom resulting from development
                                                       within the proposed Gladstone port master planned area.

Southend                  Approximately 11km           Southend is a small settlement on the southern tip of Curtis
                          NNE of the Gladstone         Island with basic community facilities. Curtis Island is
                          CBD on the south             recognised for its environmental values with the Curtis
                          eastern tip of Curtis        Island National Park making up a vast proportion of the
                          Island                       Island’s area.

Yarwun                    Approximately 9km SSW        Yarwun is a small residential community of approximately
                          of Fisherman’s Landing       239 people based around the Yarwun Railway Station.
                          and 13km west of the         Social and community infrastructure includes Yarwun State
                          Gladstone CBD                School and an Australian Post Office. The township is
                                                       located immediately adjacent to the proposed boundary for
                                                       the proposed Gladstone port master planned area. The
                                                       Gladstone Planning Scheme does not accommodate for
                                                       any outward expansion of the township within the vicinity of
                                                       the draft port master planning boundary.

    8.3         Social baseline study
8.3.1        Assessment methodology
The existing social baseline study has been derived through a desktop review of a range of
existing resources including:
-   state government guidelines
-   planning and development schemes
-   publications
-   studies
-   current and completed Environmental Impact Statements for major projects within the
    Gladstone region.
Data relating to demography, housing/accommodation and employment/training has been
sourced primarily from the Australian Bureau of Statistics (ABS), the Queensland
Government Statistician’s Office and Gladstone Regional Council’s Community Profile. The
potential cumulative impacts of the ongoing operation and expansion of existing and planned

                                                                                                                     132
AECOM                                              Gladstone Port Master Planned Area
                                                   Evidence Base Report for the Proposed Gladstone Port Master Planned Area

activities within the Gladstone region have been assessed including local and regional
impacts on:
-     population and demography
-     workforce participation and employment
-     housing and accommodation.
8.3.2         Population and demography
Gladstone is one of the fastest growing LGAs in Queensland with strong non-resident
population increases supplementing steady residential growth. Based on the Queensland
Government Statistician’s Office’s (QGSO) most recent population estimate in June 2014,
Gladstone (LGA) had an estimated resident population (ERP) of 65,845 and a non-resident
workers on-shift population of 6,655 which totalled a full-time equivalent (FTE) population of
72,500 persons.148
Table 25 highlights the fact that the proportion of non-residential workers on-shift has been
steadily increasing as a proportion of the FTE population of Gladstone with the proportion
increasing from two per cent of the total in June 2011 to nine per cent of the total in June
2014.
Table 25     Gladstone (LGA) population estimate, June 2014

                        2011               2012                2013                2014                Change, 2013 to 2014

                                                   -Number-                                          -Number-                 -%-

Estimated
resident               59,460             61,465              63,955              65,845               1,890                  +3
           149
population

Non-resident
workers on-             1,205              3,615               4,890               6,655               1,770                  +36
shift

FTE
population             60,665             65,080              68,845              72,500               3,655                  +5
estimate

                                                                -%-

Estimated
resident                  98                 94                  93                  91                  —                    —
population

148
  Queensland Government Statistician’s Office, Queensland Treasury and Trade 2014a, Gladstone region non-resident
population projections 2014 to 2020.
149
    ABS estimates, 2011 to 2013; QGSO estimate, 2014a. Source: ABS 3218.0, Regional Population Growth, Australia, 2012-
13; QGSO estimates

                                                                                                                                    133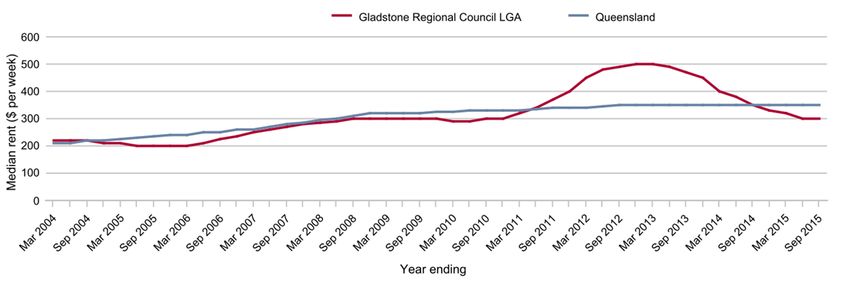
AECOM                                             Gladstone Port Master Planned Area
                                                  Evidence Base Report for the Proposed Gladstone Port Master Planned Area

                        2011               2012                2013               2014                Change, 2013 to 2014

Non-resident
workers on-               2                  6                   7                   9                  —                    —
shift

FTE
population               100                100                100                 100                  —                    —
estimate

Population projections
The estimated resident population of the Gladstone LGA is forecast to nearly double from
65,845 in 2014 to 121,266 in 2036 (Queensland Government medium series population
projections, 2013 edition). The average annual growth rate of Gladstone LGA between 2011
and 2036 is estimated to be 2.9 per cent which is one per cent greater than the Queensland
estimate.
Table 26     Gladstone (LGA) Medium series population projections

                                                                                                                         Average
                                                                                                                         annual
LGA/State                                                 As at 30 June
                                                                                                                         growth
                                                                                                                           rate

                      2011(a)           2016            2021            2026              2031            2036          2011-2036

                                                              -number-                                                        %

Gladstone              59,461          70,098          83,424          96,107            108,582        121,266              +2.9

Queensland           4,476,778       4,946,319       5,477,082        6,007,578       6,548,220        7,095,177             +1.9

Indigenous population
The number of Indigenous persons in Gladstone LGA as at the 2011 Census of Population
and Housing was 2,049 persons (3.5 per cent of the LGA’s population). This is on par with
the percentage of Indigenous persons that make up the residential population of
Queensland.
Indigenous social and cultural characteristics including native title rights and interests are
discussed in Section 9—Cultural Heritage.

                                                                                                                                    134
AECOM Gladstone Port Master Planned Area
Evidence Base Report for the Proposed Gladstone Port Master Planned Area
Table 27 Indigenous status, GRC LGA and QLD, 2011150
LGA/State Indigenous persons
Non-Indigenous Total
Torres
persons persons
Aboriginal Strait Both Total
Islander
-number- -number- % number % number
Gladstone 1,728 133 188 2,049 3.5 51,828 89.5 57,890
Queensland 122,896 20,094 12,834 155,824 3.6 3,952,707 91.2 4,332,740
Age structure
Figure 20 compares the service age structure of the Gladstone LGA with that of Regional
Queensland and is derived from the 2011 ABS census of population and housing151.
The service age groups structure of Gladstone illustrates that the Gladstone LGA has a
higher proportion of persons in the younger service age group categories compared to
Regional Queensland, most notably in the babies and pre-schoolers, primary schoolers, the
young workforce and parents and homebuilders categories. In contrast, Gladstone LGA has
a significantly smaller proportion of residents in the seniors and elderly aged categories.
As the large proportion of the population (21 per cent) transition from the ‘parents and
homebuilders’ service age groups to the older service age groups, it is likely that an
increasing amount of pressure will be put on the capacity of social infrastructure such as
hospitals and other aged care services.
Age Structure - service age groups, 2011
Elderly aged (85 and over)
Seniors (70 to 84)
Service age group (years)
Empty nesters and retirees (60 to 69)
Older workers and pre-retirees (50 to 59)
Parents and homebuilders (35 to 49)
Young workforce (25 to 34) Regional QLD
Tertiary education and independence (18 to 24) %
Secondary schoolers (12 to 17) GRC area %
Primary schoolers (5 to 11)
Babies and pre-schoolers (0 to 4)
0.0 5.0 10.0 15.0 20.0 25.0
% of the population
Figure 20 Age structure - service age groups, 2011.
150
ABS, Census of Population and Housing, 2011, Indigenous Profile – IO2 (usual residence) and QLD Treasury and Trade
estimates)
151
ABS, Census of population and housing, 2011 (Usual residence data)
135AECOM Gladstone Port Master Planned Area
Evidence Base Report for the Proposed Gladstone Port Master Planned Area
8.3.3 Workforce participation, employment and diversity profile
Non-resident workers
The working population of Gladstone is strongly dependent on the resources sector with over
5,200 full-time employees and contractors having been employed in alumina refining,
aluminium smelting, cement and chemicals production, rail transport and coal export
operations in 2014.
Over the last five years, the workforce of Gladstone has grown significantly as a result of new
resource-related projects including a new coal export terminal (Wiggins Island Coal
Terminal), three LNG processing plants on Curtis Island, port dredging and the construction
of associated electricity and rail infrastructure. Workers involved in the construction of these
projects include a high proportion of FIFO/DIDO workers who increase the area’s on-shift
population significantly.152
As the LNG projects transition from the construction phase to operations during 2015, the
size of the non-residential workforce will decrease significantly in Gladstone (refer to Figure
21) with the operational workforces of the LNG plants and port projects to be considerably
smaller than the construction workforces.153 It is noted that a significant proportion of the
construction workforce have based their families in Gladstone and pursue FIFO/DIDO
projects throughout the state and nation when there is a downturn in local demand.
Figure 21 Past and projected non-resident workers on-shift, Gladstone (R).154
Series A projection is based on the number of non-resident workers on-shift who were engaged in existing resource operations
and associated infrastructure activities in the area at June 2014. The projection takes into account future changes to those
operational workforces as advised by resource company sources, as well as the estimated non–resident construction and
operational workforces of Category A projects [(i.e. those that had reached final investment decision (FID)] at the time of
preparation.
Series B projection includes the Series A projection plus projected growth in the non-resident population arising from Category
B projects (those that have an EIS approved but have yet to reach FID).
152
Queensland Government Statistician’s Office, Queensland Treasury and Trade 2015, Gladstone region non-resident
population projections 2015 to 2021.
153
Queensland Government Statistician’s Office, Queensland Treasury and Trade 2015
154
QGSO, survey of accommodation providers, 2011 to 2014; QGSO, Non-resident population projections, 2015 to 2021
136AECOM Gladstone Port Master Planned Area
Evidence Base Report for the Proposed Gladstone Port Master Planned Area
Series C projection includes the Series A and B projections, plus the projected growth in the non-resident population arising
from Category C projects (those that have lodged an EIS, but have yet to proceed through to final approval).
Unemployment
- Gladstone LGA’s estimated labour force as at June 2015 was 35,879 (54 per cent of the
population).
- The estimated unemployment rate in the Gladstone LGA at June quarter 2015 was 5.4
per cent, in comparison to Queensland’s rate of 6.5 per cent (Australian Government
Department of Employment, Small Area Labour Markets Australia). The comparatively
low unemployment rate for Gladstone can be largely attributed to the current strength of
the construction and resources industry and the associated performance of the
manufacturing industry.
- The operation and expansion of industrial and business activities within the proposed
Gladstone port master planned area is critical to ensure that workforce participation
remains high in Gladstone and unemployment stays at its current low rate. This is
particularly important in the context of major regional projects transitioning from the
construction phase to the operational phase.
Employment by industry
- Data derived from the 2011 Census of Population and Housing indicates that the top
industry of employment with the Gladstone LGA is manufacturing (17 per cent). This is in
comparison 7.6 per cent for Regional Queensland (refer to Figure 22).155
- Other notable industries of employment include the construction industry (13.8 per cent),
retail trade (9.5 per cent) and the transport, postal and warehousing industry (7.7 per
cent).
- The abovementioned industries are strongly aligned with the operation of the Port of
Gladstone. The management and sustained growth of these industries within the
proposed Gladstone port master planned area is therefore an integral consideration in
fostering the continued economic performance of the wider Gladstone area.
- Conversely, the industries of health care/social assistance (6.4 per cent) and
education/training (7.7 per cent) in Gladstone represent comparatively low industries of
employment in comparison to Regional Queensland.
155
ABS, Census of Population and Housing, 2011 (Usual residence data)
137AECOM Gladstone Port Master Planned Area
Evidence Base Report for the Proposed Gladstone Port Master Planned Area
Industry sector of employment, 2011
Inadequately described or not stated
Other Services
Arts and Recreation Services
Health Care and Social Assistance
Education and Training
Public Administration and Safety
Administrative and Support Services
Industry (2011 ANZSIC)
Professional, Scientific and Technical Services
Rental, Hiring and Real Estate Services
Financial and Insurance Services
Information Media and Telecommunications Regional QLD %
Transport, Postal and Warehousing
GRC area %
Accommodation and Food Services
Wholesale trade
Retail Trade
Construction
Electricity, Gas, Water and Waste Services
Manufacturing
Mining
Agriculture, Forestry and Fishing
0.0 2.0 4.0 6.0 8.0 10.0 12.0 14.0 16.0 18.0
% of employed persons aged 15+
Figure 22 Industry sector of employment, 2011.
Occupation of employment
A comparatively high proportion of Gladstone’s resident workforce is employed as
technicians and trade workers (22.4 per cent) compared to 16.3 per cent for regional
Queensland (refer to Figure 23). Other notable occupations that make up a significant
proportion of the Gladstone workforce include machinery operators and drivers (13.7 per
cent) and labourers (12.9 per cent). It is surmised that the higher proportion of workers filling
the abovementioned roles in comparison to regional Queensland is associated with the
construction and operation of large resource and infrastructure projects.
138AECOM Gladstone Port Master Planned Area
Evidence Base Report for the Proposed Gladstone Port Master Planned Area
Occupation of employment, 2011
Inadequately described
Labourers
Occupation (2011 ANZSIC)
Machinery Operators And Drivers
Sales Workers
Clerical and Administrative Workers
Regional QLD %
Community and Personal Service Workers
GRC area %
Technicians and Trades Workers
Professionals
Managers
0.0 5.0 10.0 15.0 20.0 25.0
% of employed persons aged 15+
Figure 23 Occupation of employment, 2011.156
8.3.4 Housing and accommodation
The anticipated growth in Gladstone LGA’s population is expected to place significant
pressure on the supply of the local housing market to meet the future demand within the
region. In turn, housing affordability will become a critical social issue. It is evident that
Gladstone (R) has a comparatively higher proportion of occupied private dwellings that are
being purchased (39.9 per cent) in comparison to Queensland (34.5 per cent) as indicated by
Table 28 below.
Table 28 Occupied private dwellings (a) by tenure type, Gladstone LGA and Queensland, 2011 157
Being purchased
LGA/State Fully owned Rented (c) Other (d) Total (e)
(b)
number % number % number % number % number
Gladstone (R) 5,204 26.8 7,752 39.9 5,891 30.4 80 0.4 19,405
Queensland 448,617 29.0 533,868 34.5 513,415 33.2 14,304 0.9 1,547,303
(a) Excludes visitors only and other not classifiable households.
(b) Includes dwellings being purchased under a rent/buy scheme.
(c) Includes renting from a real estate agent, state housing authority, person not in the same household, housing co-
op/community/church, other and not stated.
156
ABS, Census of Population and Housing, 2011 (Usual residence data)
157
ABS, Census of Population and Housing, 2011, Basic Community Profile – B32 (occupied provide dwellings) and
Queensland Treasury and Trade estimates
139AECOM Gladstone Port Master Planned Area
Evidence Base Report for the Proposed Gladstone Port Master Planned Area
(d) Includes dwellings being occupied under a life tenure scheme.
(e) Includes tenure type not stated
The majority of occupied private dwellings in Gladstone (R) are detached houses (87.9 per
cent) with only a small proportion of Gladstone’s dwelling stock comprising of semi-detached
or attached dwellings (nine per cent) as illustrated in Table 29.
Table 29 Occupied private dwellings (a) by dwelling structure, Gladstone Regional LGA and Queensland, 2011 158
LGA/State Separate Semi-detached Apartment (c) Caravan (d) Other (e) Total (f)
House (b)
number % number % number % number % number % Number
Gladstone 17,050 87.9 601 3.1 1,154 5.9 477 2.5 103 0.5 19,406
(R)
Queensland 1,215,3 78.5 129,430 8.4 181,716 11.7 16,191 1.0 3,384 0.2 1,547,303
03
(a) Excludes visitors only and other not classifiable households.
(b) Includes row or terrace house, townhouse etc.
(c) Includes flat or units.
(d) Includes cabin and houseboat.
(e) Includes improvised home, tent, sleepers out; house or flat attached to a shop, office, etc.
(f) Includes dwelling structure not stated.
The number of dwellings (including for visitors) is projected to increase to approximately
46,655 by 2031159. SGS’s 2012 Gladstone Planning Scheme Analysis report predicted that a
total of 25,600 new dwellings would be required by 2031, equating to an average of 1,024
new dwellings per year.160
158
ABS, Census of Population and Housing, 2011, Basic Community Profile – B31 (dwellings and persons) and Queensland
Treasury and Trade estimates
159
SGS Economics & Planning 2012a, Planning Scheme Analysis: 2012 Update, prepared on behalf of Gladstone Regional
Council.
160
SGS Economics & Planning 2012a
140AECOM Gladstone Port Master Planned Area
Evidence Base Report for the Proposed Gladstone Port Master Planned Area
Gladstone (R) Total Private Dwellings
Projections
60,000
50,000
40,000
30,000
Gladstone (R)
20,000
10,000
0
2011 (d) 2016 2021 2026 2031 2036
Figure 24 Projected dwellings (medium series), by local government area, Queensland, 2011 to 2036. 161
Non-resident worker accommodation
The Queensland Government Statistician’s Office (QGSO) released the Gladstone Region
Population Report, 2014 which provides information regarding the supply and take-up of
commercial worker accommodation villages (WAVs) within the Gladstone (R) LGA. The
report found that six worker accommodation villages (WAVs) were located within the
Gladstone LGA as at June 2014 which housed 96 per cent of non-resident workers (6,400
workers). This included three temporary LNG project-specific WAVs located on Curtis Island
and three mainland WAVS located in Gladstone (R) balance.162 The number of non-resident
workers accommodated within the temporary Curtis Island WAVS reached 5,475 in June
2014.
The total combined bed capacity of the WAVs within Gladstone LGA was 8,065 beds as at
June 2014. It is anticipated that the total WAV bed capacity in Gladstone will decline in 2014-
15 as two WAVs have since closed in 2014, reflecting the transition of the workforce from the
construction phase to the operational phase of projects. The report highlighted the fact that
the use of non-resident WAVs has effectively eased demand for other commercial
accommodation types including hotels and motels over the last two years with approximately
39 per cent of hotel/motel rooms being vacant and available as at June 2014 in comparison
to 12 per cent as at June 2012.163 It is anticipated that the permanent 1392 room WAV
(Homeground Gladstone) located at Calliope will continue to provide for future worker
accommodation needs in the Gladstone Regional Council area. These types of ‘on demand’
WAV facilities offer a more flexible opportunity to ease the shifting demands in temporary
accommodation in comparison to project specific ‘single use’ WAVs.
161
Queensland Government household and dwelling projections, 2013 edition, QGSO; ABS, 2011 Census of Population and
Housing. (d) The 2011 figure is an estimate based on estimated resident population (ERP).
162
Queensland Government Statistician’s Office, Queensland Treasury and Trade 2014
163
Queensland Government Statistician’s Office, Queensland Treasury and Trade 2014
141AECOM Gladstone Port Master Planned Area
Evidence Base Report for the Proposed Gladstone Port Master Planned Area
Table 30 Number of WAVS and WAV bed capacity, Gladstone (R), June 2014 164
Number of WAVS WAV bed capacity
Location
2011 2012 2013 2014 2011 2012 2013 2014
Curtis Island 0 3 3 3 0 1,255 6,100 6,125
Gladstone 1 4 4 3 80 1,300 2,090 1,940
(R) balance
Gladstone 1 7 7 6 80 2,555 8,190 8,065
(R) Total
Residential buildings approvals
The trend of residential building approvals in Figure 25 below indicates that the number of
approvals peaked in the financial year 2012-13 with a total of 1,570 residential approvals.
The number of approvals declined steeply in the 2013-2014 financial year with a total of 816
approvals. As mentioned previously, SGS’s 2012 Gladstone Planning Scheme Analysis
report predicted that a total of 25,600 new dwellings would be required by 2031, equating to
an average of 1,024 new dwellings per year.165 A continued shortfall in the residential
housing supply in comparison to demand would have a marked impact on affordability and
cost of living pressures for the community.
Residential building approvals in Gladstone
LGA
1,200
Number of approvals
1,000
800
600
400 Houses
200 Other
0
Financial year
Figure 25 Residential building approvals. 166
164
QGSO Gladstone region population report, 2014
165
SGS Economics & Planning 2012a, Planning Scheme Analysis: 2012 Update, prepared on behalf of Gladstone Regional
Council.
166
Source: ABS, building Approvals, Australia (88731.0)
142AECOM Gladstone Port Master Planned Area
Evidence Base Report for the Proposed Gladstone Port Master Planned Area
8.3.5 Education and training
A higher proportion of Gladstone residents with a qualification have a certificate as their
highest level of education in comparison to Queensland. On the other hand, a lower
proportion of persons with a qualification have a bachelor degree or higher. This reflects the
high proportion of persons employed in Gladstone as technicians and trades workers.
Table 31 Non-school qualifications by level of education, Gladstone Regional LGA and QLD, 2011
LGA/State Level of education Persons with a Total
qualification persons
Bachelor degree Advanced Certificate Persons with a Total
or higher Diploma or qualification persons
diploma
Number % Number % Number % Number % Number
Gladstone (R) 4,346 9.7 2,425 5.4 11,461 25.7 23,576 52.8 44,659
Queensland 548,894 15.9 260,778 7.5 686,993 19.9 1,875,323 54.2 3,456,875
Source: ABS, Census of Population and Housing, 2011, Basic Community Profile – B37 and B40 (usual residence) and
Queensland Treasury and Trade estimates
8.3.6 Income and cost of living
Figure 26 shows that Gladstone LGA has a larger proportion of households that earned a
high income in comparison to regional Queensland. This can be partially attributed to the
prevalence of higher-earning positions associated with the resources sector within the
Gladstone region.
Weekly household income, 2011
14
12
% of households
10
8
6
4
2
0
GRC %
Regional QLD %
Weekly income
Figure 26 Weekly household income, 2011. Source: ABS, Census of Population and Housing 2011
143AECOM Gladstone Port Master Planned Area
Evidence Base Report for the Proposed Gladstone Port Master Planned Area
Figure 27 illustrates that the median rent of three bedroom houses in Gladstone peaked in
the 12 months ending March 2013 at approximately $500 per week in comparison to the
Queensland average of $350 for the same period. The median rent in Gladstone has
dropped significantly since that period to be $300 per week which is $50 below the
Queensland median in the 12 months ending 30 September 2015 (refer to Table 32). This
trend reflects the decreasing demand for rental accommodation associated with the housing
of a large proportion of the temporary workforce within WAVs as well as the decrease in the
construction workforce.
Table 32 Median rent by dwelling type, Gladstone LGA and Queensland 12 months ending 30 September 2015
LGA/State Median rent
1 bedroom flat/unit 2 bedroom flat/unit 3 bedroom house 4 bedroom house
-$ per week-
Gladstone (R) 192 250 300 380
Queensland 290 340 350 410
Figure 27 Median rent ($ per week) of three bedroom houses. 167
Index of relative socio-economic disadvantage (SEIFA)
It is evident from Table 33 that Gladstone LGA has a relatively low proportion of its
population within the most disadvantaged quintile (10.9 per cent). A significant proportion of
the population fell within the second least disadvantage quintile (quintile 4). This is reflective
of the large proportion of higher income earners (refer to Figure 26).
167
Residential Tenancies Authority, Rental Bonds data (QGSO derived) and QLD Treasury and Trade estimates.
144AECOM Gladstone Port Master Planned Area
Evidence Base Report for the Proposed Gladstone Port Master Planned Area
Table 33 Population by Index of Relative Socio-Economic Disadvantage quintiles, Gladstone Regional LGA and Queensland, 2011 168
LGA/State Quintile 1 (most Quintile 2 Quintile 3 Quintile 4 Quintile 5 (least
disadvantaged) disadvantaged)
%
Gladstone (R) 10.9 22.9 19.0 31.2 16.0
It is important to note that certain geographic areas within the Gladstone LGA have a higher
level of disadvantage than the index score for Queensland including Gladstone City, West
Gladstone and South Gladstone – Barney Point.
8.3.7 Social and community infrastructure
A Social Infrastructure Strategic Plan (SISP) and Needs Assessment was undertaken for the
Gladstone region in 2009 by the previous Queensland Department of Employment,
Economic Development and Innovation (DEEDI) in conjunction with Buckley Vann, Briggs &
Mortar and Andrea Young Consultants. The report found that significant investment in social
infrastructure would be required to meet the needs of Gladstone’s projected population
growth to 2031.169 The needs were found to be greatest in the key residential growth areas of
outer Gladstone, Boyne Island/Tannum Sands and Calliope (refer to Figure 28). It is
recognised that there is a range of community infrastructure projects that are being
supported by the Gladstone Ports Corporation including the East Shores waterfront precinct.
A number of obligations from Social Impact Management Plans of significant project
proponents are coming to a close.
The findings from the SISP needs assessment in relation to the social infrastructure category
are summarised below.
Health and Wellbeing
- The population growth of the Gladstone LGA will require a significantly larger hospital
and higher service levels by 2031.
- The existence of Gladstone as an industrial hub of Queensland may necessitate an
increase in the number of accident and emergency and intensive care facilities.
- A larger community health centre will be required in Gladstone by 2031. Furthermore a
community health centre should be planned to be provided at Boyne Island/Tannum
Sands by 2021.
- Strategies should be developed in liaison with TAFE and Central Queensland University
to train allied health professionals in short supply in Gladstone.
Education Facilities
- The number of primary schools and high schools in the Gladstone LGA compared
favourably with the anticipated numbers based on the benchmarking undertaken in the
168
ABS 2033.0.55.001, Census of Population and Housing: Socio-Economic Indexes for Areas (SEIFA), Australia – Data only,
2011, (Queensland Treasury and Trade derived)
169
Department of Employment, Economic Development and Innovation (DEEDI) in conjunction with Buckley Vann, Briggs &
Mortar and Andrea Young Consultants 2009, Social Infrastructure Strategic Plan (SISP) and Needs Assessment.
145AECOM Gladstone Port Master Planned Area
Evidence Base Report for the Proposed Gladstone Port Master Planned Area
study. It was considered that a number of existing schools could accommodate further
growth/expansion if required.
- The study found that the existing TAFE facility in Gladstone should be upgraded to
accommodate the broad range of skills demanded by Gladstone’s core industries. In
addition, it was recommended that a smaller TAFE facility should be considered within
the Boyne Island/Tannum Sands catchment in the longer term.
- The Central Queensland University determined that the overall facilities of the campus
are sufficient to meet the current service demand of users.
Children, Youth and Family Facilities and Services
- At the time of the SISP needs assessment there were seven preschools/kindergartens in
the Gladstone LGA with a total maximum capacity of 174 places.
- This was found to be an under-provision of facilities in terms of the state average and it
was considered that several additional centres would be required in the long term,
particularly in outer centres such as Boyne Island/Tannum Sands.
- Domestic violence and child related abuse was found to be a significant issue within the
region and a need for prevention and early intervention programs was identified
- Benchmarking from SISP identified the need for two additional youth centres within
Gladstone by 2031 to meet the foreseeable demand.
Aged care services
- The number of aged care service operational places in Gladstone Regional LGA as at 30
June 2013 was 316 places.
- Community consultation coupled with community care data from the SISP Needs
Assessment found that the greatest areas of need were for domestic assistance, social
support, allied health care and personal care.
- The needs assessment found that additional services are required to increase the
frequency and range of existing community transport services.
Disability Services
- At the time of the SISP needs assessment, there was only one provider of residential
care in the Gladstone LGA for people with a disability which only had the capacity for six
clients.
- Other needs that were identified included the need for additional traditional care facilities
and purpose built residential facilities.
Indigenous Housing
As at September 2009, there was only one Indigenous housing provider in Gladstone with 34
houses. At that time, there were an estimated 20-30 people on the waiting list and the Needs
Assessment considered that the undersupply would continue into the future.
Department of Housing and Public Works Public Housing
The Queensland Government owns a significant stock of land within the Gladstone LGA with
localised areas of concentrated social housing. It is noted that some of that housing stock is
located in close proximity to port operations at Barney Point outside of the proposed master
planned area.
146Figure 27
ad J̀
Ro
on
! Social and Community
ns ¬P
Ha
d
a
Infrastructure
Ro
C
I G
$
on
I
!
C !
ws
¬S ¬H
Da
Legend
Red Rover Road
¬
! P
¬ ¬T ¬P ! Cities
! Urban centres
Gle nlyo n Roa d
! Local centres
! Localities
G
4
! Philip Street Watercourses (Major)
¬H South Proposed Gladstone port master planned area boundary
End
! Transport
¬P The Oaks
¬P !
Railway
Highways
Curtis Island
Secondary Roads
Education
¬ T TAFE
Targinie ¬S Special School
!
¬H High School
¬P Primary School
Mount
H
P Larcom
Emergency
¬ !
Facing Island
G
$J̀
!! I
C Hospital (Major)
C
I
! Hospital (Minor)
Aldoga
! I
$
! Specialist Hospital
J̀Gladstone ! G
4 Royal Flying Doctors
!
! P
Yarwun ¬ J̀ Police
P! !
¬ I G
S H
I
!
C !
¬C¬$ $
! G Ambulance
P T P Fire
!
¬¬
¬¬ ¬
!
Planning
Byellee G
4 Gatcombe
! ! ¬H Head Phillip St Communities Precinct (Proposed)
! !
Yeppoon
¬P ¬P
! Em u Park
Rockhampton
!
East End !
! Gracem ere
Curtis Island
West
Beecher
Stowe !
Gladstone
!
!
Boyn e Island
!
!
Tann um Sands
Calliope !
Boyne
Agnes Water
Island !
!
Tannum !
Biloela
¬ Sands
! P
¬ ¬ !J̀ P
G
$ ! Ha
m Moore Park !
! ¬
! pt !
on
Malp
¬H Dr
! Monto
Bundaberg
iv e !
as S
¬P
tr ee
i ver
t
R iver
pe R Boyne
¬P
lli o
Ca J̀
Philip St
re et G
$
!
! 10 November 2015
ver
Ri
e
yn
Benaraby
Bo
P
! 0 1 2 4 6 8 10
!
Calliope
¬G¬
J̀
$ ¬P ¬H
°
!
! Kilometres
Coordinate System: GDA 1994 MGA Zone 56
Projection: Transverse Mercator
Datum: GDA 1994
¬
© Copyrigh t th e State of Qu eenslan d (Departmen t of State Development, In frastru ctu re and Plann ing) 2015. N o liability accepted for an y loss or dam age wh ich m ay arise from the use or reliance upon this information. Map produced by th e Departmen t of State Development Infrastructu re and Plan ning Spatial Services U nit, 12/11/2015AECOM Gladstone Port Master Planned Area
Evidence Base Report for the Proposed Gladstone Port Master Planned Area
8.3.8 Community values
The Gladstone region has a number of features of environmental, recreational, social and
economic value to the surrounding community. These values have been identified through a
number of previous community engagement processes and studies including (but not limited
to):
- The SISP Needs Assessment
- Arrow LNG Plant Social Impact Assessment (SIA), Australia Pacific LNG SIA, Gladstone
Steel Plant SIA, Fisherman’s Landing Northern Expansion SIA, Western Basin Dredging
and Disposal Project SIA
- The Gladstone Healthy Harbour Partnership.
The key values that have been expressed by the community through the abovementioned
studies include:
- Environment:
the biodiversity and natural values of the environment
protection of the Great Barrier Reef
the protection of areas with high visual amenity
minimising noise, dust and degradation to air and water quality
- Recreation and social:
the water-based recreational value of the harbour and its surrounds, particularly for
boating and fishing
maintained wellbeing and amenity in the context of industrial development and
growth
the social benefits of national parks and state forests aesthetically, health-wise and
recreationally
access and use of the harbour including the foreshore, beaches, boat ramps and
viewing facilities
access to an adequate provision of social and community infrastructure
recognition of Indigenous heritage
- Economic:
tourism
affordability
job opportunities
access to high quality transport infrastructure including roads and public transport
access to education and training facilities.
The Gladstone community largely embraces the managed growth of industrial development
related to the Port of Gladstone and values the positive impact on the local economy. It is
important from the community’s perspective that development does not take place at the
expense of the abovementioned community values.
148AECOM Gladstone Port Master Planned Area
Evidence Base Report for the Proposed Gladstone Port Master Planned Area
8.3.9 Transport and access
The vast majority of the Gladstone LGA population travel by car to work (73.6 per cent). This
is reflected in the fact that 22.8 per cent of dwellings in Gladstone LGA had three or more
cars as the 2011 ABS Census of population and housing in comparison to 17.3 per cent for
Queensland. In 2011, 2.7 per cent of the population used public transport to travel to work in
comparison to 76.1 per cent of the population who used private vehicles.
A Gladstone Area Transport Study was undertaken in 2011 by PSA Consulting on behalf of
the Department of Transport and Main Roads. The study found that scheduled urban bus
services are poorly patronised due to the limited temporal coverage and long travel times and
distances which made it difficult for public transport to compete with private transportation.170
Other emerging issues associated with Gladstone’s transport system that were highlighted in
the report include:
- the lack of distinct transport hubs or formal park and ride locations
- major industries requiring high volume passenger transport options between worker
camps and worksites
- the limited capacity of the road network to handle heavy vehicle designs with higher
freight loads
- the growth in the ageing population and those with limited transport options requires
increasing community transport options within urban areas.
8.4 Potential impacts
Table 34 provides a summary of both the positive and negative impacts associated with the
ongoing operation and expansion of activities within the proposed Gladstone port master
planned area that have been identified as part of the social investigation, evaluation and
gaps analysis. This assessment has been based on the findings from a desktop review of
existing studies, SIAs, Social Impact Management Plans (SIMPs) and stakeholder
engagement programs within the Port of Gladstone geographic area as well as the baseline
data compiled in Section 8.3.
Table 34 Potential impacts relating to the operation of current and planned activities within the Port of Gladstone master planned
area
Description of potential impact Potential duration
Workforce participation and employment
An opportunity to increase labour force During the construction and operational
participation and increase local skills capacity phases of development.
Existing services may expand and new During the construction and operational
enterprises may be attracted to the region to phases of development.
cater for the growing population base
Decline of construction workforce as major Post-construction of major development.
170
PSA Consulting 2011, Gladstone Area Transport Study – Preliminary Draft Transport Strategy report, prepared for TMR.
149AECOM Gladstone Port Master Planned Area
Evidence Base Report for the Proposed Gladstone Port Master Planned Area
projects move from construction to operation
Housing and accommodation
Increased demand for housing and short term During the construction and operational
accommodation as a result of an expanded phases of major development.
construction and operational workforce
Reduced housing affordability for low income Cyclic
earners due to increased demand and
associated shortage
Income and cost of living
The expansion of development may enhance Ongoing
the income earning potential of the wider
Gladstone community
High rental and house prices associated with Cyclic
the influx of the construction and operational
workforce of regionally significant projects
Social and community infrastructure
Increasing pressure on community infrastructure Ongoing
– particularly health service facilities
Need to accommodate social infrastructure in Medium–long term
appropriate locations within the proposed
Gladstone port master planned area
Community values
Potential increase in crime (particularly relating Cyclic
to recreational drugs, physical abuse and
firearm crimes) associated with an influx of
temporary project workers
Reduction in recreational opportunities within Ongoing
the proposed Gladstone port master planned
area as a result of the expansion of industrial
port related activities
Cumulative impacts on the environment, air Ongoing
quality, noise, lighting and visual amenity as a
result of further heavy/ noxious industrial
development
Loss of Indigenous cultural areas and Ongoing
landscapes, impacting traditional practices
150AECOM Gladstone Port Master Planned Area
Evidence Base Report for the Proposed Gladstone Port Master Planned Area
8.5 Conclusions
This section has provided a demographic snapshot and identified the social values that exist
amongst the communities residing or working within the proposed Gladstone Port PDA and
surrounding localities. Key conclusions that have been drawn from the social baseline
assessment are summarised below:
- Gladstone is one of the fastest growing LGAs in Queensland with strong non-resident
population increases supplementing steady residential growth. The estimated resident
population of the Gladstone LGA is forecast to nearly double from 65,845 in 2014 to
121,266 in 2036 (Queensland Government medium series population projections, 2013
edition).
- Population growth derived from major infrastructure projects and port expansion will be
difficult to project into the future and will place pressure on the provision of trunk
infrastructure, accommodation/housing and key social services.
- The Social Infrastructure Strategic Plan (SISP) and Needs Assessment undertaken for
the Gladstone region found that significant investment in social infrastructure would be
required to meet the needs of Gladstone’s projected population growth to 2031. This
included the identified need for a significantly larger hospital and higher service levels by
2031.
- The working population of Gladstone is strongly dependent on the resources sector with
over 5,000 full-time employees and contractors working in alumina refining, aluminium
smelting, cement and chemicals production, rail transport and coal export operations in
2014.
- As the LNG projects transition from the construction phase to operations in 2015, the
size of the non-residential workforce will decrease significantly in Gladstone (refer to
Figure 21) with the operational workforces of the LNG plants and port projects likely to
be considerably smaller than the construction workforces.
- Data derived from the 2011 Census of Population and Housing indicates that the top
industry of employment with the Gladstone LGA is manufacturing (17 per cent). This is in
comparison 7.6 per cent for Regional Queensland (refer to Figure 15).
- Other notable industries of employment include the construction industry (13.8 per cent),
retail trade (9.5 per cent) and the transport, postal and warehousing industry (7.7 per
cent).
- The abovementioned industries are strongly aligned with the operation of the Port of
Gladstone. The management and sustained growth of these industries within the
proposed Gladstone port master planned area is therefore an integral consideration in
supporting the continued economic performance of the wider Gladstone area.
- The Gladstone region has a number of features that have environmental, recreational,
social and economic value to the surrounding community. These have been summarised
in Section 8.3.8.
151You can also read


