The Guenoa Minuanos and the Jesuit Missions among the Guaraní
←
→
Page content transcription
If your browser does not render page correctly, please read the page content below
The Guenoa Minuanos
and the Jesuit Missions
among the Guaraní
Los guenoa minuanos y las misiones jesuíticas
entre los guaraníes

doi: https://doi.org/10.22380/20274688.1116
                                                                                                     ROBERT H. JACKSON*
 Recibido: 28 de diciembre de 2019                                                                        robertvianey@gmail.com
     Aprobado: 7 de abril de 2020

                                                               A b s t r ac t
The Jesuit province of Paraquaria included                                     lived in the Banda Oriental, or what is to-
missions established within both sedentary                                     day Uruguay and Rio Grande do Sul. Some
and non-sedentary indigenous groups. This                                      bands chose to settle on the missions and
study examines the Guenoa Minuanos and                                         particularly San Francisco de Borja, while
their interactions with the Jesuit mission                                     other bands allied with the Portuguese. This
San Francisco de Borja. The Guenoa Mi-                                         study focuses on the bands that settled on
nuanos were a non-sedentary group that                                         the San Francisco de Borja mission.

Keywords: Guenoa Minuanos, Guaraní, Jesuits, Portuguese, Provincia de Paraquaria

                                                                 R e s u m e n
La provincia jesuítica de Paraquaria in-                                       la Banda Oriental, o lo que hoy en día es
cluía misiones con poblaciones indígenas                                       Uruguay y Rio Grande do Sul. Unas bandas
sedentarias y no sedentarias. Este estudio                                     se asentaron en las misiones y, principal-
examina los guenoa minuanos y sus inte-                                        mente, en San Francisco de Borja, y otras se
racciones con la misión jesuítica de San                                       aliaron con los portugueses. Este estudio
Francisco de Borja. Los guenoa minuanos                                        se enfoca en las bandas que se asentaron
eran un grupo no sedentario que vivía en                                       en la misión de San Francisco de Borja.

*         Robert Jackson earned his doctorate from the University of California, Berkeley in 1988 with a
          specialization in Latin American history. He has authored, co-authored, edited, and co-edited 24
          books and more than 70 journal articles and book chapters. He lives in Mexico City.

    280    Vo l . 2 6, N.° 1. p p. 2 8 0 -3 0 3, enero -ju ni o d e 2 021   F R O N T E R A S   de   la     H I S T O R I A
Palabras clave: guenoa minuanos, guaraní, jesuitas, portugueses, provincia de

                                                                                                      Robert H. Jackson
Paraquaria

                  he Spanish government used the institution of the mission in an
                  attempted process of social engineering designed to transform
    T             the socio-economic and political organization of indigenous
                  peoples living on the fringe of its American territories, and to
                  convert them to Catholicism. The goal was to create politically
autonomous communities of sedentary agriculturalists resembling those in regions
such as central Mexico. This transformative agenda worked best with groups that
already practiced agriculture and exhibited a more or less sedentary way of life.
However, the transition proved difficult, if not impossible, due to non-sedentary
groups who shared a different set of values based on gender roles, and the ways
in which men achieved social status. The values of the successful hunter and
warrior stressed by many non-sedentary groups shaped men’s access to social
status, which in turn defined distinct gendered labor roles. Women, for example,
generally collected wild plant foods, something which became a source of con-
flict with missionaries who expected men to work in agriculture in tasks which
closely resembled the gendered work of women. The missionaries often failed
to grasp the logic of the organization of non-sedentary groups, and attempted to
enforce changes which, in many instances, men found unacceptable.
       In 1768, the reform-minded royal official José de Gálvez attempted to
convert the non-sedentary Guaycurus of southern Baja California into an agri-
cultural workforce as part of a plan to make marginal missions economically
self-sufficient. The plan backfired, however, since royal officials ended up hiring
non-indigenous laborers to work the mission fields, which defeated the purpose
of trying to economize at a time of reform (Jackson, “The Guaycuros”). Similarly,
efforts to congregate and evangelize the hunter-gatherers Pames and Jonaces in
the Sierra Gorda region of Mexico failed for nearly two hundred years, when
sixteenth century missions were established among sedentary communities of
central Mexico. It was only in the 1740s and 1750s that Franciscan missionar-
ies were able to successfully congregate the Pames, but only with the support
of soldiers who forcibly relocated the natives to the missions. The Jonaces, on
the other hand, continued to resist such forced change unto their way of life
(Jackson, “Demographic patterns”).

  F R O N T E R A S   de   la   H I S T O R I A       Vo l . 2 6, N.° 1. e ne ro -j u nio d e 2 021   281
The Guenoa Minuanos and the Jesuit Missions among the Guaraní
The Jesuits in South America experienced similar difficulties with non-
sedentary indigenous peoples. The Jesuit province of Paraquaria covered an
extensive territory in what today are the countries of Argentina, Bolivia, Bra-
zil, and Paraguay. The Guaraní and the groups that evolved into the Chiqui-
tanos through a process of ethnogenesis were agriculturalists who practiced
swidden agriculture, and the Jesuit missions established among these groups
played an important role in their evangelization program. However, there we-
re also non-sedentary groups that the Jesuits attempted to evangelize, and the
Black Robes encountered similar difficulties in the attempt to convince non-
sedentary groups to change their way of life. The Chaco region was one porous
border between indigenous agriculturalists and non-sedentary groups, and the
Jesuit-established missions in the seventeenth and eighteenth centuries which
attempted to evangelize the different groups living there. The Banda Oriental
(modern Uruguay) and Rio Grande do Sul, which was a border zone contested
by Spain and Portugal, was a second example. The ethnic group in this area,
the Guenoa Minuanos, and the Jesuit efforts to evangelize them is the subject
of this article, with special reference to the mission of San Francisco de Borja.
Several groups including the Yaros, the Charrúa, and the Guenoa Mi-
nuanos interacted with the Jesuit missions established among the Guaraní as
raiders, while they also engaged in trade (Bracco, “Charrúas, bohanes”; Levin-
ton, “Guaraníes y charrúas”; Levinton,”Las estancias”). The bands of Charrúa
interacted primarily with the Jesuit mission los Reyes Yapeyú, established on the
west bank of the Uruguay River in 1627. Similarly, Guenoa Minuanos engaged
in trade with the missions of La Cruz, Yapeyú, and Santo Tomé, as reported in
the 1670s (Bracco, “Los guenoa”). Some entered the missions.
In 1702, the Jesuits established a short-lived mission named San Andrés
de Yaros following a 1701-1702 military campaign directed against the non-
sedentary indigenous groups living in the Banda Oriental who had allied with
the Portuguese during the War of Spanish Succession (1701-1713), and raided the
Jesuit missions.1 The mission collapsed when the natives abandoned the mis-
sion (Levinton, “Las estancias” 36). The Jesuits congregated small numbers
1 For further discussion of the Spanish-Jesuit conflict in the Rio de la Plata region and the Jesuit
mission expansion after 1680, see Robert H. Jackson, Regional Conflict and Demographic Patterns
on the Jesuit Missions among the Guaraní in the Seventeenth and Eighteenth Centuries. Leiden:
Brill Academic Publishers, 2019, pp. 40-41. The Portuguese hoped to distract the mission militia,
and to prevent it from participating in a later siege of Colonia do Sacramento.
282 Vo l . 2 6, N.° 1. e nero -ju ni o d e 2 021 F R O N T E R A S de la H I S T O R I ARobert H. Jackson
of non-sedentary indigenous peoples into the missions amongst the Guaraní
following the 1701-1702 military campaign. For example, the Jesuits reported
the resettlement of 46 non-Christians on Corpus Christi mission (Jackson,
“Demographic Patterns”). In the same year the Jesuits settled 40 Yaros on
Candelaria mission. The Black Robes reported that they catechized the adults
daily in the morning and in the afternoon (BNB, CA, “Annua de los dos Pueblos
de la Candelaria y de S. Cosme y S. Damian en 1702”). The conflict with the
non-sedentary groups in the Banda Oriental continued for several more years.
A 1705 report noted continued raids by Yaros and other groups on mission live-
stock (BNB, CA, “La Carta Annua”). The conflict escalated in 1707 and 1708 as
non-Christian Guenoa Minuanos, Yaros, and Bohanes allied with the Portu-
guese continued to raid mission and the Spanish livestock, attacked mission
residents, and sheltered fugitives from the missions. In one incident hostile
natives attacked a raft from Santo Tomé mission. They also attacked mission
Estancias, including those of La Cruz and Yapeyú. In the last attack the raid-
ers killed 13 and took another 26 women and children hostage. In November
of 1707 the Jesuits sent a force of 250 mission militia from La Cruz, Yapeyú,
and San Francisco de Borja to pursue and punish the raiders, a move which
decisively defeated the hostile Guenoa Minuano bands (BNB, CA, Medrano y
de Borja “Estado y motivos”).
Periodic hostilities continued with the non-sedentary indigenous groups
through the end of the eighteenth century. Military campaigns in 1749, 1750,
and 1751 forced hundreds of Charrúa to settle on a Franciscan mission named
Concepción de Cayastá located at what had been the first site of Santa Fe on the
eastern bank of the Paraná River (Bracco, “Charrúas y aculturación”). Guenoa
Minuanos also sought refuge on the missions following the campaigns. Simi-
larly, some 650 infieles sought refuge on La Cruz, Yapeyú, and San Francisco
de Borja in 1794, and this group included 130 Guenoa Minuanos (Bracco, “Los
guenoa” 44).
This article examines the resettlement of Guenoa Minuanos on two mis-
sions located east of the Uruguay River in what today is Rio Grande do Sul.
They were San Francisco de Borja established in 1682 at a site near the east
bank of the Uruguay River. It had been a visita of Santo Tomé mission, but
the Jesuits elevated the community to the status of an independent mission as
a part of its geopolitical campaign to occupy present-day Rio Grande do Sul,
following the 1680 Portuguese establishment of Colonia do Sacramento (Jackson,
Regional Conflict). The Jesuits established Jesús María de los Guenoas in 1690
F R O N T E R A S de la H I S T O R I A Vo l . 2 6, N.° 1. e ne ro -j u nio d e 2 021 283The Guenoa Minuanos and the Jesuit Missions among the Guaraní
at a site close to San Francisco de Borja. It operated as an independent mission
community until 1720 when the Jesuits merged the two missions following the
severe 1718-1719 smallpox epidemic.
➻ F igu r e 1.
Plano topográfico que comprende una parte del Montegrande, el Río
Yacuy, los establecimentos y misiones del Uruguay, los yervales que
actualmente poseen los indios guaranías y el curso del mismo Uruguay
desde la boca del verdadero Pepiri o Peguiri hasta el paso que llaman de
Concepción. A contemporary map showing the Jesuit missions located
east of the Uruguay River.
Source: Courtesy of the Geography and Map Division, Library of Congress, Washington, D. C.
The population of Jesús María was open, which means that the Jesuits
congregated non-Christians into the missions. The Jesuits reported the baptisms
of 21 adults in 1690 when the mission was first established, 10 in 1691, 14 in
1693, 31 in 1695, one in 1700, 23 in 1705, and 11 in 1708 (BNB, CA, Annua de las
Doctrinas del Paraná y Uruguay… del año de 1693, Annua de las Doctrinas del
Paraná y Uruguay… del año de 1694; Estado de las reducciones del Paraná de
este año de 1698; Annua Doctrinas del Uruguay del año de 1698; Anuas de las
Misiones del Uruguay del año de 1700; Estado de las Doctrinas del Uruguay al
fin del año de 1705; Estado de las Doctrinas del Uruguay al fin del año de 1706;
Estado de las Doctrinas del Uruguay del año de 1715; Estado de las Doctrinas
284 Vo l . 2 6, N.° 1. e nero -ju ni o d e 2 021 F R O N T E R A S de la H I S T O R I ARobert H. Jackson
de Paraguay del año de 1716; Estado de las Doctrinas de Paraguay del año de
1717; Jackson, Demographic Change 248). However, the fluctuation in the pop-
ulation (see Figure 2, Appendices: Table 1) suggests a similar pattern to that
of established missions among other non-sedentary indigenous groups such as
those in the Chaco region. The Guenoa Minuanos settled on the mission, but
some left thereafter. The pattern of fluctuations in the population suggests the
failure of the Black Robes to convince the natives to abandon their traditional
way of life, particularly the social norms that defined gender roles between
men and women.2 The mission censuses recorded a population of 324 when the
Jesuits established Jesús María in 1690. This number reached a record high of
357 in 1714, it stood at 238 in 1717, and then dropped to 238 in 1719 following
the smallpox epidemic of 1718-1719. The 1720 mission census showed the mis-
sion merged with San Francisco de Borja, and the 1724 population count did
not record the mission at all.
Following the closing of Jesús María the Jesuits made several attempts to
establish missions for the Guenoa Minuanos. In 1727, a Guenoa Minuano band
requested the establishment of a new mission in their own territory. Similarly,
the Black Robes founded two missions, one in 1746 and another one in 1750,
in the Banda Oriental, present-day Uruguay. The second was located close to
Montevideo (Bracco, “Los guenoa” 37, 39). However, the majority of Guenoa
Minuanos settled on the Guaraní missions, and particularly on San Francisco
de Borja.
A 1732 document summarized the number of baptisms recorded on San
Francisco de Borja between 1682 and 1732 (see Figure 3, Table 3) (BNB, CA,
Relación de los Bautismos del Pueblo de San Francisco de Borja, desde el año
de su fundación en 1687 hasta el presente año de 1732). The summary records
baptisms of 402 non-Christian adults the Jesuit had settled on the mission in
the first two decades following the establishment of the mission, and again
in the 1720s and 1730s following the merger of the population of Jesús María.
The document recorded the baptism of the children of the recently congregated
adults in the list of baptisms of párvulos, or children under the age of about ten.
Moreover, the document noted the baptism of another 1,952 individuals who
had settled on Santo Tomé and San Francisco de Borja, and of most, if not all
2 For demographic patterns on the Jesuit Chaco missions see Robert H. Jackson, “La población y
tasas vitales de las otras misiones jesuíticas de la Provincia de Paraguay y Moxos”. IHS Antiguos
Jesuitas en Iberoamérica, vol. 6 n.° 1, 2018, pp. 104-118.
F R O N T E R A S de la H I S T O R I A Vo l . 2 6, N.° 1. e ne ro -j u nio d e 2 021 285The Guenoa Minuanos and the Jesuit Missions among the Guaraní
of whom were Guenoa Minuanos (see Figure 4). This pattern shows that the
Jesuits baptized Guenoa Minuanos at both missions, but Jesús María was an
exclusively Guenoa community. The Jesuits continued to congregate Guenoa
Minuanos on San Francisco de Borja mission during the rest of their tenure on
the mission, although the process of congregation did not always go smoothly.
In 1730, for example, 40 members of one band settled on the mission, but other
band members refused to do so following an altercation with another indigenous
group that resulted in several deaths. However, the band members promised to
return to the mission once they had exacted blood revenge from the group they
had clashed with (Bracco, Los guenoa 38). The Guenoa Minuanos continued to
adhere to their traditional values and way of life.
400
350
300
250
200
150
100
50
0
1643
1648
1653
1658
1663
1668
1673
1678
1683
1688
1693
1698
1703
1708
1713
1718
1723
1728
1733
1738
1743
1748
1753
1758
1763
1768
1773
1778
1783
1788
1793
1798
➻ F igu r e 2.
The Population of Jesús María de los Guenoas Mission, 1690-1719
Source: Made by the author based on tables included in the appendices.
Guenoa Minuanos constituted a large part of the population of San Fran-
cisco de Borja. A 1743 report noted that a third of the people living on the mis-
sion were Guenoa Minuanos (Bracco, Los Guenoa, 38). By 1743 the mission had
a population of 3,871, and the number of Guenoa Minuanos lied between 1,200
and 1,300 (see Table 4). The Jesuits congregated several non-sedentary groups on
286 Vo l . 2 6, N.° 1. e nero -ju ni o d e 2 021 F R O N T E R A S de la H I S T O R I ARobert H. Jackson ➻ F igu r e 3 . A 1732 summary of baptisms recorded on the San Francisco de Borja mission from 1682 to 1732 Source: Coleçao de Angelis, Biblioteca Nacional, Rio de Janeiro, Brazil. F R O N T E R A S de la H I S T O R I A Vo l . 2 6, N.° 1. e ne ro -j u nio d e 2 021 287
The Guenoa Minuanos and the Jesuit Missions among the Guaraní
other missions. During the seventeenth century, for example, the Jesuits con-
gregated Charrúa on Yapeyú mission. In the years 1665-1666 the Black Robes
settled some 250 on the mission and 500 Yaros in 1701 during the campaign
against the non-sedentary groups in the Banda Oriental (Jackson, Demographic
Change 16). The Jesuits recorded one baptism of a non-Christian adult there
in 1693, while 19 were recorded in 1698. The missionaries stationed on Corpus
Christi congregated bands of a non-sedentary group known as Guañanas in 1702,
1724, 1730, and 1754. By 1759 there were 112 Guañanas living on the mission in
separate cacicazgos in addition to 4,530 Guaraní (Jackson, Demographic Change
101-102). The Jesuits also reported the baptism of a few non-Christian adults at
other missions. At Jesús, for example, there were 11 in 1691, 31 in 1695, and 2 in
1702. In 1702, it was 10 adults and older children at Loreto, (BNB, CA, Annua del
pueblo de Loreto de 1702). Seven at San Ignacio, and 18 at San Francisco Xavier
in 1708. However, San Francisco de Borja most likely had the largest population
of non-sedentary groups of the 30 missions amongst the Guaraní.
Demographic Patterns on the
San Francisco de Borja Mission
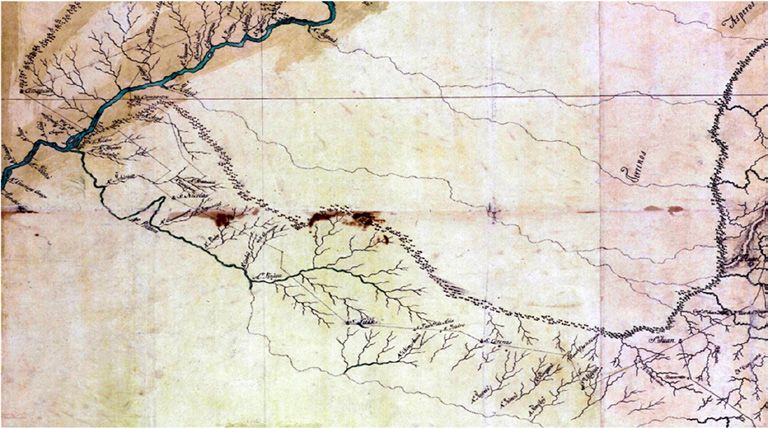
Several factors framed demographic patterns in San Francisco de Borja and other
missions. One was the ease of communication on the river highways that facilitated
commerce; yet another was the spread of contagion (see Figure 4). Epidemics
spread to the missions about once every generation or every 20 years. A second
factor was the Jesuit urban plan on the missions. The Black Robes instituted a
policy of congregating the entire population of a given mission into nucleated
settlements that in many instances had populations of more than 3,000, 4,000,
5,000, or in one case more than 8,000. The Jesuits had rows of buildings with
multiple apartments to house the mission residents (see Figure 5). The mission’s
urban plan facilitated the spread of contagion across the population. Moreover,
mission populations had moderate to high birth rates, which meant there were
large numbers of potentially susceptible hosts when epidemics spread through
the missions. Given the high population densities, there were epidemic death
rates of as high as 50 percent of the population in any given mission. However,
mission populations rebounded or recovered following epidemic outbreaks with
the formation of new families and particularly high birth rates.
288 Vo l . 2 6, N.° 1. e nero -ju ni o d e 2 021 F R O N T E R A S de la H I S T O R I ARobert H. Jackson
➻ F igu r e 4 .
The Uruguay River near San Francisco Xavier mission
Source: Photograph by the author.
4500
4000
3500
3000
2500
2000
1500
1000
500
0
1643
1648
1653
1658
1663
1668
1673
1678
1683
1688
1693
1698
1703
1708
1713
1718
1723
1728
1733
1738
1743
1748
1753
1758
1763
1768
1773
1778
1783
1788
1793
1798
➻ F igu r e 5 .
Population of San Francisco de Borja Mission, 1687-1801
Source: Made by the author based on tables included in the apendices.
F R O N T E R A S de la H I S T O R I A Vo l . 2 6, N.° 1. e ne ro -j u nio d e 2 021 289The Guenoa Minuanos and the Jesuit Missions among the Guaraní
The first existing census of San Francisco de Borja mission recorded a
population of 2,396 in 1690. This amounts to the population transferred in 1682
to establish the mission, including the recently congregated Guenoa Minua-
nos. A measles epidemic in 1695 caused elevated mortality, and the numbers
dropped by more than 200 from 2,888 recorded in 1694 to 2,688 in the next
existing census in 1698. However, the numbers grew over the next two decades
with moderate to high birth rates and the congregation of small numbers of
non-Christians. The population totaled 3,757 in 1717 (see Figure 6).
Baptisms/Burials
400
300
200
100
0
-100
-200
-300
-400
-500
1702
1706
1710
1714
1718
1722
1726
1730
1734
1738
1742
1746
1750
1754
1758
1762
1766
1770
1774
1778
1782
1786
1790
1794
1798
Year
➻ F igu r e 6:
Baptisms and Burials at San Francisco de Borja Mission, 1702-1803
Source: Made by the author based on tables included in the apendices.
290 Vo l . 2 6, N.° 1. e nero -ju ni o d e 2 021 F R O N T E R A S de la H I S T O R I ARobert H. Jackson
A severe smallpox epidemic spread through the missions in 1718-1719,
and the heaviest mortality at San Francisco de Borja mission appears to have
ocurred in the first year of the outbreak. This was a full generation following
the previous outbreak in 1695. The population experienced a net decline of some
1,000 people. The numbers dropped to 2,673 in 1719. It was at this point that the
Jesuits merged the population of Jesús María and San Francisco de Borja, and
directed efforts to congregate Guenoa Minuanos from San Francisco de Borja.
The population was 2,861 in 1720 following the merger, and continued to
grow during the following decade. In non-crisis years there were more births
and baptisms than burials (see Figure 8). The population totaled 3,769 in 1732
on the eve of a series of mortality crises that included crop failure, famine, and
epidemics. In the years 1733-1740, some 90,000 people died in the missions.
However, the population of San Francisco de Borja did not suffer catastrophic
mortality during the crises of the 1730s; it was actually one of the missions
that experienced population growth during the decade. The highest recorded
mortality rate was a CDR of 97.6 per thousand population in 1733; in the years
1733, 1735-1740 the Jesuits recorded 1,264 baptisms against 1,085 burials, a net
increase of 179. The numbers fluctuated during the decade, and stood at 3,291
in 1740. The population of the mission continued to grow in the 1740s and
early 1750s. In the years 1741, 1744-1750 the Black Robes baptized 1,585 and re-
corded 1,253 burials, a net growth of 332. The mission population was 3,430 in
1741, and grew to 4,081 in 1746, and subsequently to 3,232 in 1753 (see Table 4).
In 1750 Spain and Portugal signed the Treaty of Madrid that specified the
boundaries of their territories in South America. Under the terms of the Treaty,
Spain transferred the sites of the seven missions located east of the Uruguay
River to Portugal in exchange for Colonia do Sacramento. The residents of the
seven eastern missions resisted the transfer, while a number of non-Christian
Guenoa Minuanos joined the uprising. A joint Spanish-Portuguese army de-
feated the rebels in 1756, and Spanish officials implemented the plan to transfer
the populations of the seven missions to the remaining missions west of the
Uruguay River. The Jesuits relocated the bulk of the population of San Fran-
cisco de Borja across the Uruguay River to Santo Tomé. Not only was there
an historical connection between the two communities, but the population of
Santo Tomé had also experienced heavy mortality rates during the 1730s. From
a high of 3,593 recorded in 1732 the numbers dropped to 1,699 in 1739. The pop-
ulation of Santo Tomé rebounded and grew to 2,499 in 1753, but still had not
recovered to pre-crisis levels, affording thus space to accommodate the refugees
F R O N T E R A S de la H I S T O R I A Vo l . 2 6, N.° 1. e ne ro -j u nio d e 2 021 291The Guenoa Minuanos and the Jesuit Missions among the Guaraní
from San Francisco de Borja. In 1756, 1,641 had relocated to Santo Tomé, and
this number increased to 3,721 in 1750. However, the population reoccupied
the San Francisco de Borja mission site fairly quickly following the abrogation
of the Treaty of Madrid in 1761. By the end of 1763 those at Santo Tomé had
returned to the mission site, and by the end of the following year another 253
who had been settled in six missions located in what today is southern Paraguay
had also returned (Jackson, Demographic Change 73-74).
An outbreak of smallpox at San Francisco de Borja during the summer
of 1764-1765 was spread by a Spanish army that had invaded the Portuguese
settlements in Rio Grande do Sul. The Jesuits recorded 341 burials in 1764
(a CDR of 131.1 per thousand population), and 378 burials in 1765 (a CDR of
130.7 per thousand population). In the years 1763-1765 the Jesuits recorded 451
baptisms against 889 burials, a net difference of -438. The mission population
dropped to 2,546 recorded in 1766 (see Table 4). Mortality was relatively light
compared to other missions, and remained consistent with the pattern docu-
mented during the crises of the 1730s of moderate death rates when compared
to the catastrophic mortality (in excess of 250 per thousand population) at
many of the other missions. It is possible that the Jesuits in the mission were
able to isolate their population from the neighboring missions through a more
effective quarantine plan, given its location east of the broad Uruguay River.
Fluctuations in the population of the mission during the years following
the Jesuit expulsion from Spanish dominions in 1767 and population shifts re-
sulted primarily from migration. While it recorded 2,131 in 1772, 2,403 in 1797,
and 2,413 in 1801 on the eve of the Luso-Brazilian conquest of the territory of
the seven eastern missions. As already noted above, numbers of non-Christian
Guenoa Minuanos and other non-sedentary groups from the Banda Oriental
continued to seek refuge within the mission communities, particularly in San
Francisco de Borja. There is a register of baptisms and burials for San Francisco
de Borja for the early years of the nineteenth century. Spanish surname priests
continued to administer the ex-mission, and recorded entries in the register in
Spanish, not in Portuguese. An epidemic in 1809-1810 killed several hundred
at San Francisco de Borja, but overall the population continued to grow and
rebounded following the outbreak of the unidentified contagion (Jackson,
Demographic Change 166).
292 Vo l . 2 6, N.° 1. e nero -ju ni o d e 2 021 F R O N T E R A S de la H I S T O R I AThe Gender and Age Structure
Robert H. Jackson
Unlike the populations of missions on other frontiers of Spanish America, the
populations of the missions among the Guaraní proved to be resilient, and
rebounded or recovered following epidemic outbreaks. The Guaraní-Guenoa
Minuano population of San Francisco de Borja proved to be no different. Sev-
eral factors explain the ability of the mission populations to recover. One was
the gender structure. Women and girls constituted the majority of the mission
population during the eighteenth century, even following epidemic mortality.
This meant that there was a pool of women available for the formation of new
families. Moreover, Guaraní and Guenoa Minuano women married at a rela-
tively young age soon after puberty, and on average, had a child about every
two years. Moreover, there were no economic limitations to family formation
or to procreation, enabling women to have many children.3 Figure 7 shows the
number of women and girls as a percentage of the total mission population.
Females constituted more than 52 percent of the total. More women generally
died from diseases such as smallpox and measles because of the TH-2 immuno-
logical response, as occurred, for example, during the 1764-1765 smallpox
epidemic. However, women still remained the majority.
The mission populations exhibited high fertility and mortality rates. This
meant that death rates tended to be high, but in non-crisis years birth rates were
higher still. Moreover, the mission populations were young, meaning that young
children constituted a large percentage of the total population; families also
tended to be large. This can be seen, for example, in the number of párvulos,
the category used for children under the age of ten, as a percentage of the total
population. In non-crisis years young children constituted between 30 and 45
percent of the total population (see Figure 8). Severe epidemics killed many of
young children, shifting the age structure of the mission population. This can
be seen in the case of the 1718-1719 smallpox epidemic. Párvulos constituted 40
percent of the mission population in 1717, but dropped to less than 30 percent
in 1719 following the heavy mortality. However, high birth rates and the contin-
ued congregation of non-Christians contributed to an increase in the number
of young children and the restoration of the pre-epidemic age structure.
3 For a general discussion of the age and gender structure of the mission populations see Robert H.
Jackson, A Population History of the Missions of the Jesuit Province of Paraquaria. Newcastle upon
Tyne: Cambridge Scholars Publishers, 2019, pp. 101-106.
F R O N T E R A S de la H I S T O R I A Vo l . 2 6, N.° 1. e ne ro -j u nio d e 2 021 293The Guenoa Minuanos and the Jesuit Missions among the Guaraní
60
59
58
57
56
55
54
53
52
51
50
49
1643
1648
1653
1658
1663
1668
1673
1678
1683
1688
1693
1698
1703
1708
1713
1718
1723
1728
1733
1738
1743
1748
1753
1758
1763
1768
1773
1778
1783
1788
1793
1798
➻ F igu r e 7.
Females as a percentage of the total population of San Francisco de Bor-
ja Mission, 1719-1793
Source: Made by the author based on tables included in the appendices.
50
45
40
35
30
25
20
15
10
5
0
1643
1648
1653
1658
1663
1668
1673
1678
1683
1688
1693
1698
1703
1708
1713
1718
1723
1728
1733
1738
1743
1748
1753
1758
1763
1768
1773
1778
1783
1788
1793
1798
➻ F igu r e 8 .
Párvulos as a percentage of the total population of San Francisco de Bor-
ja Mission, 1710-1765
Source: Made by the author based on tables included in the apendices.
294 Vo l . 2 6, N.° 1. e nero -ju ni o d e 2 021 F R O N T E R A S de la H I S T O R I ABy Way of Conclusion: Non-Sedentary
Robert H. Jackson
Indigenous Peoples and Missions as
places of refuge
The Jesuits and other missionaries encountered considerable difficulty in trying
to convince non-sedentary and non-agricultural peoples to settle in missions and
to change their way of life by adopting a sedentary lifestyle as agriculturalists.
The missionaries failed to understand the logic of gendered values that de-
fined social status, and environmentally-adapted ways of obtaining sustenance.
European-style agriculture entailed a change in the gendered division of labor
that did not appeal to many groups. However, some non-sedentary groups used
the missions as places of refuge for children, women, and the elderly while men
went off to war or to hunt. An example of this was the Jesuit Chaco mission
San Fernando de Abipones founded in 1750. The demographic profile of the
mission population and the patterns of the administration of the sacraments
show an absence of most men. The equestrian Abipones men acquired their
status by way of their abilites as hunters and warriors, and most likely, found
agriculture to have been closed to the gendered work of collecting wild plant
foods performed by women. Ironically, the Jesuits hired non-Abipones to do
work in the mission (Jackson, Demographic Change; Salinas, “San Fernando”).
A second example is that of the non-sedentary bands collectively known
as the Karankawas that lived on the Gulf Coast of present-day Texas. The Fran-
ciscans established three missions in the region: Espíritu Santo (1722), Rosario
(1754), and Refugio (1793). The Karankawas practiced seasonal transhumance
between prairie and coastal sites. The evidence shows seasonal fluctuations in
the populations of the missions as the neophytes left and returned to the mis-
sions. There were also shifts in the age and gender structures of the missions
with the comings and goings of the neophytes (Jackson, “Congregation”).
A baptismal register from Refugio mission in the years 1807-1828 recorded
the baptisms of 145 natives, and documented evidence of baptisms of children
that were born away from the mission from parents previously baptized at the
mission. There is also evidence of the underreporting of burials, since many
Karankawas died away in the mission, a case also seen at the San Fernando
de Abipones mission (Jackson, “Congregation” 16-17). The Karankawas fit
the missions into their seasonal pattern of migration, entereing and leaving the
missions at will. In October of 1795, for example, at the time of the migration
F R O N T E R A S de la H I S T O R I A Vo l . 2 6, N.° 1. e ne ro -j u nio d e 2 021 295The Guenoa Minuanos and the Jesuit Missions among the Guaraní
to the coast, there were 56 natives on Refugio and 82 absent. Returning to the
mission required young children to be baptized. (Jackson, “Congregation” 16-17).
The Guenoa Minuanos were an ethnicity politically and socially organized
in small bands. Some bands opted to enter the missions, and particularly San
Francisco de Borja. If the Jesuits there had handled the settlement of Guenoa
Minuanos as those at Corpus Christi did with the Guañanas, they would have
wound up in cacicazgos under their own leaders. It was significant that the
Black Robes attracted large numbers of Guenoa Minuanos to the mission; it is
therefore conceivable that these bands were geographically closest to that mis-
sion which, perhaps, saw the greatest benefit from an alliance with the Jesuits.
The Banda Oriental and Rio Grande do Sul lied over a contested border-
land between Spain and Portugal, while indigenous groups such as the Guenoa
Minuanos, Yaros, and Charrúa took sides in the struggle. The 1707-1708 military
campaign shows that some Guenoa Minuanos bands enacted an alliance with
the Portuguese rather than with the Spanish, continued to uphold their way
of life, yet incorporated the Spanish colonial regime. Military campaigns in
1750-1751 and again in 1794 forced some bands into the missions, although the
question of how long they may have remained is still unanswered. The Guenoa
Minuanos who settled on San Francisco de Borja and other missions may have
done so to avoid other forms of exploitation, particularly, enslavement by the
Portuguese. In this regard the missions served as a hideaway.
296 Vo l . 2 6, N.° 1. e nero -ju ni o d e 2 021 F R O N T E R A S de la H I S T O R I AAppendices
Robert H. Jackson
➻ Ta b l e 1.
Population of Jesús María de los Guenoas Mission
Year Population Families AFS*
1690 324 74 4.5
1693 295 74 4.0
1694 298 85 3.5
1698 200 80 2.5
1700 291 80 3.6
1702 200 79 2.5
1705 288 87 3.0
1706 297 97 3.1
1708 303 28 10.8
1714 357
1715 281 67 4.2
1716 307 86 3.6
1717 283 85 3.3
1719 238 51 4.7
*AFS - Average Family Size.
Source: BNB, CA, Annua de las Doctrinas del Paraná y Uruguay… del año de 1693; Annua de
las Doctrinas delParaná y Uruguay… del año de 1694; Estado de las reducciones del Paraná
de este año de 1698; Annua Doctrinas del Uruguay del año de 1698; Anuas de las Misiones
del Uruguay del año de 1700; Estado de las Doctrinas del Uruguay al fin del año de 1705;
Estado de las Doctrinas del Uruguay al fin del año de 1706; Estado de las Doctrinas del
Uruguay del año de 1715; Estado de las Doctrinas de Paraguay del año de 1716; Estado de las
Doctrinas de Paraguay del año de 1717; Jackson, Demographic Change, 248.
F R O N T E R A S de la H I S T O R I A Vo l . 2 6, N.° 1. e ne ro -j u nio d e 2 021 297➻ Ta b l e 2.
The Guenoa Minuanos and the Jesuit Missions among the Guaraní
Adult Baptisms Recorded at San Francisco de Borja, selected years
Year Adult Baptisms Year Adult Baptisms
1687 1 1702 33
1688 10 1703 30
1689 46 1704 16
1690 19 1705 19
1691 6 1707 1
1692 12 1721 1
1693 25 1725 11
1694 16 1726 1
1695 15 1727 22
1696 5 1728 4
1697 4 1729 8
1698 4 1730 29
1699 8 1731 13
1701 10 1732 31
Source: BNB, CA, Relación de los Bautismos del Pueblo de San Francisco de Borja desde el año
de su fundación en 1687 hasta el presente año de 1732.
➻ Ta b l e 3 .
The Population and Birth and Death Rates of San Francisco de Borja
Year Population Families Baptisms Burials CBR CDR AFS**
1690 2396 658 188 117 80.2* 50.3* 3.6
1691 2735 667 252 114 105.2 47.6 3.6
1692 - - 257 - 107.3 - -
1693 2802 695 241 167 88.3* 61.2* 4.0
298 Vo l . 2 6, N.° 1. e nero -ju ni o d e 2 021 F R O N T E R A S de la H I S T O R I ARobert H. Jackson Year Population Families Baptisms Burials CBR CDR AFS** 1694 2888 701 224 138 79.9 49.3 4.1 1698 2688 695 208 138 79.5* 52.7* 3.9 1700 2549 734 ? 154 3.5 1702 2600 780 200 144 78.6* 56.6* 3.3 1703 - - 254 - 97.7 - - 1705 2572 755 209 144 83.4* 57.4* 3.4 1706 2743 796 246 143 95.7 55.6 3.5 1707 2814 757 235 103 85.7 37.6 3.7 1708 2897 778 233 150 82.8 53.3 3.7 1711 3081 771 190 - 62.9 - 4.0 1712 - - 252 - 87.8 - - 1715 3391 834 236 121 70.0 35.9 4.1 1716 3514 835 229 86 67.5 25.4- 4.2 1717 3757 843 243 195 69.2 55.5 4.5 1719 2673 524 205 92 80.1* 35.9* 5.1 1720 2864 548 168 - 62.9 - 5.2 1721 - - 128 - 44.7 - - 1724 2906 574 173 97 61.4* 34.3* 5.1 1725 - - 203 - 69.9 1728 3366 774 242 191 71.9* 56.7* 4.4 1729 3297 609 91 260 38.5 109.9 5.4 1730 - - 238 - 72.2 - - 1731 3629 687 281 128 80.8* 36.8* 5.3 1732 3679 696 232 - 63.9 - 5.3 F R O N T E R A S de la H I S T O R I A Vo l . 2 6, N.° 1. e ne ro -j u nio d e 2 021 299
The Guenoa Minuanos and the Jesuit Missions among the Guaraní

                                                                Year      Population                     Families     Baptisms   Burials    CBR         CDR     AFS**

                                                                1733              3658                         675      147        359      40.0        97.6      5.4

                                                                1735              3277                         549      228        90       71.1*       30.4*    6.0

                                                                1736               3358                         571     201        116       56.1       49.1      5.9

                                                                1737              3430                         577      216        111       62.5        33.1    6.0

                                                                1738              2998                         450      144        192      42.0        56.0      6.7

                                                                1739              3244                         450      139        129      46.4        43.2      7.2

                                                                1740               3291                        570      189        88        58.3       27.1      5.8

                                                                1741              3430                         670      192        103       58.3        31.3     5.1

                                                                1744              3814                         709      247        116       63.8       30.0      5.4

                                                                1745              3924                         728      205        151       53.8       65.8      5.4

                                                                1746              4081                         770      225        134       57.3       34.2      5.3

                                                                1747               3233                        599      162        142       39.7       34.8      5.4

                                                                1748              3493                         633      143        148      44.7        45.8      5.5

                                                                1749               3541                        650      180        328       51.5       93.9      5.5

                                                                1750              3435                         632      231        131       65.2       37.0      5.5

                                                                1753               3232                        622      141        136      40.4        39.0      5.2

                                                                1754              2841                         522      180        92        55.7       28.5      5.4

                                                                1756              1668                          356      72        42        23.9        13.9    4.7

                                                                1759               3911                        737      192        113      50.1*       29.5*     5.3

                                                                1762              2714                         598       97        156       32.8       52.8      4.5

                                                                1763              2602                          558     121        170      44.6        62.6     4.7

                                                                1764              2893                         489      187        341       71.9       131.1     5.9

                                                                1765               2755                        548      143        378      49.4        130.7     5.0

                                                                1766              2546                         499      134        165      48.6        59.9      5.7

300                                                                    Vo l . 2 6, N.° 1. e nero -ju ni o d e 2 021     F R O N T E R A S   de   la   H I S T O R I A
Robert H. Jackson
Year Population Families Baptisms Burials CBR CDR AFS**
1767 2583 521 100 69 39.2 27.1 5.0
1793 2154 649 154 118 72.7* 55.7* 3.3
1797 2403 517 173 160 72.4* 67.0* 4.7
1798 2267 521 144 136 60.0 56.6 4.4
1799 2284 499 147 118 64.8 52.1 4.6
1800 88
1801 2413 97
1802 100
1803 91
1804 163 68
1805 109 62
1806 105 64
1807 161 69
1808 144 64
1809 147 262
1810 132 75
1811 133 70
*Estimated
**AFS - Average Family Size
Source: BNB, CA, Annua de las Doctrinas del Paraná y Uruguay…del año de 1693; Annua de
las Doctrinas del Paraná y Uruguay…del año de 1694; Estado de las reducciones del Paraná
de este año de 1698; Annua Doctrinas del Uruguay del año de 1698; Anuas de las Misiones
del Uruguay del año de 1700; Estado de las Doctrinas del Uruguay al fin del año de 1705;
Estado de las Doctrinas del Uruguay al fin del año de 1706; Estado de las Doctrinas del
Uruguay del año de 1715; Estado de las Doctrinas de Paraguay del año de 1716; Estado de las
Doctrinas de Paraguay del año de 1717; Jackson, Demographic Change 239-242.
F R O N T E R A S de la H I S T O R I A Vo l . 2 6, N.° 1. e ne ro -j u nio d e 2 021 301The Guenoa Minuanos and the Jesuit Missions among the Guaraní
Bibliogr aphy
Pr i m a ry sou rce s
Biblioteca Nacional, Rio de Janeiro, Brasil (BNB)
Coleção de Angelis (CA)
Annua de las Doctrinas del Paraná y Uruguay… del año de 1693.
Annua de las Doctrinas delParaná y Uruguay… del año de 1694.
Anuas de las Misiones del Uruguay del año de 1700.
Annua del pueblo de Loreto de 1702.
Annua de los dos Pueblos de la Candelaria y de S. Cosme y S. Damian por 1702.
Annua Doctrinas del Uruguay del año de 1698.
Estado de las Doctrinas de Paraguay del año de 1716.
Estado de las Doctrinas de Paraguay del año de 1717.
Estado de las Doctrinas del Uruguay al fin del año de 1705.
Estado de las Doctrinas del Uruguay al fin del año de 1706.
Estado de las Doctrinas del Uruguay del año de 1715.
Estado de las Doctrinas del Uruguay al fin del año de 1705.
Estado de las Doctrinas del Uruguay al fin del año de 1706.
Estado de las Doctrinas del Uruguay del año de 1715.
Estado de las reducciones del Paraná de este año de 1698.
La Carta Annua [de las misiones del Uruguay] del año pasado de 1705.
Francisco Medrano, S.J., San Francisco de Borja, February 14, 1708, Estado y moti-
vos de la guerra que se hace a los Indios Guenoas, Yaros y Mbohas.
Relacion de los Bautismos del Pueblo de San Francisco de Borja desde el año de su
fundación en 1687 hasta el presente año de 1732.
Secon da ry sou rce s
Bracco, Diego. “Charrúas, bohanes, pampas y guenoa minuanos en los pueblos de misio-
nes”. Folia Histórica del Nordeste, n.° 27, 2016, pp. 199-212. https://doi.org/10.30972/
fhn.0271227
---. “Los guenoa minuanos misioneros” Memoria Americana Cuadernos de Etnohistoria, vol. 24
n.° 1, 2016, pp. 33-54. DOI: https://doi.org/10.34096/mace.v24i1.2612
---. “Charrúas y aculturación: la primera década en Concepción de Cayastá (1750-1760)”
Revista Tefros, vol. 14 n.° 1, 2016, pp. 6-52.
302 Vo l . 2 6, N.° 1. e nero -ju ni o d e 2 021 F R O N T E R A S de la H I S T O R I ARobert H. Jackson
Jackson, Robert H. “Demographic Patterns in the Jesuit Missions of the Rio de la Plata
Region: The Case of Corpus Christi Mission, 1622-1802”. Colonial Latin American
Historical Review, vol. 13 n.° 4, 2004, pp. 337-366.
---. “Congregation and Depopulation: Demographic Patterns in the Texas Missions”. The
Journal of South Texas, vol. 17 n.° 2, 2004, pp. 6-38.
---. “The Guaycuros, Jesuit and Franciscan Missionaries, and José de Gálvez: the Failure of
Spanish Policy in Baja California”. Memoria Americana, vol. 12, 2004, pp. 221-233.
---. Demographic Change and Ethnic Survival among the Sedentary Populations on the Jesuit
Mission Frontiers of Spanish South America, 1609-1803: The Formation and Persistence of
Mission Communities in a Comparative Context. Leiden: Brill Academic Publishers, 2015.
---. “Demographic patterns of sedentary and non-sedentary populations: Jesuit missions in
lowland South America and Franciscan Missions in the Sierra Gorda Region of Mexi-
co”. Memoria Americana. Cuadernos de Etnohistoria, vol. 25 n.° 2, 2017, pp. 47-68.
---. “La población y tasas vitales de las otras misiones jesuíticas de la Provincia de Paraguay y
Moxos”. IHS Antiguos Jesuitas en Iberoamérica,vol. 6 n°1, 2018, pp. 104-118.
---. Regional Conflict and Demographic Patterns on the Jesuit Missions among the Guaraní in
the Seventeenth and Eighteenth Centuries. Leiden: Brill Academic Publishers, 2019.
---. Population History of the Missions of the Jesuit Province of Paraquaria. Newcastle upon
Tyne: Cambridge Scholars Publishers, 2019.
Levinton, Norberto. “Las estancias de Nuestra Señora de los Reyes de Yapeyú: tenencia de
la tierra por uso cotidiano, acuerdo interétnico y derecho natural (Misiones jesuíticas
del Paraguay)”. Revista complutense de historia de América, vol. 31, 2005, pp. 33-51.
---. “Guaraníes y charrúas: una frontera exclusivista-inclusivista”. Revista de Historia Regional
vol. 14 n.° 1, 2009, pp. 49-75.
Salinas, María Laura. “San Fernando del Rio Negro: Un intento evangelizador jesuítico
a los Abipones” Diálogos, vol. 13 n.° 2, 2009, pp. 293-322. https://doi.org/10.4025/
dialogos.v13i2.406
F R O N T E R A S de la H I S T O R I A Vo l . 2 6, N.° 1. e ne ro -j u nio d e 2 021 303You can also read