Russian forest sequesters substantially more carbon than previously reported
←
→
Page content transcription
If your browser does not render page correctly, please read the page content below
www.nature.com/scientificreports
OPEN Russian forest sequesters
substantially more carbon
than previously reported
Dmitry Schepaschenko1,2,3*, Elena Moltchanova4, Stanislav Fedorov5, Victor Karminov1,7,
Petr Ontikov5, Maurizio Santoro8, Linda See2, Vladimir Kositsyn6, Anatoly Shvidenko2,9,
Anna Romanovskaya10, Vladimir Korotkov10, Myroslava Lesiv2, Sergey Bartalev11,
Steffen Fritz2, Maria Shchepashchenko7 & Florian Kraxner2
Since the collapse of the Soviet Union and transition to a new forest inventory system, Russia has
reported almost no change in growing stock (+ 1.8%) and biomass (+ 0.6%). Yet remote sensing
products indicate increased vegetation productivity, tree cover and above-ground biomass. Here,
we challenge these statistics with a combination of recent National Forest Inventory and remote
sensing data to provide an alternative estimate of the growing stock of Russian forests and to assess
the relative changes in post-Soviet Russia. Our estimate for the year 2014 is 111 ± 1.3 × 10⁹ m3, or 39%
higher than the value in the State Forest Register. Using the last Soviet Union report as a reference,
Russian forests have accumulated 1163 × 106 m3 yr-1 of growing stock between 1988–2014, which
balances the net forest stock losses in tropical countries. Our estimate of the growing stock of
managed forests is 94.2 × 10⁹ m3, which corresponds to sequestration of 354 Tg C yr-1 in live biomass
over 1988–2014, or 47% higher than reported in the National Greenhouse Gases Inventory.
Russia has been reporting almost no changes in forested area, growing stock volume (GSV) and biomass to
the United Nations Framework Convention on Climate Change (UNFCCC)1 and the Food and Agriculture
Organization of the United Nations (FAO) Forest Resources Assessment (FRA)2 since the collapse of the USSR
and the decline in the Soviet Forest Inventory and Planning (FIP) system. According to the State Forest Register
(SFR)3, which is the main repository of forest information, and national reporting to the FAO F RA2, the GSV
and the above ground biomass (AGB) increased by 1.1% and 0.6% (Table S1), respectively, during 1990–2015, yet
studies using remote sensing (RS) indicate increased vegetation p roductivity4, tree cover (annual rate + 0.417%
over 1982–2016)5, increased AGB (+ 329 Tg C yr−1 over 2000–20076), total biomass (annual rate + 0.44% or + 153
Tg C yr−1 over 1990–20077), and forest ecosystem carbon pools (ca + 470 Tg C yr−1 over 2001–20198). This
inconsistency in estimates can be explained by an information gap that appeared when Russia decided to move
from the FIP to another system for the collection of forest information at the national scale – the National For-
est Inventory (NFI).
The FIP involves revisiting every forest stand (on the ground for managed forests or using RS techniques for
remote non-commercial forests) on a 10–15-year interval, with the measurement of forest parameters combined
with the formulation of forest management directives. After the collapse of the USSR, the inventory within the
FIP system slowed down substantially. For example, more than 50% of the forest area was surveyed by the FIP
more than 25 years a go9. For these reasons, the reliability of information on forests in Russia has deteriorated
1
Center for Forest Ecology and Productivity of the Russian Academy of Sciences, Profsoyuznaya 84/32/14,
Moscow, Russia 117997. 2International Institute for Applied Systems Analysis, 2361 Laxenburg, Austria. 3Siberian
Federal University, Svobodny pr, Krasnoyarsk, Russia 660041. 4School of Mathematics and Statistics, University
of Canterbury, Christchurch 8041, New Zealand. 5FSBI Roslesinforg, Federal Forestry Agency, Volgogradsky
pr. 45, Moscow, Russia 109316. 6Federal Forestry Agency, Pyatnitskaya, 59/19, Moscow, Russia 115184. 7Russian
Institute of Continuous Education in Forestry, Institutskaya 17, Pushkino, Russia 141200. 8Gamma Remote
Sensing, 3073 Gümligen, Switzerland. 9V.N. Sukachev Institute of Forest, Siberian Branch of the Russian Academy
of Science, Academgorodok 50(28), Krasnoyarsk, Russia 660036. 10Yu. A. Izrael Institute of Global Climate and
Ecology, Glebovskaya 20B, Moscow, Russia 107258. 11Space Research Institute of the Russian Academy of
Sciences, Profsoyuznaya 84/32, Moscow, Russia 117997. *email: schepd@iiasa.ac.at
Scientific Reports | (2021) 11:12825 | https://doi.org/10.1038/s41598-021-92152-9 1
Vol.:(0123456789)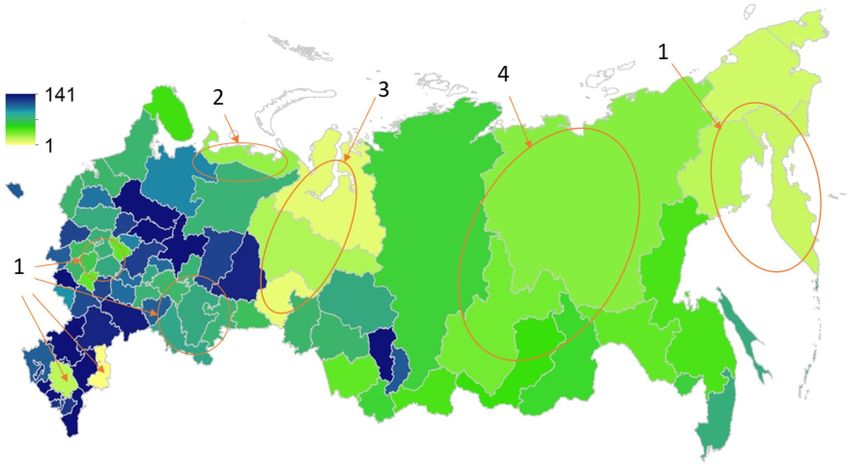
www.nature.com/scientificreports/
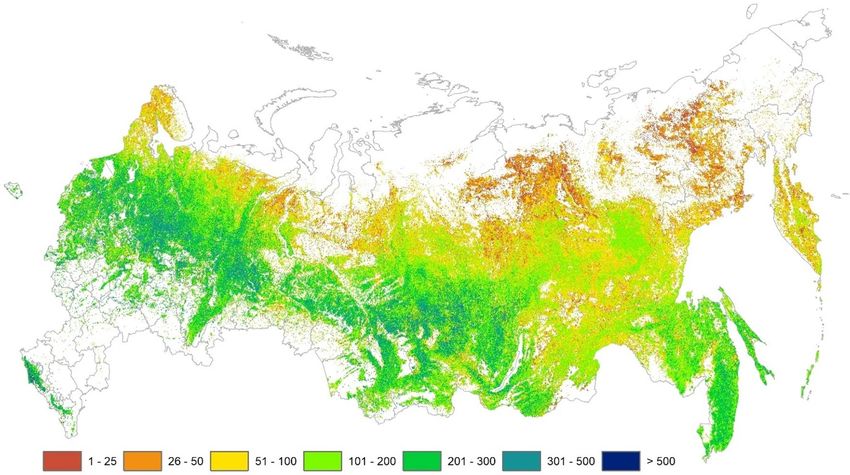
Figure 1. Predicted mean forest growing stock volume ( m3 ha-1) for the year ca 2014 (Generated by Esri
ArcGIS Desktop v.10.7, URL: https://desktop.arcgis.com/en/arcmap/).
since 1988, which is the year when FIP-based r eporting10 involved the largest inventory efforts in recent dec-
ades. According to this r eport10, the total GSV of Russian forests was 81.7 × 10⁹ m3 (without shrubland, bias
corrected11). This value is used here as a reference to quantify biomass stock changes in Russia with respect to
the current decade.
In contrast, NFI is a state-of-the-art inventory system based on a statistical sampling method. It was initi-
ated in 2007 and the first cycle was completed in 2020. The NFI data processing is ongoing, but the first official
press release12 suggests that Russian forest accumulated 102 × 109 m3 over its lifespan until 2014. Once finalized,
the NFI will be verified before adoption as the official source of information to the SFR and national reporting.
The NFI has received some c riticism13 because of the relatively sparse sampling employed and the stratification
method used, which is partially based on outdated FIP data.
In Russia, the long intervals between consecutive surveys and the difficulty in accessing very remote regions
in a timely manner by an inventory system make satellite RS an essential tool for capturing forest dynamics
and providing a comprehensive, wall-to-wall perspective on biomass distribution. However, observations from
current RS sensors are not suited for producing accurate biomass estimates unless the estimation method is
calibrated with a dense network of measurements from ground s urveys14. Here we calibrated models relating two
global RS biomass data products (GlobBiomass G SV15 and CCI Biomass GSV16) and additional RS data layers
(forest cover m ask , the Copernicus Global Land Cover CGLS‐LC100 product17) with ca 10,000 ground plots
9
(see Material and Methods) to reduce nuances in the individual input maps due to imperfections in the RS data
and approximations in the retrieval procedure18,19. The combination of these two sources of information, i.e.,
ground measurements and RS, utilizes the advantages of both sources in terms of: (i) highly accurate ground
measurements and (ii) the spatially comprehensive coverage of RS products and methods. The amount of ground
plots currently available may be insufficient for providing an accurate estimate of GSV for the country when used
alone, but they are the key to obtaining unbiased estimates when used to calibrate RS datasets20. The map merging
procedure was preferred over a plot-aided direct estimation of GSV or AGB from the RS data because of the usu-
ally poor association between biomass measured at inventory plots and remote sensing observables21. In addition,
models relating biomass and remote sensing observables that are trained with spatially inhomogeneous datasets
(Figure S1) tend to be biased in regions not represented by the dataset of the reference biomass measurements.
We estimate the total GSV of Russia for the year 2014 for the official forested area (713.1 × 10⁶ ha) to be
111 ± 1.3 × 10⁹ m3, which is 39% higher than the 79.9 × 10⁹ m3 (excluding shrubland) figure reported in the S FR3
for the same year. An additional 7.1 × 10⁹ m3 or 9% were found due to the larger forested area (+ 45.7 1 06 ha) rec-
ognized by RS9, following the expansion of forests to the north22, to higher elevations, in abandoned arable land23,
as well as the inclusion of parks, gardens and other trees outside of forest, which were not counted as forest in
the SFR. Based on cross-validation, our estimate at the regional level (81 regions of Russia – Table S2, Figure S2)
is unbiased. The standard error varied from 0.6 to 17.6% depending on the region. The median error was 1.6%,
while the area weighted error was 1.2%. The predicted GSV (Fig. 1) with associated uncertainties is available
here (https://doi.org/10.5281/zenodo.3981198) as a GeoTiff at a spatial resolution of 3.2 arc sec. (ca 0.5 ha).
Houghton et al.24 estimated forest biomass based on RS and FIP data in Russia for the year 2000. Average
forest biomass density varied between 80.6 and 88.2 Mg ha-1 depending on which forest mask was used. Our
estimate for the year 2014 of 107 Mg ha-1 (using the conversion factor of GSV to AGB from24 0.6859) is 21–33%
Scientific Reports | (2021) 11:12825 | https://doi.org/10.1038/s41598-021-92152-9 2
Vol:.(1234567890)www.nature.com/scientificreports/
Figure 2. Change in growing stock volume (m3 ha-1) from 1988 to 2014 (average over administrative regions)
(Generated by Esri ArcGIS Desktop v.10.7, URL: https://desktop.arcgis.com/en/arcmap/). These changes can
be categorized into: 1—significant increase in air temperature and drought; 2—substantially increased forest
area, which lowers the average GSV density; 3—least (not significant) temperature increase; 4—increase of
disturbances: wildfire and harvest (southern part), which offsets the climate stimulation effect.
higher than the one by Houghton et al., but this is consistent with expected biomass increases over time, i.e.,
14 years after the Houghton et al. estimate.
Assuming an unchanged total forest area (721.7 × 10⁶ ha) in 1988 and 2014, we conclude that Russian forests
have accumulated 1,163 × 106 m3 yr-1 or 407 Tg C y r-1 in live biomass of trees on average over 26 years. This gives
an average GSV change rate of + 1.61 m3 ha-1 yr-1 or + 0.56 t C ha-1 yr-1. The sequestration rate obtained, however,
should be treated with caution because different methods have been applied in 1988 and 2014 (see “Caveats
and Limitations” section). To provide some context for the magnitude of these numbers, one can compare the
Russian forest gain to the net GSV losses in tropical forests over the period 1990–2015 according to FAO F RA25
(-1,033 × 106 m3 yr-1 in the regions with a negative trend: South and Central America, South and Southeast
Asia, and Africa). A similar divergence in the carbon sink between Tropical and Boreal forest was recognized
by Tagesson et al.26.
In terms of carbon stock change, our estimates are substantially higher than those reported by Pan et al.7 for
1990–2007 (+ 153 Tg C yr-1) based on FIP data. The biomass carbon estimates by Liu et al.6 are instead in line
with our results. There is an increase in the annual rate of AGB in Russia of + 329 Tg C yr−1 (annual variation
from 214 to 400 Tg C y r−1) over 2000–20076. Interestingly, another boreal country – Canada – has demonstrated
neutral or negative trends (from 0 to -14 Tg C y r−1) for the same time span using the same estimation m ethod6.
We can observe different spatial patterns in the change in the GSV density between 1988 (FIP10, bias
corrected11) and 2014 (our estimate), which can be explained by climate change, C O2 fertilisation and changes
in disturbance regimes (Fig. 2). The average linear trend in the annual temperature increase during 1976–2014
in Russia is + 0.45 °C per 10 years27. The temperature increase is statistically significant in every region except
for western Siberia (Fig. 2–3). Significantly increased temperature extremes and an increase in the number of
days without precipitation is observed in the south of European Russia, Baikal, Kamchatka, and Chukotka27
(Fig. 2–1). Some regions in the south of the European part of Russia are colored in dark blue, but they, as a rule,
have a small share of forested area, which is often linked to water bodies and, therefore, suffers less from increased
drought (Fig. 2–1). Central and eastern Siberia suffer from an increase in disturbances, which offsets the climate
stimulation effect (Fig. 2–4). The forested area in the Nenets region (Fig. 2–2) is 4 times larger in 2014 based on
the RS forest mask compared to the SFR in 1988 (where forest was accounted for up until a certain latitude at
that time), where the increase in area resulted in a decrease in the average GSV.
Focusing specifically on national reporting of managed forest to the UNFCCC, 72% of forested area in Russia
is considered to be m anaged1. We multiplied the GSV density by the managed forest area for each administrative
region (Table S3). The difference in GSV estimation (between ours and the one from the SFR report) is 23.6 × 10⁹
m3 (Table S3) or 33% higher. From the GSV of managed forests in 2014 and based on the same area in 1988, we
can estimate the sequestration rate of live biomass of managed forests as 354 Tg C y r-1 , which is considerably
higher than the figure of 230 Tg C y r-1 in the current report1.
This proof of concept demonstrates the relevance of complementing recent NFI data with remote sensing
map products. Our study demonstrates that the already considerable value of forest inventory data can be further
enhanced in a forest resources mapping scenario. In addition, we seek to promote greater access to these data
Scientific Reports | (2021) 11:12825 | https://doi.org/10.1038/s41598-021-92152-9 3
Vol.:(0123456789)www.nature.com/scientificreports/
by opening up their access to the larger scientific community. Through the integration of RS estimates of GSV
and forest inventory data from Russia, we confirm that carbon stocks increased substantially during the last
few decades in contrast to the figures provided in official national reporting. Russian forests play an even more
important global role in carbon sequestration than previously thought, where the increase in growing stock is
of the same magnitude as the net losses in tropical forests over the same time period.
Material and methods
Ground data. Measurements of GSV consisted of observations from forest plots from both the NFI and the
Forest Observation System (FOS)28, which were used to ground truth the model by relating inventory meas-
urements and RS data products. The NFI implements a random stratified sampling of forests. The plots have a
circular shape and cover an area of 0.05 ha13. A full set of inventory plots from 10 regions in Russia (Table S2)
was available for the first time to undertake research studies outside of the NFI. The FOS28 offers free access to
research forest plots with a size of 0.25 ha or larger. In total, 8,988 NFI (after data screening and verification,
see section “Forest plot data screening”) and 100 FOS plots were gathered (Figure S1). The dataset covers the
full range of GSV (Figure S2), all climatic zones and a major diversity of forest types. The calibrating dataset is
described in Table S4 and available in csv format in the Supplementary Information. The ground measurements
were collected between 2008 and 2019 (with the median falling in 2014).
As in many other countries, the NFI data (with plot coordinates) are restricted for sharing and use. For the
first time, we obtained access to a portion of the primary NFI data with precise location information under the
condition that the initial data processing was physically undertaken at the location of the authorized division
(“Roslesinforg”) of the Federal Forestry Agency.
Remote sensing data products and other maps. We used several RS-based maps to predict the spatial
distribution of GSV in Russia for around the epoch 2014 as follows:
• The global GlobBiomass map of GSV15,19 is based on the Phased Array-type L-band Synthetic Aperture Radar
(PALSAR) onboard the Advanced Land Observing Satellite (ALOS) satellite, and the Advanced Synthetic
Aperture Radar (ASAR) onboard the Environmental Satellite (Envisat) observations acquired around the
year 2010 with a spatial resolution of the final product of 3.2 arc sec. (0.496 ha for Russia on average), units
m3 ha-1. The map is obtained from a physically-based model that relates GSV to the input remote sensing
observations. To estimate the parameters of the model, a so-called self-calibration approach based on image
statistics was a pplied19, thus overcoming the use of reference GSV measurements from field inventory or
existing maps.
• The global Climate Change Initiative (CCI) Biomass map of G SV16 is based on ALOS-2 PALSAR-2 (2015–
2017) and the Sentinel-1 data, acquired in 2017. It has the same units, spatial resolution and generating
algorithm as the GlobBiomass map.
• The Copernicus Global Land Cover CGLS‐LC100 product17 is based on optical data acquired around the
year 2015 and has a similar resolution (3.6 arc sec.). The dataset stratifies forests into four classes: evergreen
needleleaf, deciduous needleleaf, deciduous broadleaf and mixed forest.
• The forest mask for the year 2015: is a hybrid product based on the methodology described i n9. It has a 3.2
arc sec. spatial resolution.
• The ecological zone map 29 includes classes of forest-tundra, north taiga, middle taiga, south taiga, temperate
forest, and forest-steppe.
In addition, results were evaluated using a map of 81 administrative regions (Table S2, Table S3).
Forest plot data screening. To calibrate the RS maps with the aid of the inventory measurements, it
was necessary to ensure that the plot measurements and the map values were consistent. Very high-resolution
imagery provided by Google Earth was used to filter out records that were characterized by obvious contradic-
tions in terms of biomass values and forest cover. Figure S3a shows an example of a forest felled in 2009. The
sample plot was measured in 2008 before the disturbance while the RS data were collected in 2010 after the
disturbance. The sample plot in Figure S3b is situated at the edge of the forest and is not representative of the RS
pixel, which covers partly non-forested area. As a result of this data screening process, up to 10% of plots in some
regions were discarded. The plot-to-pixel comparison of GSV values (Figure S4) still reveals some substantial
divergences, which can be attributed to the following reasons:
1. The size of the NFI plot is about 10% of the area of a GlobBiomass pixel (i.e., 0.05 ha vs. ca 0.5 ha).
2. The estimations made on the ground and remotely were not simultaneous.
3. The method used to estimate GSV based on RS data implements a regional cut-off level to avoid unrealistic
estimates and biases19. These cut-off levels imply that extreme GSV values are strongly underestimated.
Growing stock prediction model. We used 20-fold cross-validation to compare the predictive fit of sev-
eral models to calibrate the RS maps with ground measurements. Based on the model performance statistics
such as mean error (ME), mean absolute error (MAE), and mean squared error (MSE) (see Table S5), the fol-
lowing linear model was selected:
Scientific Reports | (2021) 11:12825 | https://doi.org/10.1038/s41598-021-92152-9 4
Vol:.(1234567890)www.nature.com/scientificreports/
E(GSVGT ) = a0,zone + b0,PFT + a1,zone + b1,PFT × GSVGB + a2,zone + b2,PFT
× GSVCCI + a3,zone + b3,zone × GSVGB × GSVCCI ,
where GSVGT – GSV estimates on the ground sample plots, m3 ha-1; GSVGB – GlobBiomass GSV, m3 ha-1; GSVCCI
– CCI Biomass GSV, m3 ha-1; zone – bioecological zone (forest-tundra, north taiga, middle taiga, south taiga,
temperate forest, forest-steppe); PFT – forest type (evergreen needleleaf, deciduous needleleaf, deciduous broad-
leaf and mixed forest).
Since the linear model allows for negative predictions, these negative values were set to zero. However, it
should be noted, that only 0.5% of points in the calibrating dataset (ground plots) and only 1.7% of the pixels in
the testing dataset (entire country) produced negative predictions, implying negligible bias.
Recognizing that the frequency distribution of the GSV and AGB measurements varied from region to region
and that they might have differed from the respective frequency distributions in the calibrating datasets, we also
fitted a weighted linear regression model. The weighted linear regression fits parameters such that the weighted
sum of errors is zero. It can thus be used to ensure that the estimate for the average (or the sum) of predictions
over a certain area is unbiased. The weights were based on the relative frequencies of GSV in the calibrating data
and the administrative region, one at a time, evaluated in bins of width 10 from 0 to 1000.
Because the residuals of the resulting model displayed strong heteroscedasticity, the estimated standard errors
for the regression parameters could not be used to produce confidence intervals for the predictions. We have,
therefore, used 1000 bootstrapped estimates to obtain the overall estimates, standard errors and 95% confidence
intervals for the administrative area-specific GSV density per ha (see Supplementary S2. R-script fitting the
model and cross-validation).
Growing stock to biomass conversion factor. We use biomass conversion and expansion factors from
Schepaschenko et al.30 for the entire country in order to compare with other independent studies in the situation
where they do not provide GSV estimates. These factors consider species, age, stocking and the forest productiv-
ity distribution of Russian forests30. The conversion factors are as follows:
• GSV to total live biomass carbon of trees: 0.35035
• GSV to AGB carbon: 0.27923
• GSV to AGB: 0.56131
• Root-to-shoot ratio: 0.288
• We assumed that carbon content in woody biomass is around 50% and 45% for the foliage.
Caveats and limitations
This analysis employed the largest amount of forest sample plots among any other remote sensing assessments
for Russia. However, every plot represents quite large forest areas (country forest area divided by number of
ground plots = 78 × 103 ha) at the country scale and there are some large regions in Northern Asia that are not
covered (Figure S1). Currently, only a portion of the NFI data (ca 11%) were made available exclusively for this
proof of concept. However, the sample plots used cover the full range of biomass values (Figure S2), and they
represent all bioclimatic zones and the majority of forest types. More calibrating data might improve the spatial
accuracy, but they were not available at the time when this manuscript was prepared. By demonstrating the value
of the sample plot data with RS, we hope to facilitate the further opening up of these datasets in the future for
the wider scientific community.
The National Forest Inventory is currently finalizing its first cycle, so all the plots have been measured only
once. Subsequent long-term observations on these permanent plots would help to quantify changes in biomass
and other carbon pools more accurately.
The estimates of GSV in 1988 and in 2014 used different methods, which might introduce an unknown bias.
For this reason, the estimates of GSV dynamics and carbon sequestration rates need to be treated with caution.
However, the 1988 USSR forest assessment is the most reliable reference point. The massive FIP program started
in the Soviet Union in the late 1940s with the first complete country report produced in 1961, followed by national
reports every 5 years based on repeated observations. The quality of the FIP substantially improved over time.
Shvidenko and N ilsson11 analyzed the FIP method and reports based on numerous independent regional valida-
tion exercises and introduced a regional bias correction. They have shown that the 1988 report minimized the
bias of the country average GSV over the entire previous period. Both the 1988 and 2014 estimates are based on
the best available knowledge and rely on the vast field and RS measurements made.
Our GSV estimates for the year 2014 might include a portion of standing dry wood (snags), which is not
possible to quantify. We excluded snags on sample plots. However, the ratio of snag volume to GSV on the NFI
sample plots was 12% while an independent study by Shvidenko et al.31 estimated the weighted average ratio
for Russian forests at 16%. Another research study 32 in Central Siberia reports the ratio of snag volume to GSV
at 4–11% in middle taiga up to 17–19% in northern taiga. In general, snags are less recognizable using remote
instruments because of reduced crown elements. However, a portion of snags might lead to slight overestima-
tion of GSV by our method.
Data availability
The data used for this study are either publicly available (see Material and Methods section) or can be found in
the Supplementary Information.
Scientific Reports | (2021) 11:12825 | https://doi.org/10.1038/s41598-021-92152-9 5
Vol.:(0123456789)www.nature.com/scientificreports/
Code availability
The R script used in this study is given in the Supplementary Information.
Received: 24 March 2021; Accepted: 7 June 2021
References
1. National Inventory Report. National report on the cadastre of anthropogenic emissions from sources and absorptions by sinks of
greenhouse gases of Russian Federation not regulated by Montreal Protocol for 1990–2018. 480 https://u nfccc.i nt/d ocume nts/2 26417
(2020).
2. FAO. Russian Federation - Global Forest Resources Assessment 2015 – Country Report. (FAO, 2014).
3. State Forest Register. State Forest Register. https://web.archive.org/web/20171102204300/http://goslesreestr.ru:7001/ForesterFO/
(2019).
4. Guay, K. C. et al. Vegetation productivity patterns at high northern latitudes: a multi-sensor satellite data assessment. Glob. Change
Biol. 20, 3147–3158 (2014).
5. Song, X.-P. et al. Global land change from 1982 to 2016. Nature 560, 639–643 (2018).
6. Liu, Y. Y. et al. Recent reversal in loss of global terrestrial biomass. Nat. Clim. Change 5, 470–474 (2015).
7. Pan, Y. et al. A large and persistent carbon sink in the world’s forests. Science 333, 988–993 (2011).
8. Harris, N. L. et al. Global maps of twenty-first century forest carbon fluxes. Nat. Clim. Change 1–7 (2021) doi:https://doi.org/10.
1038/s41558-020-00976-6.
9. Schepaschenko, D. et al. Estimation of forest area and its dynamics in Russia based on synthesis of remote sensing products.
Contemp. Probl. Ecol. 8, 811–817 (2015).
10. Goscomless SSSR. Forest Fund of the USSR (by account for 1 January 1988). (State Committee of the USSR on Forest, 1990).
11. Shvidenko, A. & Nilsson, S. Dynamics of Russian forests and the carbon budget in 1961–1998: an assessment based on long-term
forest inventory data. Clim. Change 55, 5–37 (2002).
12. Ministry of Natural Resources of Russia. The results of the forest inventory have been summed up: the total growing stock of Rus-
sian forests exceeds 102 billion cubic meters. Ministry of Natural Resources of Russia Press Center News https://www.mnr.gov.ru/
press/news/podvedeny_itogi_inventarizatsii_lesov_obshchiy_zapas_drevesiny_v_rf_prevyshaet_102_mlrd_kubometrov/index.
php (2021).
13. Alekseev, A., Tomppo, E., McRoberts, R. E. & von Gadow, K. A constructive review of the State Forest Inventory in the Russian
Federation. For. Ecosyst. 6, 9 (2019).
14. Chave, J. et al. Ground data are essential for biomass remote sensing missions. Surv. Geophys. 40, 863–880 (2019).
15. Santoro, M. GlobBiomass - global datasets of forest biomass. https://doi.org/10.1594/PANGAEA.894711 (2018).
16. Santoro, M. & Cartus, O. ESA Biomass Climate Change Initiative (Biomass_cci): Global datasets of forest above-ground biomass
for the year 2017, v1. (2019) doi:https://doi.org/10.5285/BEDC59F37C9545C981A839EB552E4084.
17. Buchhorn, M., Bertels, L., Smets, B., Lesiv, M. & Tsendbazar, N.-E. Copernicus Global Land Service: Land Cover 100m: version 2
Globe 2015: Algorithm Theoretical Basis Document. https://zenodo.org/record/3606446 (2019).
18. Santoro, M. CCI Biomass Product User Guide. 35 https://climate.esa.int/sites/default/files/biomass_D4.3_Product_User_Guide_
V1.0.pdf (2019).
19. Santoro, M. et al. The global forest above-ground biomass pool for 2010 estimated from high-resolution satellite observations.
Earth Syst. Sci. Data Discuss. 1–38 (2020).
20. Næsset, E. et al. Use of local and global maps of forest canopy height and aboveground biomass to enhance local estimates of
biomass in miombo woodlands in Tanzania. Int. J. Appl. Earth Obs. Geoinformation 102138 (2020) doi:https://doi.org/10.1016/j.
jag.2020.102138.
21. Saatchi, S., Marlier, M., Chazdon, R. L., Clark, D. B. & Russell, A. E. Impact of spatial variability of tropical forest structure on
radar estimation of aboveground biomass. Remote Sens. Environ. 115, 2836–2849 (2011).
22. Schaphoff, S., Reyer, C. P. O., Schepaschenko, D., Gerten, D. & Shvidenko, A. Tamm review: Observed and projected climate change
impacts on Russia’s forests and its carbon balance. For. Ecol. Manag. 361, 432–444 (2016).
23. Lesiv, M. et al. Spatial distribution of arable and abandoned land across former Soviet Union countries. Sci. Data 5, 180056 (2018).
24. Houghton, R. A. et al. Mapping Russian forest biomass with data from satellites and forest inventories. Environ. Res. Lett. 2, (2007).
25. FAO FRA. Global forest resources assessment 2015. 245 http://www.fao.org/3/a-i4808e.pdf (2015).
26. Tagesson, T. et al. Recent divergence in the contributions of tropical and boreal forests to the terrestrial carbon sink. Nat. Ecol.
Evol. 4, 202–209 (2020).
27. Kattsov, V. M. et al. Second Roshydromet Assessment Report on Climate Change and its Consequences in the Russian Federation.
http://downloads.igce.ru/publications/OD_2_2014/v2014/htm/ (2014).
28. Schepaschenko, D. et al. The forest observation system, building a global reference dataset for remote sensing of forest biomass.
Sci. Data 6, 198 (2019).
29. Stolbovoi, V. & Mccallum, I. Land Resources of Russia. http://www.iiasa.ac.at/Research/FOR/russia_cd/index.htm (2002).
30. Schepaschenko, D. et al. improved estimates of biomass expansion factors for Russian forests. Forests 9, 312 (2018).
31. Shvidenko, A., Schepaschenko, D. & Nilsson, S. Assessment of woody detritus in Russian forests. For. Inventory Plan. 1(41), 133–147
(2009).
32. Mukhortova, L., Trefilova, O., Krivobokov, L., Klimchenko, A. & Vedrova, E. Coarse woody debris stock in forest ecosystems on
latitudinal gradient of Central Siberia. in International Multidisciplinary Scientific GeoConference: SGEM vol. 2 495–502 (Surveying
Geology & Mining Ecology Management (SGEM), 2016).
Acknowledgements
The FOS data collection was performed within the framework of the state assignment of the Center for Forest
Ecology and Productivity of the Russian Academy of Sciences (no. AAAA-A18-118052590019-7), and the ground
data preparation and pre-processing were financially supported by the Russian Science Foundation (project no.
19-77-30015). This study was partly supported by the European Space Agency via projects IFBN (4000114425/15/
NL/FF/gp) and CCI Biomass (4000123662/18/I-NB). Coarse woody debris for the Central Siberia estimation
was supported by the RFBR, Krasnoyarsk Territory and Krasnoyarsk Regional Fund of Science, project number
20-44-240008. We would also like to acknowledge the framework support of the International Boreal Forest
Research Association (IBFRA) and the International Union of Forest Research Organizations (IUFRO) working
party 8.01.06 – Boreal and Alpine Forest Ecosystems.
Scientific Reports | (2021) 11:12825 | https://doi.org/10.1038/s41598-021-92152-9 6
Vol:.(1234567890)www.nature.com/scientificreports/
Author contributions
D.S. designed the study and drafted the manuscript; E.M. designed statistical analysis and software; S.F. provided
access to and consultations on the forest inventory data; V.Kar. and P.O. processed the data, M.San. contributed
to the study design, provided guidelines on the use of the RS biomass datasets, validation options and revised
the manuscript; V.Kos., L.S., A.S., A.R., V.Kor., S.B., S.F., M.L., M.Shch. and F.K. provided expertise and revised
the manuscript.
Competing interests
The authors declare no competing interests.
Additional information
Supplementary Information The online version contains supplementary material available at https://doi.org/
10.1038/s41598-021-92152-9.
Correspondence and requests for materials should be addressed to D.S.
Reprints and permissions information is available at www.nature.com/reprints.
Publisher’s note Springer Nature remains neutral with regard to jurisdictional claims in published maps and
institutional affiliations.
Open Access This article is licensed under a Creative Commons Attribution 4.0 International
License, which permits use, sharing, adaptation, distribution and reproduction in any medium or
format, as long as you give appropriate credit to the original author(s) and the source, provide a link to the
Creative Commons licence, and indicate if changes were made. The images or other third party material in this
article are included in the article’s Creative Commons licence, unless indicated otherwise in a credit line to the
material. If material is not included in the article’s Creative Commons licence and your intended use is not
permitted by statutory regulation or exceeds the permitted use, you will need to obtain permission directly from
the copyright holder. To view a copy of this licence, visit http://creativecommons.org/licenses/by/4.0/.
© The Author(s) 2021
Scientific Reports | (2021) 11:12825 | https://doi.org/10.1038/s41598-021-92152-9 7
Vol.:(0123456789)You can also read