Diarrhea incidence in low- and middle-income countries in 1990 and 2010: a systematic review
←
→
Page content transcription
If your browser does not render page correctly, please read the page content below
Fischer Walker et al. BMC Public Health 2012, 12:220
http://www.biomedcentral.com/1471-2458/12/220

 RESEARCH ARTICLE                                                                                                                               Open Access

Diarrhea incidence in low- and middle-income
countries in 1990 and 2010: a systematic review
Christa L Fischer Walker1*, Jamie Perin1, Martin J Aryee2, Cynthia Boschi-Pinto3 and Robert E Black1

  Abstract
  Background: Diarrhea is recognized as a leading cause of morbidity and mortality among children under 5 years
  of age in low- and middle-income countries yet updated estimates of diarrhea incidence by age for these
  countries are greatly needed. We conducted a systematic literature review to identify cohort studies that sought to
  quantify diarrhea incidence among any age group of children 0-59 mo of age.
  Methods: We used the Expectation-Maximization algorithm as a part of a two-stage regression model to handle
  diverse age data and overall incidence rate variation by study to generate country specific incidence rates for low-
  and middle-income countries for 1990 and 2010. We then calculated regional incidence rates and uncertainty
  ranges using the bootstrap method, and estimated the total number of episodes for children 0-59 mo of age in
  1990 and 2010.
  Results: We estimate that incidence has declined from 3.4 episodes/child year in 1990 to 2.9 episodes/child year in
  2010. As was the case previously, incidence rates are highest among infants 6-11 mo of age; 4.5 episodes/child
  year in 2010. Among these 139 countries there were nearly 1.9 billion episodes of childhood diarrhea in 1990 and
  nearly 1.7 billion episodes in 2010.
  Conclusions: Although our results indicate that diarrhea incidence rates may be declining slightly, the total burden
  on the health of each child due to multiple episodes per year is tremendous and additional funds are needed to
  improve both prevention and treatment practices in low- and middle-income countries.

Background                                                                             gather 2-week point prevalence rates for low- and mid-
Diarrhea remains a leading cause of mortality among                                    dle-income countries around the world, these data can-
children under 5 years of age around the world [1]. The                                not be used to generate incidence rates because they
burden of Diarrheal disease disproportionately affects                                 can be highly affected by seasonal variation in incidence.
young children in low- and middle-income countries                                     Age-specific incidence rates acquired from cohort stu-
who have higher incidence rates due to inadequate                                      dies including at least 1 year of surveillance are the best
water and sanitation and nutritional risk factors, such as                             source of data, but these are not available for every
suboptimal breastfeeding and zinc and vitamin A defi-                                  country. Therefore, we rely on modeling to generate
ciency [2-4]. Children living in impoverished areas also                               estimates by country and region, and for the world.
have higher case-fatality rates compared to children liv-                                 Snyder and Merson first estimated diarrhea incidence
ing in high-income countries due to lack of access to                                  for young children to be 2.2 episodes/year in 1980 using
quality health care and timely and effective treatment                                 available data published between 1954 and 1979 [6].
with oral rehydration solution (ORS) and zinc [5].                                     Ten years later Bern et al. published an update of this
  There is currently no widely available source for diar-                              review using similar methodology, including more
rhea incidence estimates. While cross-sectional surveys                                recent studies, and estimated children to have 2.6 epi-
such as Demographic and Health Surveys routinely                                       sodes of diarrhea/year [7]. In 2003, Kosek et al. provided
                                                                                       another updated estimate of diarrhea morbidity conclud-
* Correspondence: cfischer@jhsph.edu                                                   ing that children have 3.2 episodes of diarrhea/year [8].
1
 Johns Hopkins Bloomberg School of Public Health, Department of                        Given it has been nearly 10 years since the last pub-
International Health, 615 N. Wolfe St, Baltimore, MD 21205, USA
Full list of author information is available at the end of the article
                                                                                       lished estimate of diarrhea morbidity, there is a great

                                         © 2012 Walker et al; licensee BioMed Central Ltd. This is an Open Access article distributed under the terms of the Creative Commons
                                         Attribution License (http://creativecommons.org/licenses/by/2.0), which permits unrestricted use, distribution, and reproduction in
                                         any medium, provided the original work is properly cited.
Fischer Walker et al. BMC Public Health 2012, 12:220 Page 2 of 7
http://www.biomedcentral.com/1471-2458/12/220
need for updated estimates of incidence rates for calcu- with chronic disease). We sought unpublished datasets
lating burden of disease and for planning at the country by contacting authors known globally for their large
level. In addition, numerous studies have been published community-based study sites, but held them to the
since the last review; thus, we sought to include updated same inclusion/exclusion standards. The initial search
data, as well as improve upon past search strategies to was conducted in June 2008 and was updated on Sept
expand the contributing of literature. 15, 2010. We first screened titles and abstracts, and
then full manuscripts for all potentially eligible papers
Methods (Figure 1). Final papers were abstracted by two trained
Systematic review and data abstraction data abstractors into a standardized abstraction
We conducted a systematic literature review to identify spreadsheet.
community-based cohort studies of children 0-59 mo of
age with at least 12 mo of diarrhea surveillance. Diar- Data analysis
rhea was defined as 3 or more loose or watery stools in We used empirical data from the literature on diarrhea
24 h. We searched PubMed, Embase, Global Health, incidence to estimate age-specific incidence rates for
and the WHO Regional Databases and used all combi- 139 low- and middle-income countries, a based on each
nations of the following search terms: diarrh(o)ea, child, country’s WHO region and under five mortality rate.
morbidity, incidence, surveillance, burden of disease, and Reported incidence rates varied widely in the literature
prevalence. We sought papers with diarrhea incidence and many studies presented truncated age cohorts (for
data. We included papers in English, French, Spanish, example, a study may include only children 0-23 mo of
and Italian published between 1980 and Aug 31, 2010 in age) or non-standard age groupings (for example, the
our search. We excluded papers with recall periods incidence for children 8-21 mo of age in lieu of 6-11
beyond 2 weeks and those conducted in unrepresenta- and 12-23 mo of age). Standard age categories include
tive populations (i.e. low birth weight infants or children 0-5 mo, 6-11 mo, 12-23 mo, 24-35 mo, 36-47 mo, and
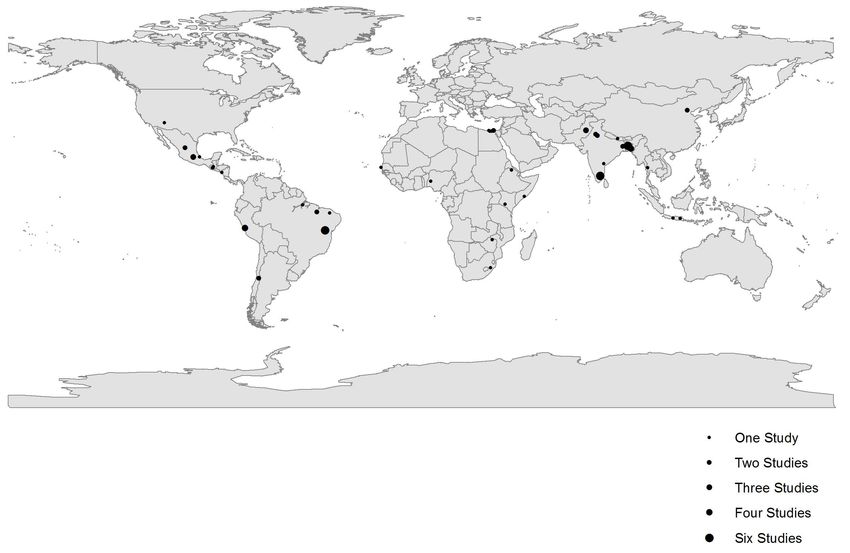
Figure 1 Flow chart diagram of the systematic review process.Fischer Walker et al. BMC Public Health 2012, 12:220 Page 3 of 7 http://www.biomedcentral.com/1471-2458/12/220 48-59 mo. If all studies reported incidence rates using by data. Because incidence is modeled using only WHO standard age groups, a simple regression model could be region and under five mortality rates, the estimated used to estimate the effect of covariates (e.g. WHO change in incidence over time is driven by changes in region and under five mortality) on age-specific inci- under five mortality. Under 5 mortality steadily declined dence. However, because a range of non-standard age from 1990 to 2010 in most countries so testing for a groups are reported and age-group specific data is decline in incidence is equivalent to testing that this sparse in many regions, we made the simplifying relationship is statistically significant. assumption that the shape of the incidence rate age We then calculated the total number of episodes of curve is the same across all countries. (e.g. the ratio of diarrhea among the 139 low- and middle-income coun- 12-23 mo incidence is a fixed multiple of the 6-11 mo tries included in this analysis by multiplying our esti- incidence regardless of country). Country-specific char- mated regional diarrhea incidence rates for all children acteristics (i.e. WHO region and under five mortality) 0-59 mo of age by the total population of children shift the incidence curve up or down, but do not alter under 5 years of age for both 1990 and 2010. the shape of the curve. The specific shape of this curve is estimated by all studies which included 0-59 and at Results least 1 age category; for this analysis this included 65 of Systematic literature review 72 studies. We screened more than 19,000 possible titles to identify To convert non-standard age group reports into preset 72 studies that met all inclusion and exclusion criteria age groups we modeled through a two-stage iterative (Figure 1). The studies were from 5 of the 6 WHO process using the Expectation-Maximization (EM) algo- regions (all except Europe) (Figure 2) and were pub- rithm. The EM algorithm can be applied to data sets lished between 1980 and 2010 representing data collec- with missing or incomplete data [9-11]. The analysis is tion between 1976 and 2006. We abstracted age-specific separated into two distinct steps. We first used the cur- incidence rates for all age categories described in the rent estimate of the incidence rate age curve to convert studies; this included 50 different age categories and 187 the observed age groups into the standard age groups. individual incidence rates from among these 72 studies For example, an incidence rate reported for the age that were included in the age adjustment and modeling group 1-23 months would be converted into estimates methods. Study characteristics including site, study type, for 0-5, 6-11, and 12-23 mo. This step is similar to an urban or rural setting, year of data collection, sample imputation where we obtain best guess estimates of the size, and incidence rate by age for the 72 included stu- incidence rates that would have been observed had the dies can be found in Additional file 1. standard age groups been reported. In the second step we then fit a regression model to the standardized age Diarrhea Incidence by age and region group incidence rates to estimate the parameters for Using the age-specific data we produced country-speci- curve shape, WHO region and under five mortality rate. fics estimates for each age category (0-5 mo, 6-11 mo, The updated curve shape parameters are then used 12-23 mo, and 24-59 mo) for 1990 and 2010 (Additional again in the first step and the process iterates repeatedly file 2). The country level data were then aggregated up until the incidence estimates are stable. to create regional estimates for 1990 and 2010 (Tables 1 We weighted country level incidences predicted by and 2). For 1990 diarrhea incidence rates were highest this model by the population of children under the age among children 6-11 mo of age (5.3 episodes/child year) of five to calculate regional age-specific estimates. In and lowest among children 24-59 mo of age (2.7 epi- order to approximate uncertainty for regional rates, we sodes/child year. Overall children experienced 3.4 epi- used the nonparametric bootstrap [12] to resample sodes of diarrhea per year. Using 1990 population study data by WHO region. We fit the model repeatedly estimates for children 0-59 mo of age we estimate that with resampled data and weighted averages taken from there were nearly 1.9 billion episodes of diarrhea among the incidences predicted by country. We report the children living in the 139 countries included in these 2.5th and 97.5th percentiles from the resulting distribu- analyses (Table 3). For 2010 diarrhea incidence rates tion of incidence for each region using a standard non- remained highest among infants 6-11 mo of age and parametric bootstrap estimator that has an approximate dropped from 5.3 to 4.5 episodes per year during this 0.95 probability of including the true regional incidence 20-year period. Again, children 24-59 mo of age had the represented by the study data [13]. We also used these lowest estimated incidence rate at 2.3 episodes/child distributions of predicted incidences by region to deter- year. Overall incidence rates declined from 1990 to 2010 mine if observed differences were spuriously detected (p < 0.05) in all regions with the greatest decline and within random prediction error, or whether the dif- observed in Africa (4.2 to 3.3 episodes/child year). In ference in incidence over time is statistically supported 2010, each child experienced an estimated 2.9 episodes
Fischer Walker et al. BMC Public Health 2012, 12:220                                                                       Page 4 of 7
http://www.biomedcentral.com/1471-2458/12/220

  Figure 2 Location of studies reporting Diarrhea incidence outcomes for children and adults.

resulting in nearly 1.7 billion diarrhea episodes among                  age (i.e. with 6-11 mo olds having the highest inci-
children less than 5 years of age in low- and middle-                    dence). The decline we present here from 1990 and
income countries.                                                        2010 is strongly correlated with the overall decline in
                                                                         under 5 mortality rates observed during this same per-
Discussion                                                               iod. With the model presented here we observe overlap-
We estimated diarrhea incidence rates among children                     ping uncertainty bounds for the point estimates, yet still
under 5 years of age living in low- and middle-income                    observe a statistically significant decline over time when
countries in 6 WHO regions and for the world for 1990                    testing the statistical significance of the rate of decline
and 2010. We found that while diarrhea incidence has                     using the bootstrap model.
declined from an estimated 3.4 episodes/child year in                      Our estimates are in line with previously published
1990 to 2.9 episodes/child year in 2010, the highest bur-                estimates of 2.2 episodes/child year in 1980, [6] 2.6 epi-
den of disease has remained consistent with respect to                   sodes/child year in 1990, [7] and 3.2 episodes/child year

Table 1 Diarrhea incidence rates by WHO region for 1990
                                                                                    Age
                                                        Episodes of Diarrhea per child year (Uncertainty bounds)
Region                            0-5 months           6-11 months           12-23 months         24-59 months       0-59 months
Africa                            4.3 (2.9, 7.6)       6.5 (4.7, 11.6)        5.3 (3.6, 9.3)        3.4 (2.3, 6.0)    4.2 (3.0, 7.3)
Americas                          4.6 (3.4, 5.8)       7.0 (5.3, 8.4)         5.7 (4.3, 6.6)        3.6 (2.6, 4.6)    4.5 (3.4, 5.3)
Eastern Mediterranean             3.6 (1.8, 5.9)       5.4 (3.0, 8.3)         4.4 (2.4, 6.6)        2.8 (1.6, 4.3)    3.5 (2.0, 5.2)
Europe                            4.5 (3.3, 5.7)       6.9 (5.2, 8.2)         5.6 (4.3, 6.5)        3.6 (2.5, 4.5)    4.4 (3.4, 5.2)
South East Asian                  3.1 (2.0, 4.6)       4.7 (3.3, 6.3)         3.8 (2.7, 5.0)        2.4 (1.8, 3.1)    3.0 (2.2, 3.8)
Western Pacific                   2.6 (1.5, 3.3)       4.0 (2.2, 4.8)         3.2 (1.8, 3.7)        2.0 (1.2, 2.4)    2.5 (1.4, 2.8)
Global                            3.4 (2.6, 4.7)       5.3 (4.4, 6.4)         4.3 (3.5, 5.1)        2.7 (2.2, 3.3)    3.4 (2.9, 3.9)
Fischer Walker et al. BMC Public Health 2012, 12:220 Page 5 of 7
http://www.biomedcentral.com/1471-2458/12/220
Table 2 Diarrhea incidence rates by WHO region for 2010
Age
Episodes of Diarrhea per child year (Uncertainty bounds)
Region 0-5 months 6-11 months 12-23 months 24-59 months 0-59 months
Africa 3.4 (2.1, 5.6) 5.1 (3.4, 8.1) 4.2 (2.7, 6.4) 2.7 (1.7, 4.2) 3.3 (2.2, 5.1)
Americas 4.1 (2.9, 5.2) 6.2 (4.7, 7.5) 5.0 (3.9, 5.8) 3.2 (2.3, 4.0) 4.0 (3.1, 4.7)
Eastern Mediterranean 3.1 (1.5, 5.2) 4.7 (2.4, 7.0) 3.8 (1.9, 5.4) 2.4 (1.3, 3.6) 3.0 (1.6, 4.4)
Europe 4.1 (3.0, 5.3) 6.3 (4.8, 7.6) 5.1 (3.9, 5.9) 3.2 (2.3, 4.1) 4.0 (3.1, 4.7)
South East Asian 2.4 (1.4, 4.0) 3.7 (2.2, 5.6) 3.0 (1.8, 4.3) 1.9 (1.2, 2.6) 2.4 (1.5, 3.3)
Western Pacific 2.3 (1.3, 3.1) 3.5 (2.0, 4.4) 2.9 (1.6, 3.3) 1.8 (1.1, 2.2) 2.3 (1.3, 2.6)
Global 2.9 (2.1, 4.3) 4.5 (3.4, 5.7) 3.6 (2.8, 4.4) 2.3 (1.8, 2.8) 2.9 (2.3, 3.4)
in 2003 [8]. Differences can be easily explained by our much age-specific data as possible is critical to the
updated search strategy and difference in age-adjust- improvement of the estimation process. We also used
ment as part of the analytic methods. We conducted an country level covariates as part of the regression model.
extensive literature review and included languages and These country-level data improve upon taking simple
databases that may have been overlooked in the past. In weighted means or median incidence rates by allowing
addition, the passage of time afforded us the opportunity for the influence to vary based on the location of the
to include more studies that were not included in the input studies and national level data.
past. With these changes the total number of included We recognize our study has several limitations. While
studies went from 27 in the most recent 2003 estimate the 72 studies identified and included in this analysis
[8] to 72 in our current review and analysis. However, represent a substantial improvement upon past esti-
despite this increase in total studies identified, very few mates, this number of studies is still low considering an
(n = 14) of theses are from 2000 or beyond thus the inclusion period for studies of more than 30 years. In
need for more recent data to better estimate current addition, while we are estimating using all data for two
incidence rates remains an issue. time periods it should be pointed out that only 14 of
We have also employed a number of analytic changes these studies contained data from the year 2000 and
that we believe strengthen the estimation process and beyond. Thus, estimates for the recent past (i.e. 2010)
the certainty of our final estimates. We used an analytic are predominantly based on older data relying on
method not previously used in diarrhea incidence calcu- changes in model level covariates to adjust for diarrhea
lations, i.e. the Expectation Maximization algorithm, to incidence changes over time rather than empirical data.
incorporate incidence rates reported by authors for non- This lack of data highlights the paucity of routine cohort
standard age categories (i.e. any age category other than studies conducted within the last decade raises great
0-5, 6-11, 12-23, 24-35, 36-48, and 0-59 mo). In the concern given that the estimates presented here con-
past, age-specific data was only used if it fit into these tinue to suggest that diarrhea is an enormous health
(or fewer) standard age categories. Unfortunately this burden for children in low- and middle-income
limited the inclusion of much of the age-specific data. countries.
We found data in 50 different unique age categories. We modeled diarrhea incidence for each country
Because incidence rates vary by age, the inclusion of as using published country level and under 5 mortality
Table 3 Total Diarrhea episodes among children under 5 years of age living in low- and middle-income countries for
1990 and 2010
1990 2010
WHO Region (number of low-/middle Episodes/ Population of Total Episodes/ Population of Total
income countries included in analysis) child year children under 5 child year children under 5
years years
Africa (45) 4.2 92,112,710 386,873,382 3.3 135,986,600 448,755,780
Americas (29) 4.5 55,097,140 247,937,130 4.0 55,069,550 220,278,200
Eastern Mediterranean (15) 3.5 60,682,760 212,389,660 3.0 66,458,970 199,376,910
Europe (23) 4.4 37,236,710 163,841,524 4.0 27,836,060 111,344,240
South East Asian (11) 3.0 175,764,800 527,294,400 2.4 182,015,100 436,836,240
Western Pacific (16) 2.5 143,774,300 359,435,750 2.3 110,854,400 254,965,120
Total Diarrhea Episodes 1,897,771,846 1,671,556,490Fischer Walker et al. BMC Public Health 2012, 12:220 Page 6 of 7
http://www.biomedcentral.com/1471-2458/12/220
rates. Ideally a model would include covariates such as surviving children. While both case fatality rates and
water and sanitation, breastfeeding practices, rotavirus incidence rates may be declining, both declines are
vaccine coverage, etc., i.e. indicators that are widely occurring too slowly given the breadth of available ther-
known to directly influence diarrhea morbidity rates. apeutic and preventive interventions. The coverage of
We attempted to include these indicators and sought therapeutic interventions, namely ORS and zinc remains
study level data for each of these during the initial poor throughout developing countries. Although water
abstraction process; however, unfortunately most pub- and sanitation services have improved since 1990, other
lished papers did not include study level data on these possible modes of enteric pathogen transmission, such
covariates. In our previous models, where study level as contaminated food or poor personal hygiene, may not
data were missing, we used country level indicators have. Exclusive breastfeeding practices for the first 6 mo
from DHS surveys, but during the modeling process of life and continued breastfeeding until 24 mo of age
these covariates did not prove to be predictive of diar- continue to need improvement in nearly all low- and
rhea incidence and fell out of all early versions of the middle-income countries. Because diarrhea has several
regression models. This is not surprising because small transmission routes, it can be hypothesized that simply
study sites can often be drastically different from the removing one such route does not eliminate the risk of
country where they are conducted with regard to com- diarrhea [16]. It has been observed that the protective
mon socioeconomic and child health indicators collected effect of improved water quality is greater among com-
in large cross sectional surveys. In addition, some inter- munities with improved sanitation conditions compared
ventions such as vitamin A supplementation, are better to higher contaminated areas [17]. Thus, for substantial
linked to reductions in diarrhea mortality than to reduc- changes in diarrhea incidence rates due to the most
tion in diarrhea incidence. In our final model we common pathogens, multiple transmission routes need
included only under 5 mortality rates. While we recog- to be eliminated simultaneously at the household and
nize that this indicator could also be improved with community level.
local, site-specific data to better relate the study level
incidence, it proved to be more statistically sound than Conclusions
indicators such as access to water and sanitation, that Children in low- and middle-income countries remain at
were tested in early versions. Gross National Income risk for frequent diarrhea episodes and thus for second-
(GNI) also fell out of the model due to colinearity with ary infections and the long-term sequel of delayed, or
reduction in under 5 mortality rates over time. never attained growth. It is becoming increasingly
Introducing new analytic methods has the potential important to focus on improved delivery strategies to
for new sources of error. We chose to use the ratio of enhance access to diarrhea prevention and treatment
age specific rates as a feature of the incidence data. programs as well as the development of new technolo-
These ratios can be observed in the raw study data gies including vaccines which may help future
where at least two ages are reported exactly as we have generations.
specified, i.e., as 0-5 mo, 6-11 mo, 12-23 mo, or 24-59
mo. Thirteen studies reported incidence rates for 0-5 Funding
mo and 6-11 mo; the average ratio of incidence (6-11 The study was supported by grants from the Bill and
mo compared to 0-5 mo) in the study data was 1.392, Melinda Gates Foundation to the US Fund for UNICEF
while our model predicts a ratio of 1.389. For the age for the Child Health Epidemiology Reference Group of
groups 6-11 mo and 12-23 mo (n = 10 studies), the the World Health Organization and UNICEF and to the
average ratio of incidence among study data for 12-23 University of Washington for the Global Burden of Dis-
mo compared to that for 6-11 mo was 0.780, while our ease Project. No funding bodies played any role in the
model predicts a ratio of 0.779. There are no studies design, writing or decision to publish this manuscript.
where 24-59 mo is reported along with another standard
age group. Endnote
a
Diarrhea incidence remains a tremendous burden on Africa: Algeria, Angoloa, Benin, Botswana, Burkina
children in low- and middle-income countries. Diarrhea Faso, Burundi, Cote d’Ivoire, Cameroon, Cape Verde,
has been shown to have a lasting influence on nutri- Centra African Republic, Chad, Comoros, Congo,
tional status in that an increase in diarrhea prevalence Democratic Republic of Congo, Eritrea, Ethiopia, Gabon,
has been linked to an increased risk of stunting [14] and Gambia, Ghana, Guinea-Bissau, Guinea, Kenya, Lesotho,
diarrhea has been shown to be a risk factor for pneumo- Liberia, Madagascar, Malawi, Mali, Mauritania, Mauri-
nia [15]. As diarrhea mortality rates continue to decline tius, Mozambique, Namibia, Niger, Nigeria, Rwanda, Sao
it becomes increasingly important to emphasize the role Tome and Principe, Senegal, Seychelles, Sierra Leone,
of frequent diarrhea episodes experienced by the South Africa, Swaziland, Togo, Uganda, United RepublicFischer Walker et al. BMC Public Health 2012, 12:220 Page 7 of 7
http://www.biomedcentral.com/1471-2458/12/220
of Tanzania, Zambia, Zimbabwe. Americas: Antigua and 3. Brown KH, Peerson JM, Baker SK, Hess SY: Preventive zinc
supplementation among infants, preschoolers, and older prepubertal
Barbuda, Argentina, Belize, Bolivia, Brazil, Chile, Colom- children. Food Nutr Bull 2009, 30:S12-S40.
bia, Costa Rica, Cuba, Dominica, Dominican Republic, 4. Beaton GH, Martorell R, L’Abbe : Effectiveness of vitamin A supplementation
Ecuador, El Salvador, Grenada, Buatemala, Guyana, in the control of young child morbidity and mortality in developing countries
Toronto: International Nutrition Program; 1993.
Haiti, Honduras, Jamaica, Mexico, Nicaragua, Panama, 5. Santosham M, Chandran A, Fitzwater S, Fischer-Walker C, Baqui AH, et al:
Peru, Saint Lucia, Saint Vincent, Suriname, Uruguay, Progress and barriers for the control of diarrhoeal disease. Lancet 2010,
Venezuala. Eastern Mediterrean: Afghanistan, Djibouti, 376:63-67.
6. Snyder JD, Merson MH: The magnitude of the global problem of acute
Egypt, Iran, Iraq, Jordan, Lebaon, Libyan Arab Jamahir- diarrhoeal disease: a review of active surveillance data. Bull World Health
iya, Moocco, Pakistan, Somalia, Sudan, Syrian Arab Organ 1992, 60:605-613.
Republic, Tunisia, Yemen. Europe: Albania, Armenia, 7. Bern C, Martines J, de Zoysa I, Glass RI: The magnitude of the global
problem of diarrhoeal disease: a ten-year update. Bull World Health Organ
Azerbaijan, Belarus, Bosnia and Herzegovinia, Bulgaria, 1992, 70:705-714.
Georgia, Kazakhstan, Kyrgyzstan, Latvia, Lithuania, Mol- 8. Kosek M, Bern C, Guerrant RL: The global burden of diarrhoeal disease, as
dova, Montenegro, Occupied Palestian Territory, Roma- estimated from studies published between 1992 and 2000. Bull World
Health Organ 2003, 81:197-204.
nia, Russian Federation, Serbia, Tajikistan, TFYR 9. Meng XL: The EM algorithm and medical studies: a historical link. Stat
Macedonia, Turkey, Turkmenistan, Ukraine, Uzbekistan. Methods Med Res 1997, 6:3-23.
South East Asia: Bangaldesh, Bhutan, Dem. People’s 10. Hartley HO: Maximum likelihood estimation from incomplete-data.
Biometrics 1958, 14:174-194.
Republic of Korea, India, Indonesia, Maldives, Myan- 11. Dempster AP, Laird NM, Rubin DB: Maximum likelihood from incomplete
man, Nepal, Sri Lanka, Thailand, Timore Leste. Western data via the EM algorithm. J Royal Stat Soc Series B (Methodological) 1977,
Pacific: Cambodia, China, Fiji, Kiribati, Lao People’s 39:1-38.
12. Efron B: Second thoughts on the bootstrap. Stat Sci 2003, 18:135-140.
Democratic Republic, Malaysia, Marshall Islands, Mon- 13. Carpenter J, Bithell J: Bootstrap confidence intervals: when, which, what?
golia, Papua New Guinea, Philippines, Samoa, Solomon A practical guide for medical statisticians. Stat Med 2000, 19:1141-1164.
Islands, Taiwan, Tonga, Vanuatu, Viet Nam. 14. Checkley W, Buckley G, Gilman RH, Assis AM, Guerrant RL, et al: Multi-
country analysis of the effects of diarrhoea on childhood stunting. Int J
Epidemiol 2008, 37:816-830.
Additional material 15. Schmidt WP, Cairncross S, Barreto ML, Clasen T, Genser B: Recent
diarrhoeal illness and risk of lower respiratory infections in children
under the age of 5 years. Int J Epidemiol 2009, 38:766-772.
Additional file 1: Characteristics of included studies.
16. Briscoe J: Intervention studies and the definition of dominant
Additional file 2: Diarrhea Incidence Rates for Included Countries. transmission routes. Am J Epidemiol 1984, 120:449-455.
17. VanDerslice J, Briscoe J: Environmental interventions in developing
countries: interactions and their implications. Am J Epidemiol 1995,
141:135-144.
Acknowledgements
The authors thank Geoffrey Buckle and Jennifer Applegate for their role in Pre-publication history
conducting the systematic review and abstracting the data. The pre-publication history for this paper can be accessed here:
http://www.biomedcentral.com/1471-2458/12/220/prepub
Author details
1 doi:10.1186/1471-2458-12-220
Johns Hopkins Bloomberg School of Public Health, Department of
Cite this article as: Fischer Walker et al.: Diarrhea incidence in low- and
International Health, 615 N. Wolfe St, Baltimore, MD 21205, USA. 2Division of
middle-income countries in 1990 and 2010: a systematic review. BMC
Biostatistics, Department of Oncology, Sidney Kimmel Comprehensive Public Health 2012 12:220.
Cancer Center, Johns Hopkins University, Baltimore, Maryland 21205, USA.
3
Department of Child and Adolescent Health and Development, World
Health Organization, Avenue Avia 20, Geneva 27, Switzerland.
Authors’ contributions
CLFW designed the study, conducted the search, interpreted the final
results, and wrote the manuscript. JP and MA conducted the analysis and
assisted with the manuscript. CPB and REB also helped to design the study,
conduct the search, interpret the results, and contributed to the final
manuscript. All authors read and approved the final manuscript.
Competing interests Submit your next manuscript to BioMed Central
The authors declare that they have no competing interests. and take full advantage of:
Received: 31 October 2011 Accepted: 21 March 2012 • Convenient online submission
Published: 21 March 2012
• Thorough peer review
References • No space constraints or color figure charges
1. Black RE, Cousens S, Johnson HL, Lawn JE, Rudan I, et al: Global, regional, • Immediate publication on acceptance
and national causes of child mortality in 2008: a systematic analysis.
• Inclusion in PubMed, CAS, Scopus and Google Scholar
Lancet 2010, 375:1969-1987.
2. Lamberti LM, Fischer Walker CL, Noiman A, Victora C, Black RE: • Research which is freely available for redistribution
Breastfeeding and the risk for diarrhea morbidity and mortality. BMC
Public Health 2011, 11(Suppl 3):S15. Submit your manuscript at
www.biomedcentral.com/submitYou can also read